 Here are my Top 10 watches for GPS accuracy that have so far managed to complete my standard test route.
I have a 10 mile test route (16.6km) for accuracy of my GPS devices following a known track. It covers very many different types of environmental hazards to GPS accuracy such as buildings, trees and bridges/tunnels.
Below are the results of the RUNNING tests to date. All the raw files and the spreadsheet analysis that arrived at this table are linked to below.
| 1 | Suunto | Spartan Sport | pre GPS fix | 81% |
| 2 | TomTom | Runner 3 | 79% | |
| 3 | Suunto | SPARTAN Sport | post gpsfix+GLONASS | 79% |
| 4 | TomTom | Adventurer | 79% | |
| 5 | Polar | V800 | 77% | |
| 6 | Garmin | Forerunner 235 | 73% | |
| 7 | Polar | M400 | 71% | |
| 8 | Polar | V800 | UNDERSIDE WRIST | 65% |
| 9 | Suunto | Spartan Ultra | pre GPS fix | 65% |
| 10 | Polar | M600 | 63% | |
| 11 | Garmin | 920XT | 63% | |
| 12 | Epson | SF-810 | 62% | |
| 13 | Suunto | SPARTAN Ultra | post gpsfix+GLONASS | 58% |
| 14 | Lezyne | Super GPS | ARMBAND | 58% |
Other watches will be added over time but, as I’ve now done more than ten, a TOP 10 seemed an appropriate post to write.
(Here) is my full methodology, source FIT/TCX files and link to the route. The methodology and route are generally good and challenging respectively, IMO.
The analysis obviously has flaws in that it is based on my subjective view of each GPS track and how it follows a precisely known route (although you are free to download the raw data and come to a different opinion). There are also other flaws in that I don’t have the opportunity to run this route repeatedly with the same device day-after-day to gain multiple data sets for each device. Tree cover and inherent GPS accuracy may well vary from day-to-day or month-to-month and indeed GPS is only supposed to be accurate to 5m in any case. (4.5m with GLONASS, supposedly)
I’m not a scientist, I only have so much time to do this. This is not supposed to represent a scientific method. Please take my views as well as those of others who post route images on forums to arrive at your own conclusions.
However there is some value to the data as most of it also broadly ties in with my perceptions of other runs I have performed with the same devices over different routes.
I wouldn’t get too focussed on, for example, the SPARTAN SPORT having the best score. Maybe it should be 78% or 77% or 76%. BUT it certainly should NOT be 60%. So allow there to be some “reasonable inaccuracy levels” in my subjective interpretation of the data. I appreciate that the SPARTAN ULTRA and SPORT SHOULD be the same and I appreciate a lot of early SPARTAN buyers were not happy with the accuracy of their devices – I can only report what I found.
Similarly the TomTom Runner 3 and TomTom Adventurer are essentially the same watch and, as you can see, they got the same score. If you look at the tracks, from the files provided above, you will see that there are obviously differences in the tracks but that the overall performance is broadly the same. Hence it’s no surprise they got a similar (identical) overall score.
I overlay the GPS tracks on top of each other to compare them that way and to the route I took, which I know precisely.
I would also add that I use my Garmin 920XT quite a lot for training. Even though it scored 63% I would say that such an accuracy level is good enough for me for much of the time to: record overall distances; to measure splits; to produce a track of where I’ve been. BUT I don’t navigate with it and I don’t rate it’s calculation of instant pace at all (a footpod is needed).
I would also point out the Suuntos: they should be the same as, like the TomToms they are essentially the same watch, but are clearly very much NOT the same. My only explanation could be variations in some of the hardware components or its assembly.
Comparing Total Recorded Distances: One surprising finding is that the total distances measured FOR EVERY DEVICE was within 1% of the average. Thus over the 16km route we are talking about 100-200m of variation. That’s not a lot, IMO. But this clearly illustrates that just because a device gives the ‘correct’ distance then it by no means indicates how well that device has recorded the nuances of the route.
Note: The best result was obtained when cycling with a MIO CYCLO 505HC and the worst was cycling with my smartphone. All the results above are arm-worn or wrist-worn whilst running.
Also of interest is the results of the V800. This indicates that when devices are worn in a sub-optimal wrist position, a notable reduction in accuracy can be observed.
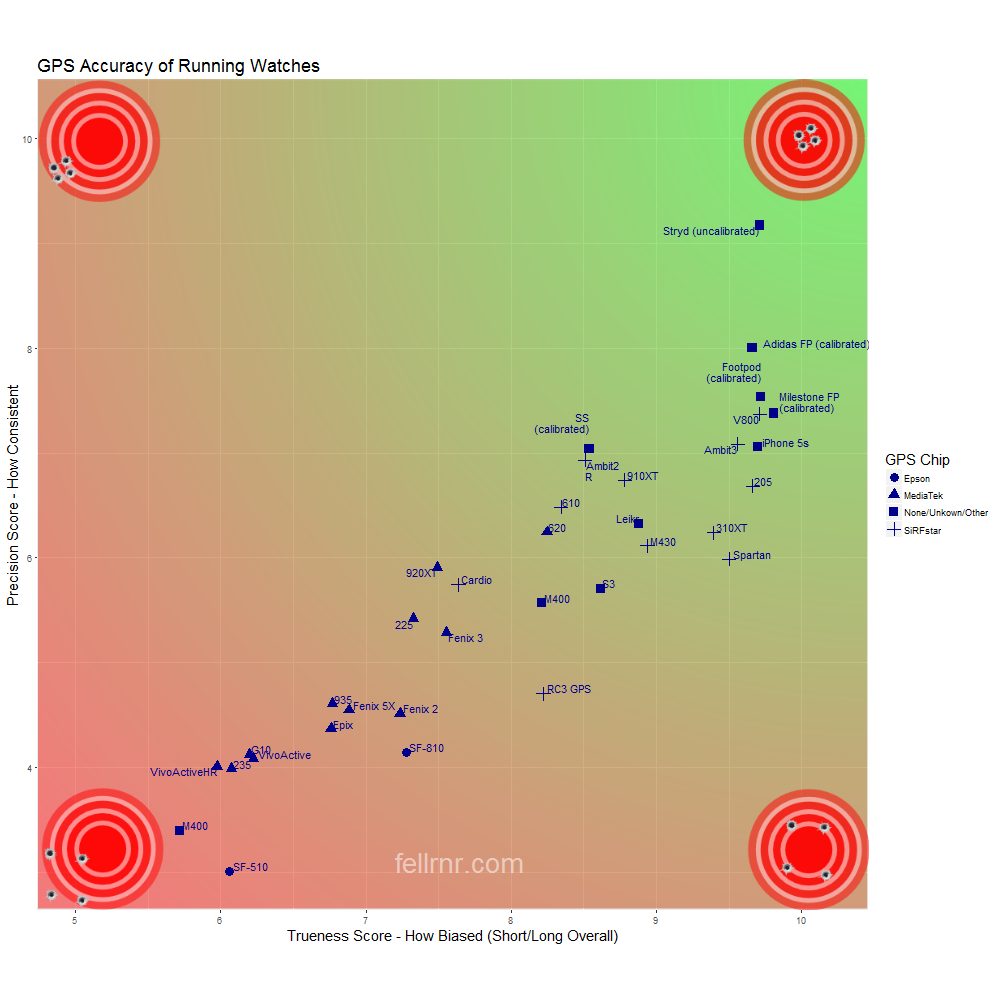
Alternative data: For balance here is some alternative data from others. DCR states the 920XT to have “consistently impressive results when it comes to GPS accuracy with GLONASS enabled” which is clearly a much better performance than what I found. Also, the chart below, is from @fellrnr, Jonathan Savage, and the image clicks through to his site. Some of his findings broadly agree with mine eg the 920XT’s mediocre performance. Whereas others differ to my findings eg the M400 is found to be worse by Jonathan.
Also of interest on the chart is that Jonathan also indicates the manufacturer of the chipset and it seems fairly clear that the SiRFstar chips tend to perform better than MediaTek. I believe that Suunto use the latest SiRFstar chip. Jonathan does great work but what he does also lacks in that it does not address device-level variability (eg 2x Suunto SPARTANs could perform differently).
Last Updated on 16 January 2026 by the5krunner
My favourite kit and nutrition
- Injinji – Runners protect your toes. Avoid discomfort and minor injury. Run more. run faster. I use them.
- Garmin 90-degree charging adapter — the small adapter that keeps your charging cables tidy. Essential for race day. I use one.
- Garmin charging puck — the fastest and most reliable way to top up your Garmin before a session. I use one.
- Ravemen FR300 — front light that mounts directly under your Garmin or Wahoo head unit. Keeps your bars clean and your beam pointed where it matters. I use one.
- Body Glide – The Blue anti-chafe stick that all swimmers and many runners use. I use it.
- Maurten — the race nutrition trusted by elite athletes. Gels and drink mix engineered to be easy on the stomach. I use them.
- Garmin Varia RTL515 — radar rear light that alerts you to vehicles approaching from behind. Pairs with your Edge or Garmin watch. I use this model.
- Favero Assioma Pro RS2 — the power meter pedals most serious cyclists end up choosing. Accurate, easy to move between bikes. I use this model.
Reader-Powered Content

This content is not sponsored. It’s mostly me behind the labour of love, which is this site, and I appreciate everyone who supports it.
Support the site: Follow (free, fewer ads) · Subscribe (paid, ad-free) · Buy Me A Coffee ❤️
All articles are written by real people, fact-checked, and verified for originality. See the Editorial Policy. FTC: Affiliate Disclosure — some links pay commission. As an Amazon Associate, I earn from qualifying purchases.

tfk is the founder and author of the5krunner, an independent endurance sports technology publication. With 20 years of hands-on testing of GPS watches and wearables, and competing in triathlons at an international age-group level, tfk provides in-depth expert analysis of fitness technology for serious athletes and endurance sport competitors. ID

Interesting stuff. I’ve only got experience of the 920XT on that list and find it gives me consistent results (the same run reporting the same distance) even if the maps that get drawn afterwards are a bit questionable (I run a lot along canal towpaths and the GPS trail suggests that I spend a lot of time in the canals). I’d also say that my 920XT has it fairly easy, a bit of light tree cover being the toughest it normally has to deal with so perhaps it should do better.
consistent and accurate are two different things! I’m measuring accuracy and GPS is only accurate to 5m (GLONASS to 4.5m, I understand)
Wow, quite surprised in the lack of Garmin watches here (overall). You’d think, the company known for GPS, would be better off than anyone else. I will admit my Fenix 3hr isn’t great for GPS. The watch has recorded me too many times apparently running through my neighbors house than the trail I was on. Makes it really hard to compete segments with locals when it means they commit felony trespassing to do it. 🙂
🙂 careful where you run! These are the only ones I’ve done…more to come. Trying to keep the net spread wide to avoid accusations of Garmin bias 🙂 🙂 … or could it be that my ‘friends’ don’t give the loan devices back 😉
Have you raised the Ultra v Sport issue with Suunto, would be interested in their response as now there is a GPS fix out they can’t hide behind ‘known GPS issue’ any longer
have twittered it. I don’t have any special relationship with their devt/support teams.
Thanks for taking the time to perform the tests and summarize the results!
thank you for the thanks. Lots more to do…
Where does the Forerunner 935 sit?
935 is best garmin performer at 79% (same as F3…three…funnily enough)