Garmin Running Power Comparison – VO, GCT, Hills, Track, Snow, Dark, Stupidity
Today’s run was to look at Garmin Running Power some more. This long-run had all the wahoo elemnts of a great blog post: VO, GCT, Hills, Track, Snow, Dark, Cold & Stupidity. Luckily I missed out the part entitled ‘Injury’ before I got home.
What I tried to do:
Firstly: Run at a half-decent speed 6:00/mile around St Mary’s running track for a km and collect data to compare Ground Contact Time and Vertical Oscillation with Garmin’s Running Power AND ALSO STRYD AND ALSO RunScribe.
Secondly: Then head off via Richmond Hill to my favourite ‘ 3-minute’ hill in Richmond Park (the ominously and appropriately named Dark Hill). There I planned to do some hill running up and down at a target of 260w (on STRYD). Hopefully, all three devices would show power-constancy (ahem) and my heart rate would also be constantish as power pacing should be moderating my efforts.
“The best-laid plans of mice and Garmen.” Robert Burns (sorry Scotland for the misquote)

Why?
It seemed like a good idea at the time.
But really I wanted to do a sanity check that all 3 Running Power ‘Systems’ at least shared a common vision of some of the inputs to their models.
Also, it’s something to write about.
What I didn’t try to do
Science
I’ll leave that to others. I major in opinions and anecdotes, which I personally find far more entertaining.
What I expected
- Call me cynical: GCT and VO will all be quite different even on a windless track.
- Yet again I would be unable to execute a constant 260w up+down that darned hill (I’ve tried several times to be constant and usually fail)
RunScribe POWER is in beta with ongoing modification to the PACE algorithm as I write BUT the Ground Contact Time (GCT) should be good.
Conditions
England had about an inch of snow today. Anyone living in England knows that this will bring the entire country to a grinding halt. SW London, where I am, got ‘a bit less’ snow. Nevertheless, it was enough to put me off going out until it had stopped. Therein lay my first mistake. The end of my run would be in darkness…up Dark Hill. In the snow.
There was no wind…handy. I had the wind adjustment turned off in Garmin Running Power in any case. There were 40mph winds forecast a little earlier so I didn’t want that somehow getting into the calculations.
The inner two lanes of the track were closed…no problemo. The other lanes were equally as flat, albeit a bit slushy and a bit longer. I had the remnants of a mini snowman to dodge in lane 3.
Dark Hill in Richmond Park has a trail going up it. The trail gradually gets steeper. I’d say it was a little too steep for hill reps at the top. It handily has a flat bit after the summit as well as a flat bit at the bottom. There are a few nasty bumps for those running in the cold, pitch blackness of a December night without a torch.
If I was doing intervals up it I’d be aiming for 350-400w. But 250w is a sensible number as I can also do the same 250w coming down. Any faster and it’s a little to fast for my normal gait and would involve me braking, etc etc.
250w coming down at night was NOT hairy. But any faster would have been.
I curtailed plans to do more than 3x [up+summit+down] as the slush was starting to freeze. 3 iterations were enough, hopefully.
Kit + Data
- Suunto SPARTAN Trainer with STRYD – luckily I had set my reference STRYD power data field to be really small on this fairly small screen. You know the size you can’t read when you are bouncing around. Luckily the backlight is good and stayed on. #sigh.
- Movescount writes power to the standard cycling Power field. #handy
- Elevation data was corrected using GPS/SRTM by me
- VO/GTC aren’t saved by the SPARTAN #Grrrr. Luckily the STRYD pod caches the special data.
- Vertical Oscillation (Standard Track name) was copied to CADENCE (for display purposes. via cached FIT file from POD/PowerCenter)
- Ground Contact Time (Standard Track Name)was later copied to CADENCE (for display purposes, via cached FIT file from POD) from standard GCT field
- Movescount writes power to the standard cycling Power field. #handy
- Garmin 935+HRM-TRI+Garmin “Running Power” data field. Wind off.
- RP_Power IQ is the power data field name
- Elevation data was deleted (for display clarity)
- Vertical Oscillation was copied to CADENCE (for display purposes)
- Ground Contact Time was later copied to CADENCE (for display purposes) from standard GCT field
- Garmin 235 + RunScribe Plus DataField App (My RunScribes have the aluminium strips and the ANT+ message rate is 8Hz)
- PowerIQ is the power data field name
- Elevation data was deleted (for display clarity)
- Ground Contact Time (name: Contact Time IQ) was later copied to CADENCE (for display purposes) from “ContactTime IQ”
- Vertical Oscillation – hmm slight problem. RunScribe doesn’t show that. #Grrrr
It’s actually quite hard to compare all the data as they are stored in differently named developer CIQ fields in the various FIT files, as indicated above. I used the magic of SportTAll Postsracks 3.1 and Custom Data Tracks to reference and copy the above-named data fields into the standard fields in SportTracks.
Comparisons
Recap: It’s a 70 minute session immediately starting with a one km track run then straight into an even paced run to a practice hill; Richmond Hill. Into Richmond Park and down a long hill before finishing with 3 reps up and down Dark Hill with the latter reps aiming to get a constant 250w (STRYD) power UP and DOWN the hill.
Power Comparison
Here is a high level comparison. I’m used to the STRYD power data (green) and overall it broadly looks like what I would expect. The RunScribe power (don’t forget in beta) seems to exaggerate the highs and lows too much but that would reflect my bias and familiarity with the STRYD data…RunScribe could very well be ‘correct’ for all I know. However at the end on the downhill part of the 3 reps of Dark Hill you will see that RunScribe reports much higher power; I’m not sure that’s right but there was some braking going on downhill. Although having expressed my uncertainty at RunScribe we should note that STRYD have tinkered with the uphill/downhill sections of their algorithm at various times over the last year. Garmin Running Power seems plausibly constant around the track at the start, in the middle bits of the overall run it seems high at times, but plausible, and on the three reps at the end it superficially looks plausible. However I’m not quite so sure about how it handles the downhill bits.

And yes I know you are now going to ask for pace and elevation 😉
Here is the exact same comparison overlain with CORRECT elevation. The chart starts to get messy but is still just about readable.

Here are elevation and pace overlain ONLY on STRYD power. I can’t add pace to the above chart and it still be readable (3 lots of pace would appear and all 3 would be different). The chart below just gives you the sense that the pace WAS broadly constant for the 6:00/mile pace right at the start and that there was a vague semblance of maintaining power on the last 3 hills (up and down) but on those hills the pace dropped a lot…probably to 9:00/mile near the top on the steep bit.

Finally let’s revisit those last 3 hill reps. Here is my heart rate (HRM-TRI not any optical HR nonsense) overlain on the corrected elevation track. The HR looks a bit up and down; but on the last two hill reps it varied between 153 and 161bpm. If I was running at a constant effort then I suppose the HR should be constant but that HR range is not too shabby IMHO. Remember I was trying to run to a wattage by glancing at a small bouncing backlit display, looking away and estimating my RPE and then looking back again…in the dark and in the slush/snow/ice.
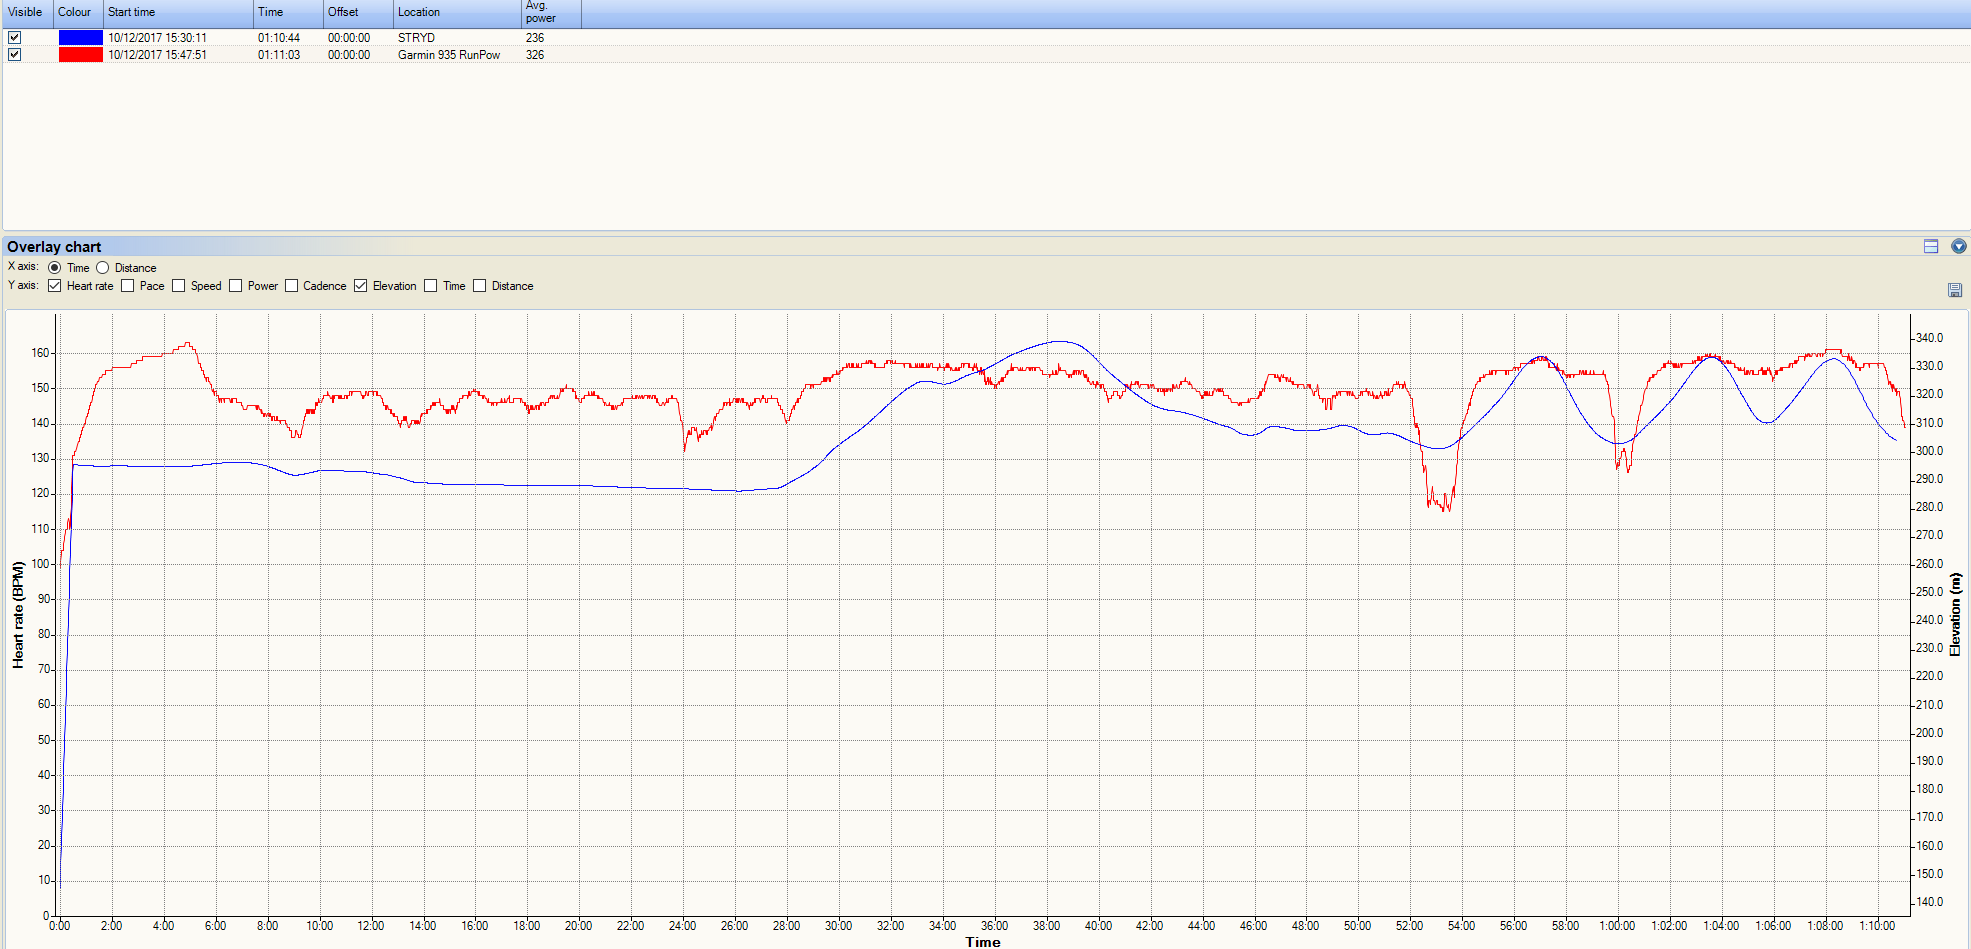
The 160bpm is a sub threshold (AT2) effort for me. Something like that.
I think if I were racing then personally I would be better able to judge by RPE whichever physiological ‘edge’ I was running on for the distance in question. IE I think I can do it better than by using watts
I do sometimes train by watts but it’s mostly really alongside some other measure and/or just on watts as something different to do. It kinda spices things up sometimes. What I specifically and definitely personally benefit from with power is capping my efforts uphill and prompting myself to go harder downhill. That’s the same for me with cycling too. I can get a bit carried away sometimes. Watts are my mum, nagging me over my shoulder 😉 Sorry mum.
Notes: If you are trying to do something similar to this compairosn yourself, my suggestion would be to go for a longer, less steep hill. You’ll see from the earlier, practice hill that I probably did a better job of up/downhill pacing by wattage when I wasn’t buffeted by changes in gradient and the time pressure of about 3 minutes to get it right. Also it is a REAL faff comparing all the data afterwards. This post and the workout that supports it probably will take 5-7 hours of time. I’ll make about 30cents from those annoying adverts that keep appearing…sorry. Donations appreciated (top right)!
Vertical Oscilation – Comparison
 Vertical Oscillation (VO) is copied to the Cadence field to let me overlay two tracks. RunScribe does not store VO.
The VO data is shown on the image to the right. It is NOT that insightful.
We are only looking at the VO movement in the very first 5-6 minutes on the track, so I have zoomed in to that with a software tool that’s not really designed for zooming.
In my case, Garmin Running Power is collecting Vertical Oscillation from the chest (HRM-TRI) rather than an RD-POD but STRYD is collecting it from one foot’s movement via their pod
The data is clearly of a different magnitude but broadly each set of data seems to trend with each other. I would imagine that the differences in magnitude are factored into each supplier’s algorithms.
Technically I believe I am right in saying that VO is measured as movement of the torso – so Garmin’s device is in the correct psoition and should measure VO better.
Conclusion: Zip. Nada. Rien. 4/10 on the ‘vaguely interesting scale’ perhaps?
Ground contact Time – Comparison
Ground Contact Time is copied to the Cadence field to let me overlap three tracks.
This one is more interesting in that RunScribe and STRYD pretty much agree. Garmin Running Power is quite different.
Whilst different parts of the body may well oscillate to differing degrees (see the VO above) I would have thought that the time you are in contact with the ground is a given fixed quantity per footfall.
I would be (vaguely) interested to see how the GCT from an RD-POD varied from that determined by me from the HRM-TRI. If the GCT from those 2 different sources are themselves different then does the Garmin algorithm know to handle them differently? ie do they adjust based on the source hardware? I strongly suspect that the answer is YES. I strongly suspect this is why Garmin will not allow non-Garmin sensors (other than speed/pace) to input into their model – and if my suspicion is true then I suppose Garmin’s decision to exclude the likes of Wahoo TICKR HRMs on the grounds of “accuracy” is OK…not that Wahoo are inaccurate but rather that they will be differently accurate (hmmm !!!) and hence the overall algorithm may well not work to produce a sensible power figure. Assuming, that is, you think it produces a sensible figure right now.

GCT Conclusion: Something here needs to be investigated further with GCT.
Overall Conclusion
I’m trying to show this data ‘as I found it’. I guess I have an inherent bias and familiarity with STRYD. STRYD’s power data just seems broadly right to me in the sense that it seems to be a reasonable proxy for effort.
I was specifically trying to run to what STRYD said was the power level.
I think RunScribe are in a reasonably good place with their Beta power metric. It doesn’t look right to me yet but, I’ll say it again, it’s in beta. It’s close.
My considered, scientific view of Garmin Running Power data is that it’s ‘a bit up and downy‘ 😉 ie it sometimes seems a bit more variable than my perceived effort levels at the time. I’m a little bit troubled by the GCT difference but, hey, sample size of ONE and all that.
The End.
Data Files are here: https://www.dropbox.com/sh/psdyxm93y2m12j3/AABNlbBRsF2E3edvzqnnMPC4a?dl=0 in 10Dec2017 folder.
amzn_assoc_tracking_id = “the5krunner-20”;
amzn_assoc_ad_mode = “manual”;
amzn_assoc_ad_type = “smart”;
amzn_assoc_marketplace = “amazon”;
amzn_assoc_region = “US”;
amzn_assoc_design = “enhanced_links”;
amzn_assoc_asins = “B06XGD6CS4”;
amzn_assoc_placement = “adunit”;
amzn_assoc_linkid = “a1aa3ad7b6c41a240ac3f304fa71b3ac”;
amzn_assoc_tracking_id = “the5krunner-20”;
amzn_assoc_ad_mode = “manual”;
amzn_assoc_ad_type = “smart”;
amzn_assoc_marketplace = “amazon”;
amzn_assoc_region = “US”;
amzn_assoc_design = “enhanced_links”;
amzn_assoc_asins = “B01MQX3306”;
amzn_assoc_placement = “adunit”;
amzn_assoc_linkid = “4e44e076d9b4d9aa5129dbc6b9beaa7e”;
amzn_assoc_tracking_id = “the5krunner-20”;
amzn_assoc_ad_mode = “manual”;
amzn_assoc_ad_type = “smart”;
amzn_assoc_marketplace = “amazon”;
amzn_assoc_region = “US”;
amzn_assoc_design = “enhanced_links”;
amzn_assoc_asins = “B01NBL9XGP”;
amzn_assoc_placement = “adunit”;
amzn_assoc_linkid = “aff84fdd3fe011c52768c528e8e4ae88”;
amzn_assoc_tracking_id = “the5krunner-20”;
amzn_assoc_ad_mode = “manual”;
amzn_assoc_ad_type = “smart”;
amzn_assoc_marketplace = “amazon”;
amzn_assoc_region = “US”;
amzn_assoc_design = “enhanced_links”;
amzn_assoc_asins = “B01N7J9APR”;
amzn_assoc_placement = “adunit”;
amzn_assoc_linkid = “f25fa1fec44379526da3cc76121a16bc”;
Related reading: WAHOO ELEMNT – £73 off now – definite buy.
Last Updated on 8 April 2026 by the5krunner
My favourite kit and nutrition
- Injinji – Runners protect your toes. Avoid discomfort and minor injury. Run more. run faster. I use them.
- Garmin 90-degree charging adapter — the small adapter that keeps your charging cables tidy. Essential for race day. I use one.
- Garmin charging puck — the fastest and most reliable way to top up your Garmin before a session. I use one.
- Ravemen FR300 — front light that mounts directly under your Garmin or Wahoo head unit. Keeps your bars clean and your beam pointed where it matters. I use one.
- Body Glide – The Blue anti-chafe stick that all swimmers and many runners use. I use it.
- Maurten — the race nutrition trusted by elite athletes. Gels and drink mix engineered to be easy on the stomach. I use them.
- Garmin Varia RTL515 — radar rear light that alerts you to vehicles approaching from behind. Pairs with your Edge or Garmin watch. I use this model.
- Favero Assioma Pro RS2 — the power meter pedals most serious cyclists end up choosing. Accurate, easy to move between bikes. I use this model.
Reader-Powered Content

This content is not sponsored. It’s mostly me behind the labour of love, which is this site, and I appreciate everyone who supports it.
Support the site: Follow (free, fewer ads) · Subscribe (paid, ad-free) · Buy Me A Coffee ❤️
All articles are written by real people, fact-checked, and verified for originality. See the Editorial Policy. FTC: Affiliate Disclosure — some links pay commission. As an Amazon Associate, I earn from qualifying purchases.

tfk is the founder and author of the5krunner, an independent endurance sports technology publication. With 20 years of hands-on testing of GPS watches and wearables, and competing in triathlons at an international age-group level, tfk provides in-depth expert analysis of fitness technology for serious athletes and endurance sport competitors. ID

damn, now I’m questioning my decision to wait for the FR645 to have the run with power metrics. maybe a FR235 + stryd would be better for the same price range? need more research now, thanks
FR235 has me running as fast i can go. FR935 tries to get me to go faster but it doesn’t seem to make any difference in reality. strange
note to self: must buy next even more expensive Garmin before 2018 tri season
The more expensive watch will make you faster. But don’t buy the most expensive one – presumably your body won’t be able to handle the speed of it. So maybe just buy upgrade by upgrade. ?
well, I do expect to go faster if the watch is red.
jokes aside, having 0 field experience in planning workouts to improve performance, i am thinking to leverage those informations and suggestions to run a bit better/faster.
but the truth is … i just like the pretty graphs and want to nerd around with the data, sigh
“having 0 field experience in planning workouts to improve performance” If you have a) some feeling for your body, b) get some startup help (e.g. https://the5krunner.com/personalised-coaching/) and c) you’re not underexposed, it’s not too difficult to learn.
“i just like the pretty graphs and want to nerd around” then buy ’em all.