 Some glimmers of hope for Fitbit with these positive results. Well, positive in the sense that they weren’t bad.
- Whilst still negative for the YTD, the Q3 was profitable.
- A good mix of repeat buyer and new customers.
- Non-US revenues are rising nicely.
- Still big dependence on the USA which is a declining territory for Fitbit
- Big increase in %age of smartwatch revenues (Ionic/Versa)
Nice job. And hopefully a good Q4 for them and everyone else.
—————- Press Release ————
Fitbit Reports Third Quarter 2018 Results
- Revenue of $394 million, GAAP Net Loss Per Share of ($0.01), Non-GAAP Net Income Per Share of $0.04.
- Re-affirms full year 2018 revenue guidance of $1.5 billion.
- Fitbit grows both tracker and smartwatch devices sequentially. #2 player in the U.S. smartwatch category.
SAN FRANCISCO–(BUSINESS WIRE)– Fitbit, Inc. (NYSE:FIT), the leading global wearables brand, today reported revenue of $394 million, GAAP net loss per share of ($0.01), non-GAAP net income per share of $0.04, GAAP net loss of $2 million, non-GAAP net income of $10 million, cash flow from operations of $59 million and free cash flow of $47 million for its third quarter of 2018.
“We have been incredibly focused on executing our transition plan and as a result, saw a return to profitability this quarter, and are re-affirming our full year revenue guidance of $1.5 billion. We succeeded in growing our healthcare business by 26% and diversifying our revenue to compete in the changing wearables category and saw sequential growth in both tracker and smartwatch devices,” said James Park, co-founder and CEO. “We are now the number two player in the smartwatch space in the U.S. – a category we just entered with zero share only fourteen months ago. We also launched our most advanced tracker yet, Fitbit Charge 3, which is blurring the lines between trackers and smartwatches and is already one of the top selling devices in the U.S. All this shows the power of the Fitbit brand and our ability to continue to deliver a wearable platform consumers love and that drives positive health outcomes.”
Third Quarter 2018
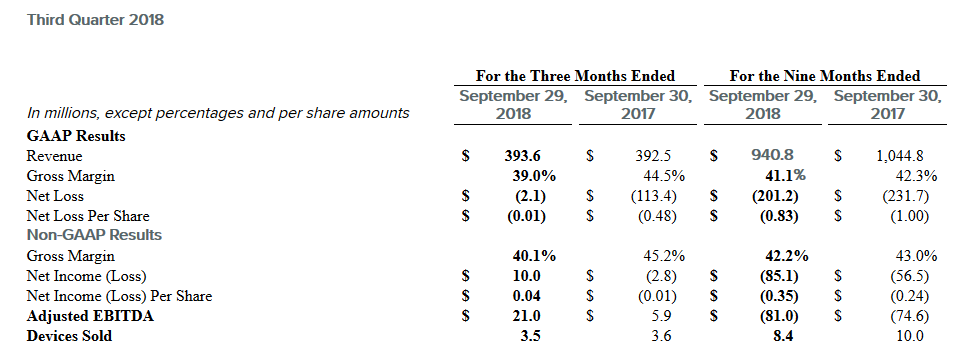
For additional information regarding the non-GAAP financial measures, see “Non-GAAP Financial Measures” and “Reconciliation of GAAP to Non-GAAP Financial Measures” below.Third Quarter 2018 Financial Highlights
- Sold 3.5 million wearable devices. Average selling price increased 3% year-over-year to $108 per device driven by the growing mix of smartwatches.
- U.S. revenue represented 58% of revenue or $230 million, down 6% year-over-year.
- International revenue represented 42% of revenue and increased 10% year-over-year to $163 million: EMEA revenue increased 17% to $104 million; Americas excluding U.S. revenue declined 2% to $25 million; and APAC revenue was relatively flat at $34 million, all year-over-year, respectively.
- New devices introduced in the past year, Fitbit VersaTM, Fitbit Charge 3TM, Fitbit AceTM and Fitbit Aria 2TM, represented 62% of revenue.
- GAAP gross margin was 39.0% and non-GAAP gross margin was 40.1%. Both GAAP and non-GAAP gross margins were negatively impacted by the change in mix towards smartwatches, partially offset by improved warranty costs.
- GAAP operating expenses represented 44% of revenue, and non-GAAP operating expenses represented 38% of revenue.
- GAAP impairment charge of $6 million to reflect the write-down of a minority equity investment.
Third Quarter 2018 Operational Highlights
- Diversified wearable device revenue from predominately trackers to smartwatches and trackers. Smartwatch revenue grew to 49% of revenue from less than 10% a year ago.
- Refreshed product line up. Versa outsold competitive offerings from each of Garmin, Samsung, Fossil in the U.S. Launched Charge 3 tracker device, our most advanced health & fitness tracker.
- Active community of users: 55% of our active users viewed Fitbit Feed in the quarter.
- 58% of activations came from new users, while 42% came from repeat buyers. Of the repeat buyers, 49% were previously inactive for 90 days or greater.
Fourth Quarter 2018 Guidance
- We expect revenue to be greater than $560 million, with device sales down and a higher average selling price.
- Non-GAAP net income per share of greater than $0.07.
- We expect gross margins to trend slightly higher from the third quarter.
- Capital expenditures as a percentage of revenue of approximately 5%.
- We anticipate free cash flow to be approximately $90 million.
- Non-GAAP effective tax rate of approximately 25%, but can vary significantly depending on profitability.
- Stock-based compensation expense of approximately $24 million and fully diluted share count of approximately 260 million.
Full Year 2018 Guidance
- We reiterate our full-year 2018 revenue guidance of approximately $1.5 billion.
- We expect the average selling price of our devices to rise, offset by a decline in device sales. We expect tracker device sales to decline and smartwatch device sales to increase.
- We are on-track to deliver or come in under our full year operating expense target of $740 million.
- Capital expenditures as a percentage of revenue of approximately 4%.
- Excluding the impact of the tax refund payment, we reiterate our free cash flow guidance of approximately ($20) million for 2018. Including the refund payment, free cash flow will be approximately $52 million.
- We expect non-GAAP effective tax rate to be approximately 25%, but may vary depending on geographic mix of revenue, tax credits, and shift to profitability.
- Stock-based compensation expense of approximately $98 million and basic/diluted share count of approximately 248/260 million.
For additional information regarding the non-GAAP financial measures presented above, see “Non-GAAP Financial Measures” below.
Last Updated on 20 January 2026 by the5krunner
My favourite kit and nutrition
- Injinji – Runners protect your toes. Avoid discomfort and minor injury. Run more. Run faster. I use them.
- Garmin 90-degree charging adapter — The small adapter that keeps your charging cables tidy. Essential for race day. I use one.
- Garmin charging puck — the fastest and most reliable way to top up your Garmin before a session. I use one.
- Ravemen FR300 — Front light that mounts directly under your Garmin or Wahoo head unit. Keeps your bars clean and your beam pointed where it matters. I use one.
- Body Glide – The blue anti-chafe stick that all swimmers and many runners use. I use it.
- Maurten — The race nutrition trusted by elite athletes. Gels and drink mixes engineered to be easy on the stomach. I use them.
- Garmin Varia RTL515 — A radar rear light that alerts you to vehicles approaching from behind. Pairs with your Edge or Garmin watch. I use this model.
- Favero Assioma Pro RS2 — The power-meter pedals most serious cyclists choose. Accurate, easy to move between bikes. I use this model.
- Garmin Forerunner 970 — A serious choice for a pro-grade triathlon watch. I use this.
- Polar H10 — My daily driver for accurate, waking HRV readings.
- Wahoo ELEMNT Roam 3 — The bike computer that has the feature Garmin lacks: usability. I use mine on most rides.
Reader-Powered Content

This content is not sponsored. It’s mostly me behind the labour of love, which is this site, and I appreciate everyone who supports it.
Support the site: Follow (free, fewer ads) · Subscribe (paid, ad-free) · Buy Me A Coffee ❤️
All articles are written by real people, fact-checked, and verified for originality. See the Editorial Policy. FTC: Affiliate Disclosure — some links pay commission. As an Amazon Associate, I earn from qualifying purchases.

tfk is the founder and author of the5krunner, an independent endurance sports technology publication. With 20 years of hands-on testing of GPS watches and wearables, and competing in triathlons at an international age-group level, tfk provides in-depth expert analysis of fitness technology for serious athletes and endurance sport competitors. ID
