Ride with GPS | Heatmap | Inbound
Ride with GPS (RwGPS) have just announced some much-longed-for features for their sizeable base of users, we’re talking HEATMAPs.
Some of you might remember that RwGPS introduced popularity routing a couple of months back. The impending announcement is that you will now be able to display the heatmap that was previously used to create & calculate your routes that followed popular roads.
Yeah but Strava does heatmaps, right? Garmin does popularity routing, right?
True. As of today, the great thing with the new RwGPS features is that you will be able to see the live HEAT info on the app as you PLAN and AS YOU RIDE. ie you will get LIVE heat.
RwGPS Heatmaps
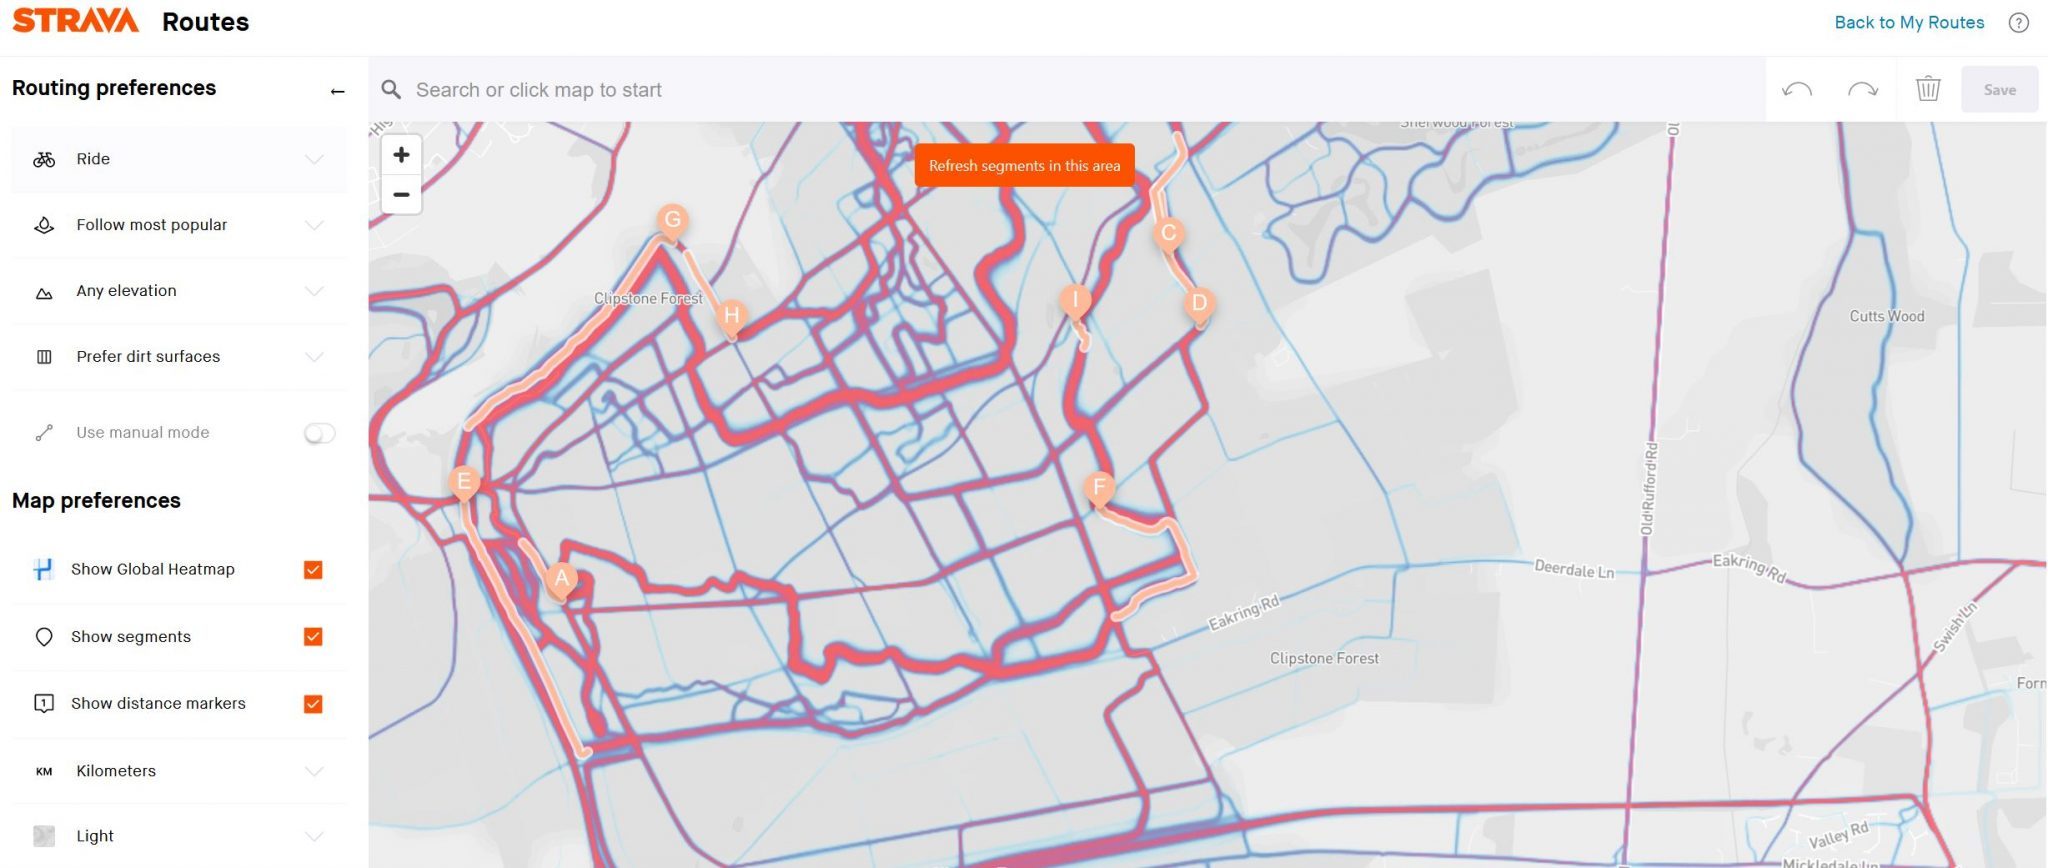
If you plan a route on the web you will see something similar to this image where the HEATMAP layer is displayed along with the other selected layers BASIC MAP, BIKE PATHS, TERRAIN & HEATMAP. By means of an explanation, the route I’m planning is shown with a striking red colour, whereas the other, more subtle, red and blue lines represent the heat/relative usage of the surrounding roads.
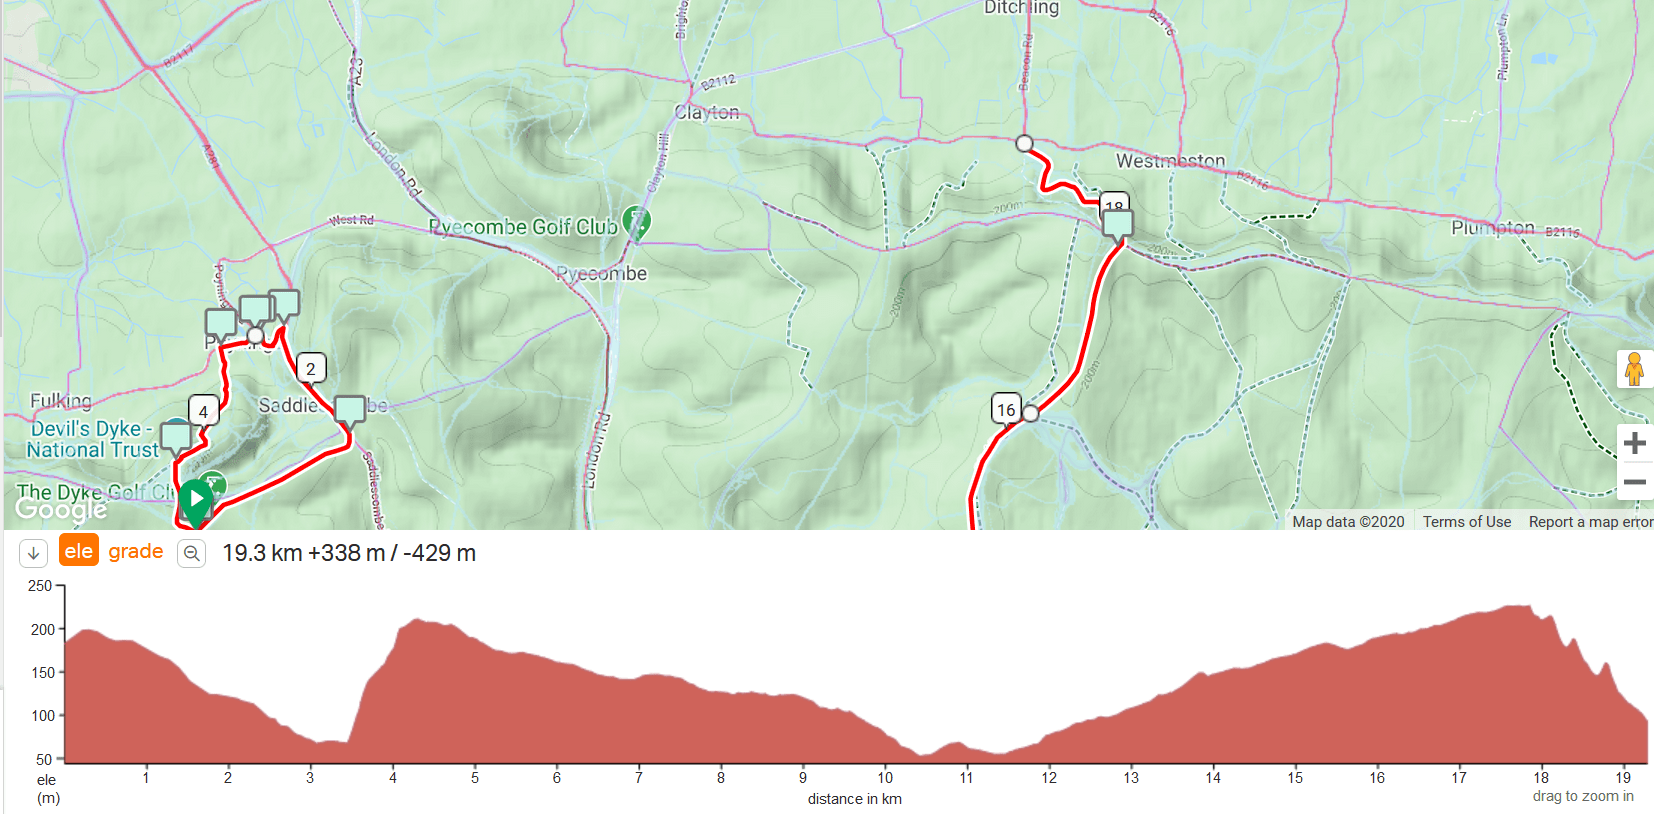
Perhaps compare that with a STRAVA heatmap (paid-for, Subscriber feature) which I think you might agree looks prettier and the heat is more obvious, although you could argue that the STRAVA route shown here gets somewhat lost. Indeed RwGPS claim that a notable chunk of their users plan routes in RwGPS and cross-reference the STRAVA heatmap as they plan.
RwGPS would perhaps respond further to say that they are adding LIVE HEATMAP functionality to do a job of aiding navigation. If you are riding along, using their app, then chances are you would normally be paying little attention to the HEAT and perhaps only want to consider it occasionally when re-routing away from your original plan. So the heat would be of secondary importance to you. Contrast that thought again with the STRAVA map, above, then I hope you’d agree that the STRAVA heatmap is somewhat distracting and would perhaps not be that helpful as you progress on your ride.
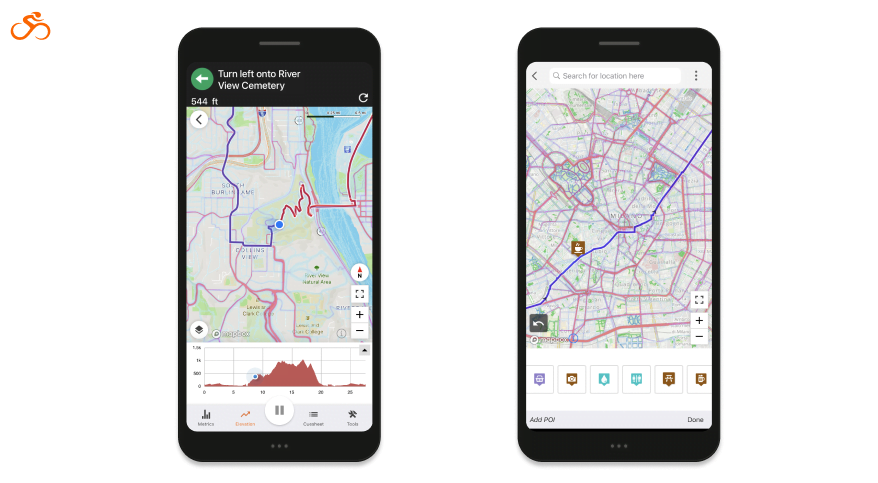
Here are a couple of screenshots from the mobile app which much more clearly show the look-and-feel of the in-ride experience.
So I conceded that point to RwGPS 😉
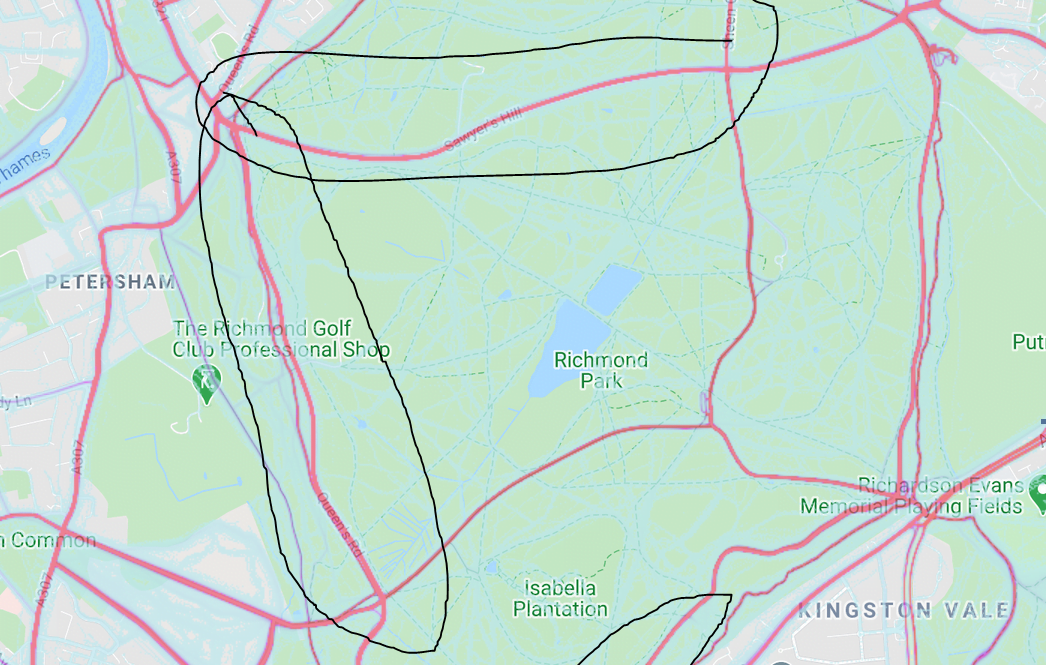
I had another go and pointed out to RwGPS that the following image oof their heatmap shows my circled highlights of two of THE MOST popular STRAVA segments in the WORLD and yet the RwGPS heatmap doesn’t have them as super-hot. Why So? The response was that the nature of the user base likely helps determine the kind of heat produced. So STRAVA cyclists in Richmond Park on these routes will comprise those commuting AND those training by doing laps or hill reps, whereas the RwGPS user base is perhaps instead more focussed around those who have planned routes rather than just cycling a lot over known segments.
I conceded that one too 😉
The great thing with a heatmap is that superficially at least, it conveys its meaning very intuitively. It conveys simplicity. Naturally, the reality is that heatmaps are complex beasts when you look under the surface and so I put together some interesting heatmap facts.
- The colour of the HEAT doesn’t necessarily reflect the VOLUME of usage in RwGPS. Instead, the heat is calculated relative to usage in the surrounding area, thus a rural road ridden 10 times a day might well have the heat turned up quite a lot if no-one rides any of the roads nearby. Conversely, some city roads have the heat turned down to avoid a map which has the whole city on fire. In a way, therefore, I guess RwGPS displays what could be called USEFUL HEATMAP or RELATIVE HEATMAP.
- The RwGPS heatmap has 18 levels of zoom
- The heatmap comes from actual rides recorded by the RwGPS app plus those uploaded from 3rd parties like Garmin/Wahoo and, despite excluding private trips and private users, the data set still contained 11 million rides over the last 2 years. Longer timeframes than 2 years would start to deviate from the true nature of the roads you are likely to experience and so were excluded.
- Moving forwards the heatmap will be updated weekly.
- The raw heat data covers all sports, I’m guessing most usefully it’s for MTB and road riding
Cost
Sadly some things in our sports and activities are not always free. However, SOME of this is free.
- The heatmap overlay in the recording screen is free for ALL users. ie if you are recording a ride on the app you can display the heatmap for free to guide your ad-hoc journey (I’d use that feature)
- The heatmap overlay will be available in the mobile route planner for paid Basic ($6/mo) and Premium members ($10/mo).
Take Out
The live (free) heatmaps are a sweet new feature that I’ll probably use at some point and I don’t know of any free alternative.
However, my initial concern was with the colouration of the HEAT. It didn’t seem sufficiently coloured for me. Perhaps I want something prettier? That said, I take on board that RwGPS are making this a functional tool rather than focussing on displaying something pretty.
I made some cursory checks on the HEAT on many of my local rides and Surrey rides and the data looked sensible. So I was pleasantly surprised that someone other than Garmin, Google, Apple or STRAVA was able to meaningfully come up with popularity routing/heatmap data. Did I say the live heatmaps were free? 😉 Enjoy
Last Updated on 24 January 2026 by the5krunner
My favourite kit and nutrition
- Injinji – Runners protect your toes. Avoid discomfort and minor injury. Run more. Run faster. I use them.
- Garmin 90-degree charging adapter — The small adapter that keeps your charging cables tidy. Essential for race day. I use one.
- Garmin charging puck — the fastest and most reliable way to top up your Garmin before a session. I use one.
- Ravemen FR300 — Front light that mounts directly under your Garmin or Wahoo head unit. Keeps your bars clean and your beam pointed where it matters. I use one.
- Body Glide – The blue anti-chafe stick that all swimmers and many runners use. I use it.
- Maurten — The race nutrition trusted by elite athletes. Gels and drink mixes engineered to be easy on the stomach. I use them.
- Garmin Varia RTL515 — A radar rear light that alerts you to vehicles approaching from behind. Pairs with your Edge or Garmin watch. I use this model.
- Favero Assioma Pro RS2 — The power-meter pedals most serious cyclists choose. Accurate, easy to move between bikes. I use this model.
- Garmin Forerunner 970 — A serious choice for a pro-grade triathlon watch. I use this.
- Polar H10 — My daily driver for accurate, waking HRV readings.
- Wahoo ELEMNT Roam 3 — The bike computer that has the feature Garmin lacks: usability. I use mine on most rides.
Reader-Powered Content

This content is not sponsored. It’s mostly me behind the labour of love, which is this site, and I appreciate everyone who supports it.
Support the site: Follow (free, fewer ads) · Subscribe (paid, ad-free) · Buy Me A Coffee ❤️
All articles are written by real people, fact-checked, and verified for originality. See the Editorial Policy. FTC: Affiliate Disclosure — some links pay commission. As an Amazon Associate, I earn from qualifying purchases.

tfk is the founder and author of the5krunner, an independent endurance sports technology publication. With 20 years of hands-on testing of GPS watches and wearables, and competing in triathlons at an international age-group level, tfk provides in-depth expert analysis of fitness technology for serious athletes and endurance sport competitors. ID

Is it just me or does ‘Ride with GPS’ sound more like a slogan instead of name.
good branding would say that you shoud have a name, maybe something like that, but that you should never use an acronymical version of it as well – RwGPS – as that then dilutes the brand. eg what would you shorted Apple to? (ie it’s a good brand name)
yours
tfk
😉