Using apps and platforms to give you nuggets of motivation for your training
This article is looking at several unusual ways of getting motivational feedback from apps and sports platforms based on your numbers. I’m NOT talking about things like simply hitting your distance target or time targets, it’s more things that are like quantifiable mini-PBs (PRs).
These are all apps that I use in some form or other, although when I say that I ‘use them’, I mean that I might just simply delve into a specific app to get one bit of feedback on my performances. Please feel free to share any you use in the comments below.
Basic Motivation
When you follow a plan then simply completing each daily workout might be enough for you. A good plan will progressively stretch you and before you know it you will have almost miraculously & significantly improved. Although, you are trusting that your coach/plan is making you better, perhaps without getting regular PBs/PRs simply because you might be so tired all the time from lots of training.
So if you were following a Fink plan for IM Bolton this year, then your training at week 1 and at week 27 would look something like the two weeks in these images, yet your weekly progression adds no more than 30 minutes each time and it might take you until week 12 or week 20 to really start to feel tired.
Week 27 is clearly a hard week of training for most of us but how do you motivate yourself along the journey towards it?
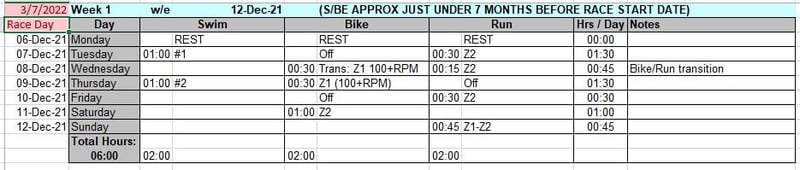
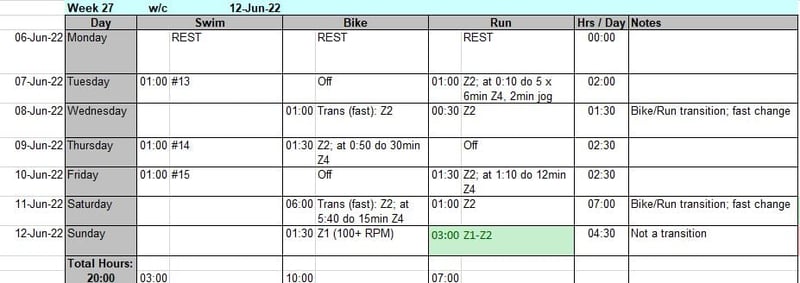
Maybe you look to get a parkrun 5K PB? Trust me, once you’ve got 15, or so, PBs on one course it starts to get really hard to get some more. You might start to wait months or years for another to come around.
Only then might you start to look at year’s-bests or season’s-bests as a measure of progression and motivation. If that gets too hard to achieve then there are always age-graded performances to rely on which, in the case of parkrun, are measures of meaningful progression that take into account your ageing limbs!

Strava Segments
Back in the day, I often got a PR on a favourably windy day, somewhere on my route several times a week. I’m sure it’s the same for you.
I’ve now got to the point where I’ve even done my more obscure rides and runs LOTS of times and I can quite easily go a whole week without Strava even telling me I’ve got my 3rd best performance on some random segment that I never previously had any interest in.
Alternatively, I can see if I beat my mates on my favourite Strava segments which, invariably, are not their favourite segments. So neither of us really care about who is the ‘best’. Maybe you simply check that you are doing more miles or minutes than your buddies? Fine, but that’s fairly basic stuff. I don’t know about you, but I start to find that less interesting each year.
Wandrer on Strava
I think Strava realised that segment dilemma as well. Maybe that was why they introduced Local Legends to recognise that you did the same segment again and again and again and again, more than anyone else that month. So, hmmmm, that doesn’t motivate me.
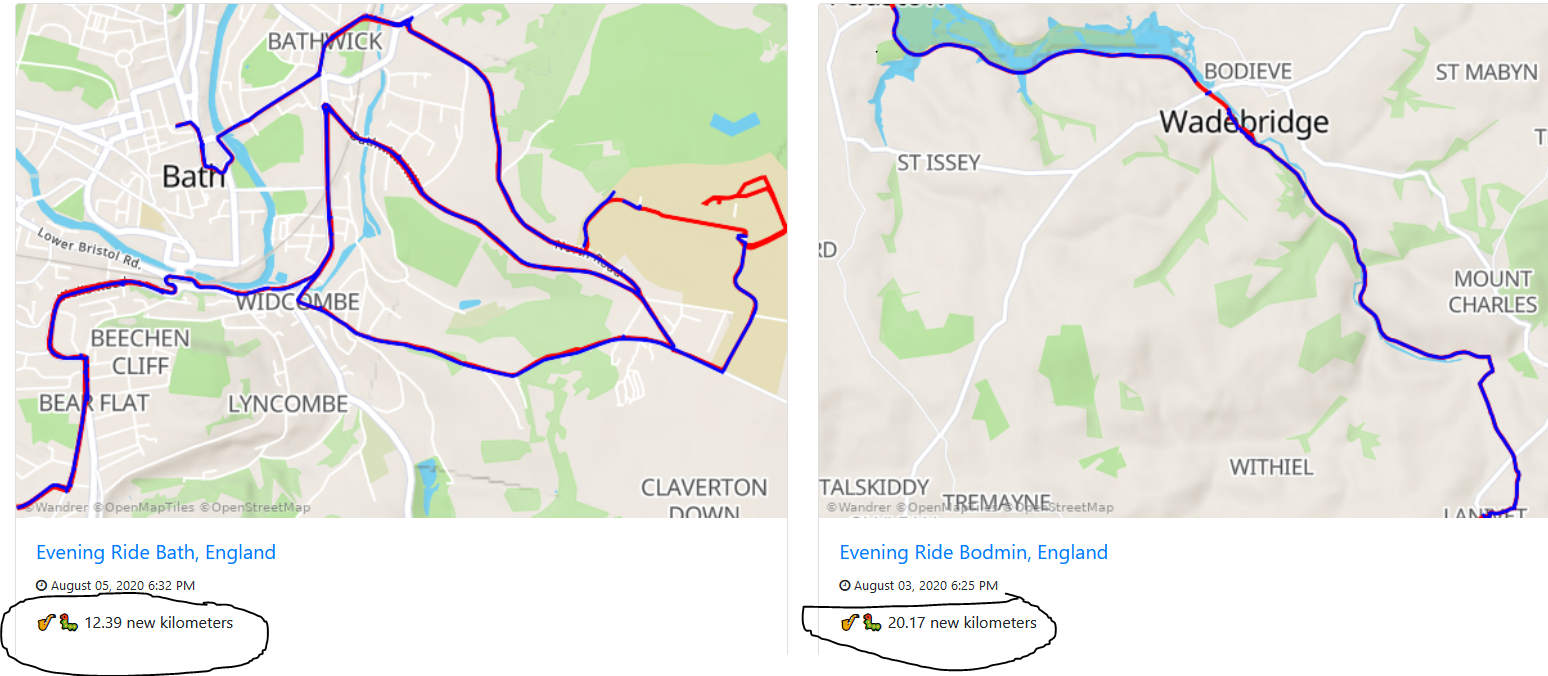
I do, however, take an occasional peek at the Local Legend antithesis that is Wandrer. Wandrer tells you what new miles/KMs you’ve done on a particular run or ride and even gives you stats like ‘You’ve now completed 23% of Surrey’. Whilst I really have no interest in bagging off every road in Surrey I do confess to taking an odd detour here and there just to get a ‘new road in’.
Me? I’ve racked up an unimpressive total of 135km of new roads this entire year and certainly don’t qualify for the Wandrer leaderboard. I keep plugging away though and WANDRER tells me how many new KMs I do on each ride, like this:
It’s a free site: wandrer.earth
Strive.Ai
Strive.ai is another site linked to your Strava stats and, from memory, the free stuff is still pretty good. I think I first used it in about 2017 and it sends me an email whenever I have a breakthrough session. That breakthrough can be power levels, sustained pace or sustained heart rate.
Sometimes that email from Strive alerts me to the fact that I had a much better session than I thought and then I might set aside a few minutes more than usual to figure out why. Usually, it’s because I was using an optical HR and the readings are wrong 😉 however, Strive.ai IS a proper AI tool with real AI that endeavours to get rid of the junk that sometimes besets our data.
If that sounds interesting: strive.ai
Proper Breakthroughs
The simple difference between some form of PB/PR and a breakthrough is that the breakthrough is based on recent performances and your recent physiology. Strive.ai from the previous section DOES look at physiological breakthroughs as does my other favourite, Xert.
This is a really good chart from Xert and I look at it regularly after many rides. It just shows and ranks several aspects of my cycling:
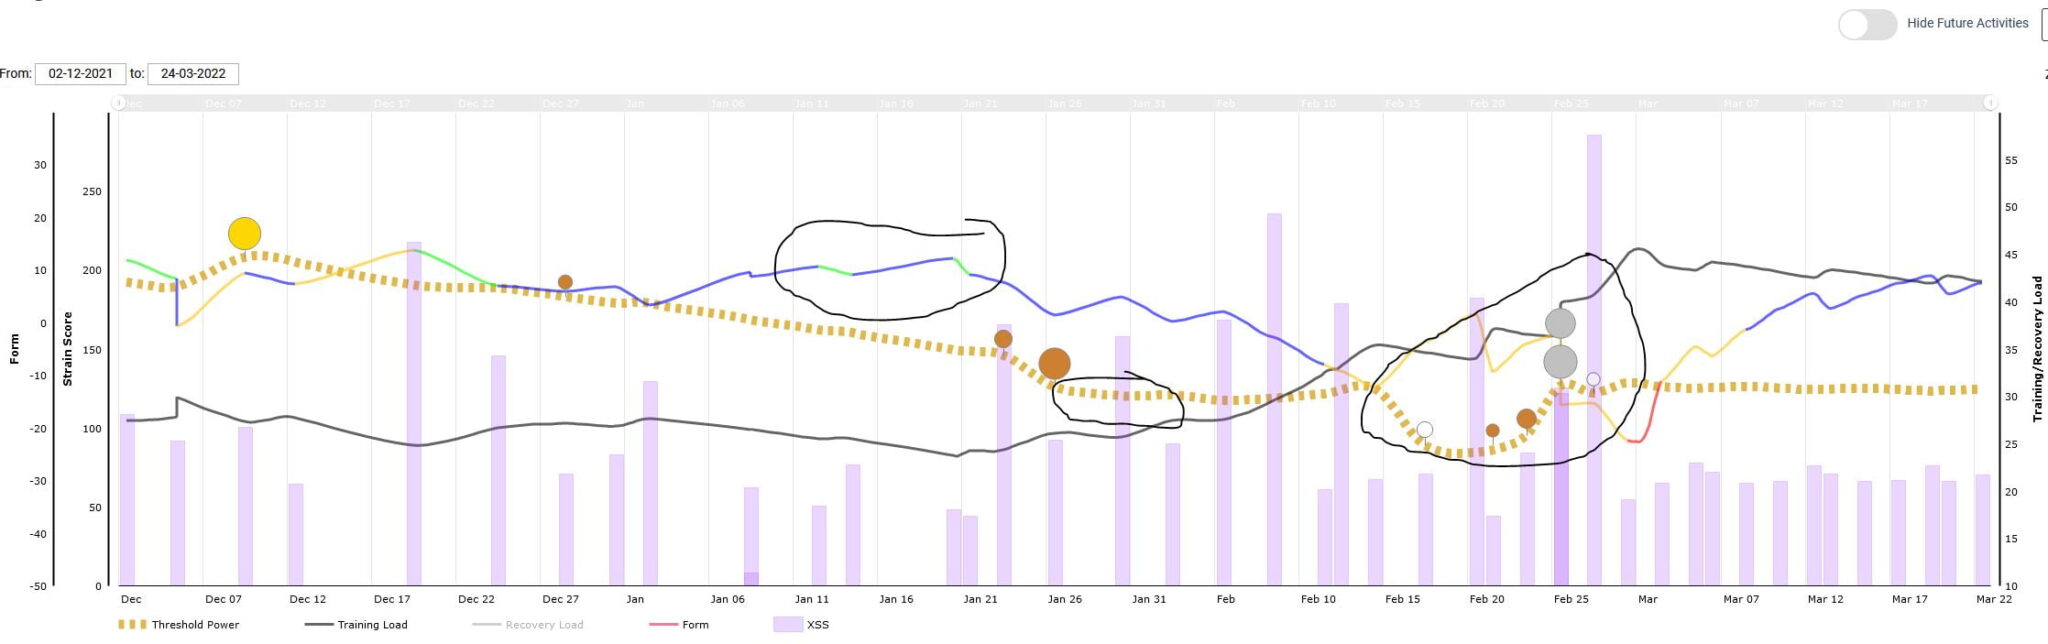
- Pink bars represent the load from my ever-declining rides this year
- The Dotted gold line represents my FTP…yes! I know, it’s going the wrong way. Xert is great in that it continually models my FTP/CP and all power abilities/fitness signatures.
- The black line represents the cumulative effect of your training load
- Then there is the multi-coloured line which changes colour depending on how good your form should be. It’s GREAT when this turns green on race day as you know you should be on for a good performance.
- Finally, there are the multi-coloured circles which represent breakthroughs at various performance levels.

If I were only a cyclist I would probably use Xert as my main platform, it’s that good. However, it’s less good for triathletes as the run modelling doesn’t quite correctly impact the cycling.
More: Xert.com
Another Kind of PB/PR – Golden Cheetah CP Curve
If you understand that you have a maximum average power potential for any given duration then you probably can get your head around a CP curve. This represents either your best average power achievements at EVERY duration or your MODELLED best average power at every duration. If your ride today exceeds either your actual best power-duration or modelled best power-duration then there is a PB/PR or breakthrough of some sort there waiting to be recognised.
For the sake of argument, whilst FTP only looks at your best power for 60 minutes, why not have a best for 10 minutes or 40 minutes or 6 minutes or why not for 3421 seconds? What’s so special about an hour?
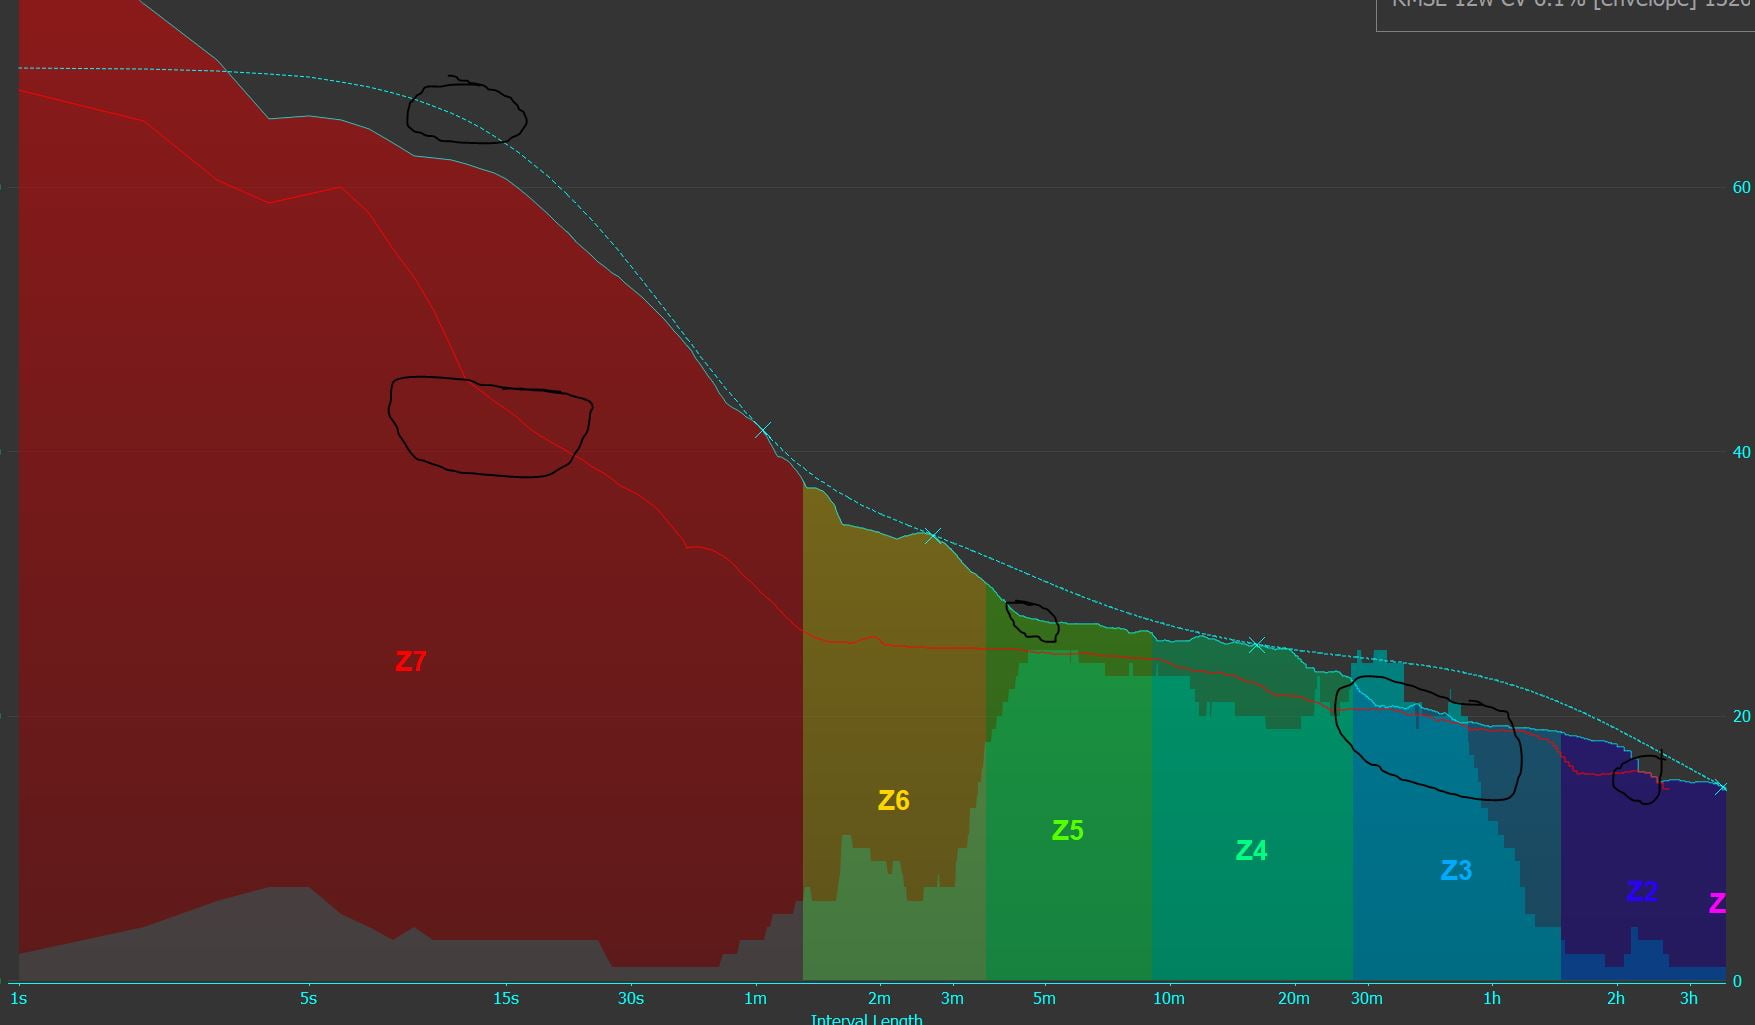
- The red line is the CP curve for today’s ride, note the logarithmic X-axis
- The dotted line is my modelled CP curve for every duration
- The solid blue curve is my actual best CP curve for all of the last 21 days
- The large circled area to the right thus represents a near Power-PB at 40 minutes and 60 minutes
So, I really do look at this chart quite a lot hoping that the red line has broken through the blue or dotted blue lines. That would represent a 21-day PB/PR which does have some physiological merit as a breakthrough session.
Nutrition Breakthroughs
More: Detailed Supersapiens Review
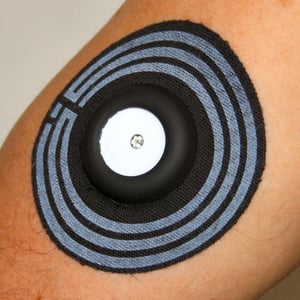
I’ve been using Supersapiens quite a lot over the last few months. I find their iOS app is great but the integration with Garmin and their own band, less so. Consequently, I tend to only look at my Supersapiens data after a ride to see how my fuelling performance was through the workout.
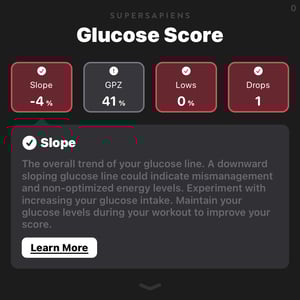
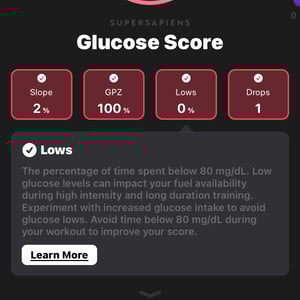
The first chart is an OK fuelling performance as I managed to maintain my sugar levels in the ‘performance zone’ for half the time. The second chart shows a much better performance where I fuelled more and consequently performed better as I was in the zone for the entire ride.
I’m always nervous about unnecessarily, over-fuelling and gaining weight, so I find these bits of data useful in that they reassure me that I am making a training improvement because of the fuelling.

Lumen
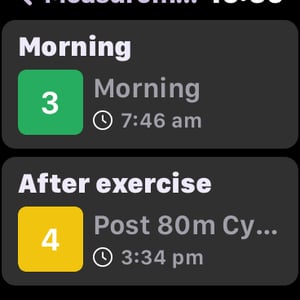
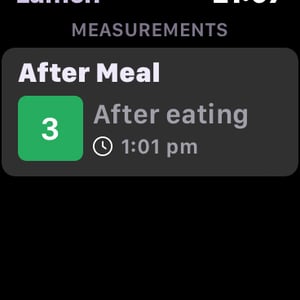
I’m about to start using Lumen again as I contemplate ramping up my training. Lumen has excellent Garmin and Apple Watch integrations. Essentially you can use Lumen to keep track of your body’s fat/carb-burning state whilst rested.
Lumen has two scores:
- A mark out of 5. 1/5 means you are burning fat, which is good.
- A Flex score out of 21 – where 21/21 means you are really good at switching between fat and carbs as your fuel source.
Lumen definitely motivated me to be more mindful about what I eat and when I eat it as well as to see relatively quick adaptations over a few weeks to increases in endurance training volumes.
More: Lumen
rMSSD / HRV
HRV & Readiness-to-Train
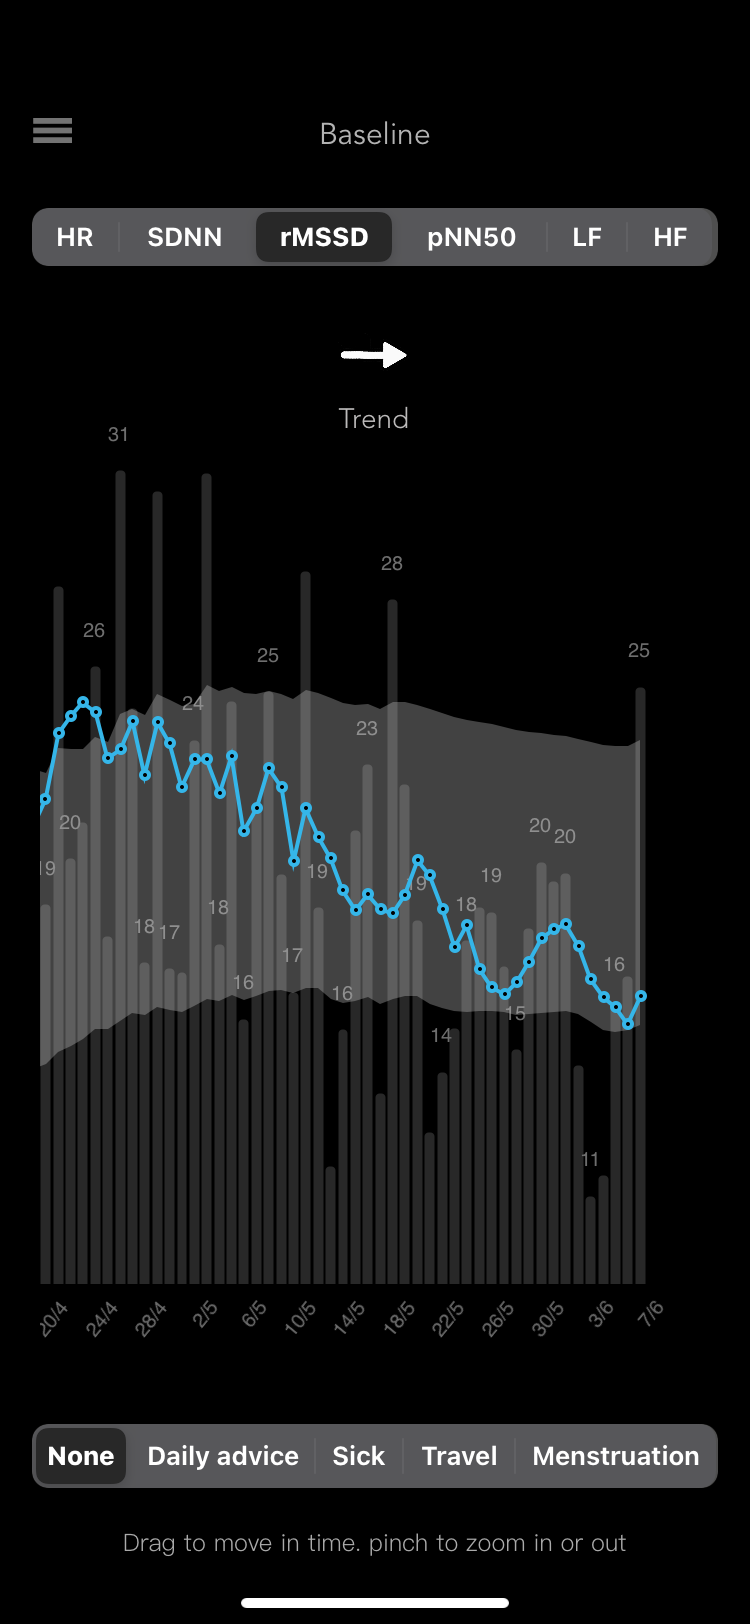
Every morning I wake up to some very nice numbers from HRV4Training, WHOOP, Oura, Training Today/Athlytic, Eight Sleep and sometimes Garmin’s Body Battery. To varying degrees, these all take my heart rate variability and give me their thoughts on my readiness to train. In each case, it’s the same heart they are working from and so you would think that they would all agree…but they don’t.
Strangely this tells me that I should NOT listen to my body. Or, more precisely, that perhaps I should listen better 😉
I also look at Training Stress Balance (TSB) which models my readiness based on my recent training. Here’s an old image of my CTL/ATL/TSB and this is quite a good write-up explaining it all.
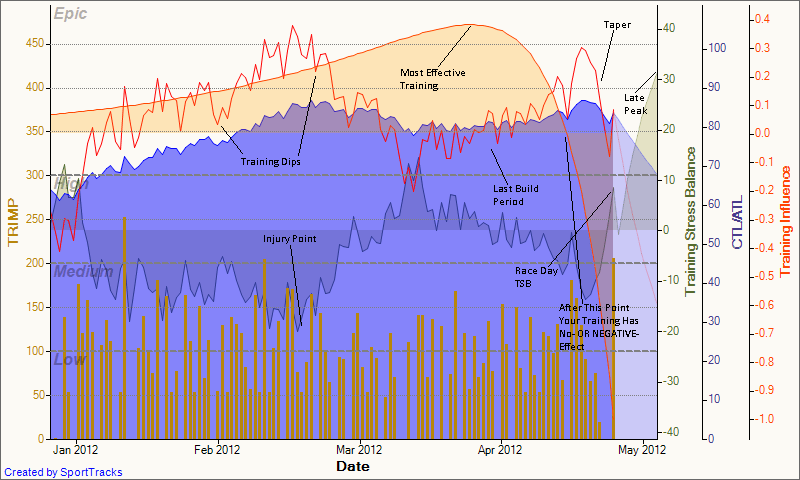
So I have modelled readiness (TSB), measured readiness (HRV) and RPE-based readiness (feel). Strangely, having all this data enables me to find one piece of info to suit supporting my decision of what I want to do today!! Normally it is ‘to train’ but perhaps more often it should be ‘to rest’.
Even though these numbers don’t tally I still sagely look at them each morning to see I’m ‘ready to go’ and then limp downstairs in search of a coffee or two to get my brain working.
I guess I could perversely argue that these numbers motivate me to do something when perhaps I sometimes shouldn’t.
Maybe I just look at WAY too many numbers.
Q: What’s your favourite motivational data?
Further reading: WHOOP 4.0 now takes Apple, Garmin, Polar, Wahoo .workouts…
This article is part of the site’s sports science reference for endurance athletes.
Last Updated on 3 June 2026 by tfk the5krunner
Small things I always use
- Garmin 90-degree charging adapter: Charges your Garmin from any USB-C cable. Essential when travelling. I use one.
- Body Glide: The blue anti-chafe stick swimmers and runners carry. I use it.
- Speedo earplugs: Fewer ear infections and no cold-water dizziness. I use them.
- Dryrobe Advance: My winter changing robe for open-water swims. I use one. A cheaper option is the AONYIYI changing robe.
- Maurten: Race fuel that stays easy on the stomach. I use them.
- Garmin charging puck: The quickest way to top up before a session. I use one.
- Injinji: Toe socks that stop rubbing, so you run more. I use them.
- Ultimate toe protectors: Stop black toenails on long runs. They work. I use them.
- Compressport R2 v2 calf sleeves: My calf sleeves of choice. I use them.
- Cellucor C4: My pre-workout before hard sessions.
- TPU tubes: Schwalbe Aerothan, Tubolito and Pirelli SmarTube. Light, tiny spares. I use all three.
- G8 insoles: Adjustable insoles that are good. I use them.
- Cycplus Cube: A 97g electric pump that gets a road tyre rideable in two minutes. I carry one. 5% off with code THE5KRUNNER.
Watches and sensors
- Polar H10: My daily driver for waking HRV.
- Polar Verity Sense: My backup arm-worn HR sensor.
- Nomad bedside charger: Charges my iPhone and Apple Watch overnight. I use it, and many of their bands.
- Train.Red: The best muscle oxygen sensor I’ve used.
- Tymewear: Accurate heart rate and reliable ventilatory zones. I use it to pace endurance rides over an hour.
- Garmin Forerunner 970: A pro-grade triathlon watch. I use this.
- Apple Watch Ultra 4: My daily smartwatch. No phone needed on rides.
- Garmin Fenix 9 Pro: I’ve just bought one.
On the bike
- Continental GP5000 for everyday riding, and Aero 111 on the front for special occasions.
- Helmets: Specialized S-Works Evade 3 for road riding, and Rudy Project Wing for TT-style races. I use both.
- Ravemen FR300: A front light that mounts under your Garmin or Wahoo. I use one.
- Wahoo TRACKR Radar: I use it on one bike and Varia on the other. They perform the same.
- Garmin Varia RTL515: Radar that warns you of cars from behind. I use this model.
- Wahoo ELEMNT Roam 3: The bike computer that’s easy to use. I use mine on most rides.
- Favero Assioma Pro RS2: Accurate power pedals that swap easily between bikes. I use this model.
Home and indoor training
- NPE Runn: Makes my basic treadmill smart, sending more accurate speed and distance to my watch and Zwift. I use it.
- Google Wifi: Keeps Zwift connected in my pain cave. I use it.
- Apple TV 4K: Zwift on the big screen. I use two.
- Google Nest Doorbell (wired, 2nd gen): My video doorbell, running in both Google Home and Apple Home. I use it.
Health, recovery and sleep
- FreeStyle Libre 3 Plus: Shows how my blood sugar responds to diet.
- hDrop: Measures my sweat loss in summer and indoors.
- Fourth Frontier Zone: Checks my heart under load in hard sessions.
- Oura Ring 5: My partner’s recovery tracker of choice.
- Kineon MOVE+: Red light therapy for niggles. It works.
- Eight Sleep: A cooling mattress cover my partner and I use nightly.
Reader-Powered Content

This content is not sponsored. It’s mostly me behind the labour of love, which is this site, and I appreciate everyone who supports it.
Support the site: Follow (free, fewer ads) · Subscribe (paid, ad-free) · Buy Me A Coffee ❤️
Written by real people, with AI assistance. Fact-checked and verified for originality. See the Editorial Policy. FTC: Affiliate Disclosure — some links pay commission. As an Amazon Associate, I earn from qualifying purchases.

tfk is the founder and author of the5krunner, an independent endurance sports technology publication. With 20 years of hands-on testing of GPS watches and wearables, and competing in triathlons at an international age-group level, tfk provides in-depth expert analysis of fitness technology for serious athletes and endurance sport competitors. ID

I’ve been into collecting (actionable) data over the years, but looking back, the thing which motivates me most is to prepare my own training plan and follow it. Executing as planned brings me the biggest motivation. I should also add that I’m flexible with the planning. I have a rough skeleton what I want to do in the next 3 months, but I plan in a detail only for upcoming 1-2 weeks.
Motivation is hard to come by when all we tend to remember are the paces we ran “back then” but the comparison now-to-then rarely holds up. I’m surprised Strava doesn’t have some type of Age Grading element included (I know subscribers can see Age Groups – but not the same thing). I’m only ever interested in competing with myself on training PRs so this seems like a gap that somebody could address.
yep, i 100% agree with that.
Thanks for a glimpse into some offerings I wasn’t aware of. I’ve had a TO DO item to explore GoldenCheetah a while now. Somewhat hesitant to add more tech as the amount of time spent troubleshooting is already high enough.
As far as motivation goes I am another that keeps things going to meet or exceed goals throughout the entire year. In years gone by it was just mileage targets, then average speed crept in, now 3s average power in the prime months with TSS fencing things in.
golden cheetah is very complex…a rabbit hole
just start with loading a few months of ride and run data.
then just look at the cp chart which is a page by itself that effectively just analyses one ride/run