 Train.Red Muscle Oxygen Sensor
More: detailed Train Red Review – FYER & Plus
Intended Audience: Endurance Athlete
Athletes are aware that energy is released when glucose is burned in their muscles using oxygen. An adequate supply of both glucose and oxygen is required for optimal performance, among many other factors.
Sports metrics such as heart rate, cadence, speed, and power have been accurately monitored for many years. However, recent advances in sensor technology have allowed us to delve deeper into our bodies and understand what is happening in real-time. These advancements have enabled consumers to access new technologies without the need for expensive sports lab sessions. Perhaps this is why Supersapiens has had a successful start to its business over the past few years with its focus on glucose.
Muscle oxygen sensor products have been available for some time, and it is puzzling to me that athletes have not utilized them more. The MOXY monitor has been in the market for over 5 years and is the incumbent. Its focus is primarily on sports laboratories and highly motivated athletes who want to understand their performance better. While MOXY has a reputation for accuracy, it is not an easy product to wear repeatedly unless you buy its lycra shorts complete with MOXY-pouch.
First BSX Insight and later Humon HEX tried to focus more on the consumer side of the market with easy-to-wear products. Both floundered. The baton has passed to TRAIN.RED, Graspor, Repace, NNOXX, and Q-Lac, to compete with MOXY in labs and get more of us to better understand and monitor a key performance metric.
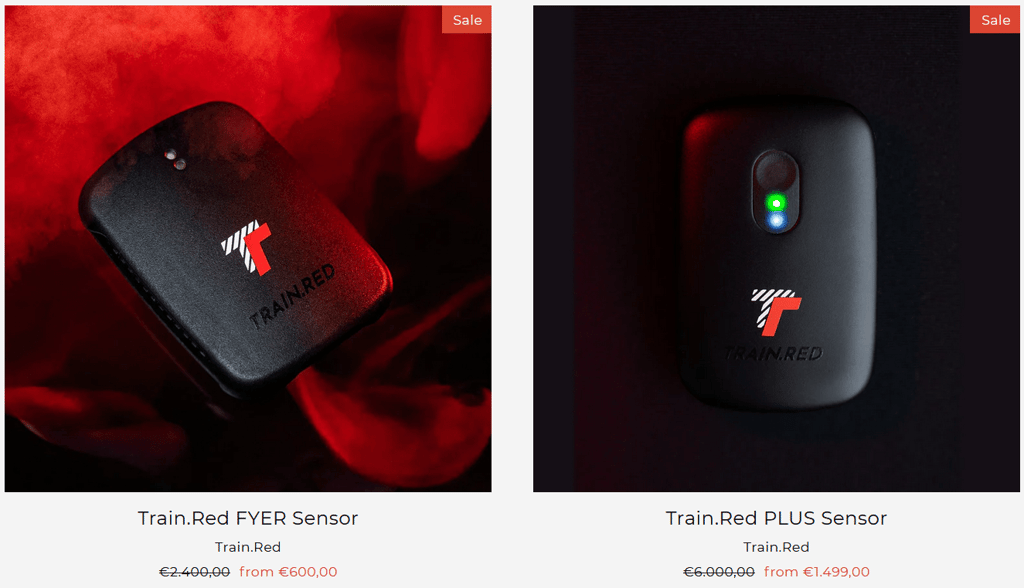
Train.Red has two products
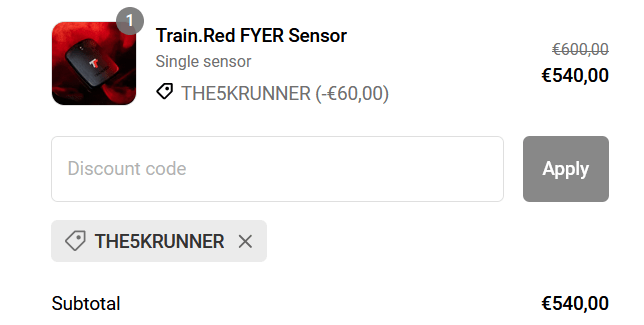
- Train.Red FYER – from €600 in the current sale
- Train.Red PLUS – from €1500 in the current sale
What’s the Problem?
Problems tend to be solutions waiting to happen. The most positive view would be that Muscle Oxygen could become a major (and good) training metric for the masses. It’s a ‘proper’ training metric that is monitoring something that frequently will make a difference.
I feel that the key factors hindering wider takeup of muscle oxygen are these
- SMO2 is not an intuitive metric. It is similar in behaviour to Blood Glucose in that the athlete needs to understand that supply and demand are key factors determining current levels and real-time trends. Thus any SmO2 reading could be in two or more ‘zones’ or states…one where it is rising, steady, or another where it is falling.
- Education – Educational resources do exist on vendor websites but there is not a wider understanding beyond that on training forums or in the sports media.
- Accuracy & Responsiveness – Many technical factors affect potential accuracy, newer generations of sensors have the chance of greater accuracy
- Tech Integration – >95% of endurance athletes looking to add Muscle Oxygen to their training will already use Garmin, Wahoo or Apple sports devices. Whilst niche apps might be useful for niche data analyses, any sports data with real-time implications MUST integrate with the athletes’ existing tech. I never cease to be amazed at new start-ups that naively expect athletes to switch from, say, Garmin Connect to the new company’s app. Muscle Oxygen has a distinct advantage here in that FIT/ANT+ standards already include Muscle Oxygen metrics in standards supported by Wahoo, Garmin and others. Blood glucose, hydration, lactate, and core body temperature would be examples of metrics that are NOT included in the standards.
- Wearability – MOXY is a bit bulky but Hex & Train.Red aren’t. Furthermore, the SMO2 sensors seem to generally support multi-sensor, simultaneous usage. So maybe wearability is not the real problem
- Cost – Nope. While SMO2 sensors might seem expensive, the products tend to be not unreasonably priced considering their niche attractiveness. Companies have to make money to survive. Humon had a subscription to access their good site/app but the sensor could still be used without that subscription.
On balance, I feel that it’s the first few points above that are the problems.
Is the lack of general understanding a problem that can ever be solved with education? Is muscle oxygen always doomed to never be an accepted mainstream sports metric? a: Maybe!
What Is Train.Red?
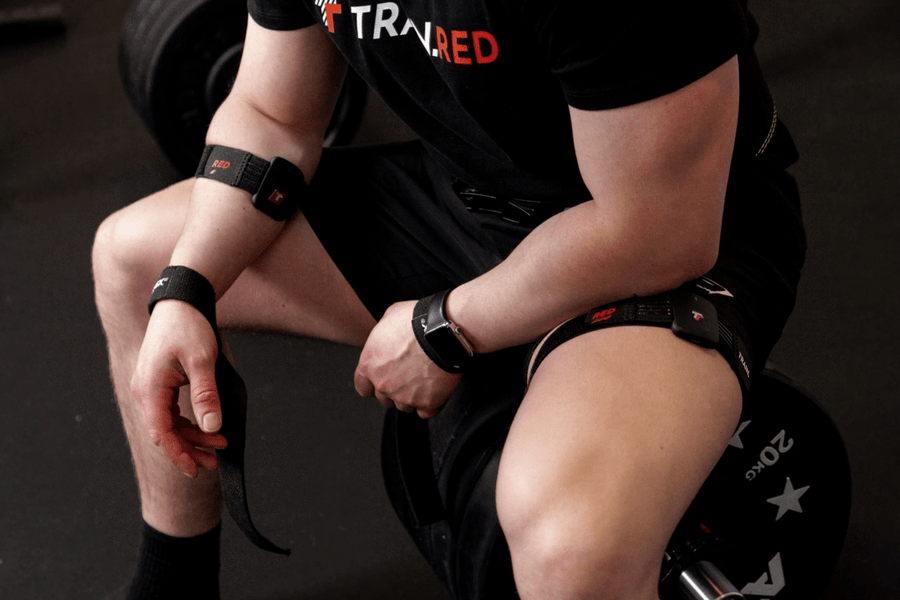
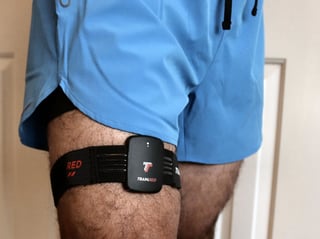
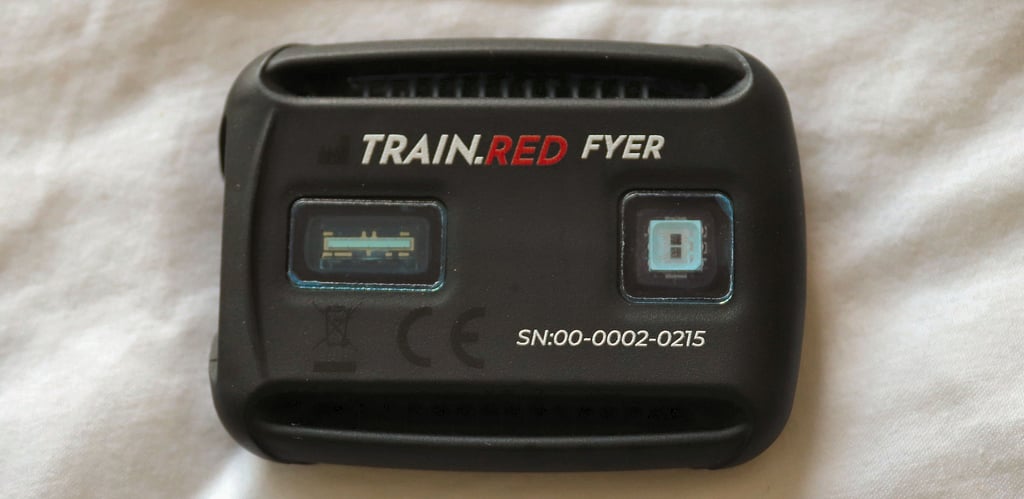
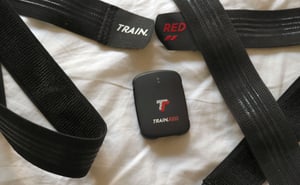
The Train.red muscle oxygen sensor uses near-infrared spectroscopy (NIRS) technology to measure an athlete’s muscle oxygen saturation levels. It can be attached to the athlete’s body using one of 3 lengths of velcro strap. Alternatively, sticky patches can be used. The patches are specifically designed to boost accuracy by keeping external light away from the Train.Red sensors, however using one of the straps and wearing under lycra shorts also does a good enough job.
OK, it’s a NIRS sensor. “So what?”, you might say. So’s MOXY.
Train.Red is linked to Artinis Medical Systems which makes the PortaMon SMO2 sensor and is endeavouring to produce highly accurate muscle oxygen readings. They accept that scientific literature shows that MOXY and PortaMon are accurate and reliable. PortaMon has been the subject of more scientific studies.
- Ferrari et al. (2012) compared the PortaMon to an invasive technique for measuring muscle oxygenation in a group of elite cross-country skiers. They found that the PortaMon was highly correlated with the invasive technique and was a valid and reliable tool for monitoring muscle oxygenation during exercise.
- Wehbe et al. (2015) compared the PortaMon to another commercially available muscle oxygen sensor and found that both devices provided similar measurements of muscle oxygenation during cycling exercise.
- Kounalakis et al. (2019) evaluated the accuracy of the PortaMon during a range of cycling intensities and found that the device was highly accurate and reliable for measuring muscle oxygenation.
- A study by Hamaoka et al. (2011) compared the Moxy Monitor to an invasive technique for measuring muscle oxygenation and found that the Moxy Monitor was highly correlated with the invasive technique and was a reliable tool for monitoring muscle oxygenation during exercise.
- A study by Van Beekvelt et al. (2001) evaluated the reliability of the PortaMon in measuring muscle oxygenation during different levels of exercise intensity and found that the device was highly reliable and consistent in its measurements.
Whilst Train.Red’s sensor isn’t used in PortaMon it is expected to be in the next generation of that product. The implication here would be that the new PortaMon would have the same or better level of accuracy plus other improved performance characteristics.
How Do Moxy & Train.Red Differ?
These are differences but they do not necessarily imply a greater degree of accuracy
- Moxy applies an adipose tissue layer correction based on a Monte Carlo model/look-up table. This gives lower values
- Moxy shows absolute haemoglobin values (muscle oxgyen saturation), whereas Train.Red shows “relative concentration change”. The latter claims that the published literature shows that it is not technically possible to measure absolute values with NIRS and thus relative changes might be better.
- Moxy has a reporting sample frequency of 0.5, 1 or 2 Hz but samples at over 1000Hz. Train.Red has a sampling frequency of 10-25Hz and hopes to raise that to 100Hz in its impending next-gen product.
- Moxy Monitor uses four wavelengths of light: 680, 720, 760, and 800 nm. At 760 nm, the penetration depth of the light is relatively shallow, only reaching a depth of a few millimetres into the tissue. At 850 nm, the light can penetrate deeper, up to a depth of approximately 2-3 centimetres. Train.Red further claims to be able to penetrate to 3 cm due to the increased spacing of the transmitter/receiver on its sensor.
- Train.Red tends to give higher readings than Moxy (but these can be rebased and adjusted accordingly)
- Moxy would say that it directly reads SMo2 whereas Train.Red instead reads TSI (Tissue Oxygenation)
Technical problems for athlete measurement
There are issues related to both the starting point of measurement and the measurement during exercise.
The starting point can be influenced by body fat since fat contains less blood and the sensor has to send its signal through it. This issue can be adjusted by using a cuff occlusion, which involves placing a cuff around the limb to temporarily restrict blood flow, thus providing a better baseline.
During warmup, increased cardiac output and vasodilation, which lead to bigger blood vessels, increase blood volume. As a result, a fixed amount of haemoglobin is spread throughout a larger volume, and its percentage decreases.
Furthermore, during exercise, muscle contraction can squeeze blood out of the muscle, which the sensor might interpret as lower SmO2.
While a cuff occlusion cannot practically adjust for in-workout changes in blood volume, a thorough warmup can improve the overall test results to some extent. However, in non-controlled conditions, such as outdoor activities, SmO2 readings might be further impacted by: dehydration, which lowers blood volume; nitrate consumption, which leads to vasodilation and higher volume; riding position, where standing increases SmO2 readings; and compression clothing, which also affects the readings. Temperature changes and other factors might also play a role.
Some Comparisons So Far – Humon Hex & Train.Red FYER
It is difficult for me to say whether either device is accurate, but the data sets seem to follow similar trends. I have typically used the sensors on the same muscle groups but on different legs, so the data will also differ because of muscle choice . My wider experience with the Hex has shown that even a 1cm change in the position on a muscle could result in a variation in the SMO2 readings, so precise location might make a difference too. Therefore, I’m not trying to conduct any scientific experiments here.
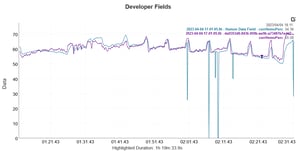
The two charts display data from the same turbo trainer indoor workout. The heart rate is denoted by green, and power by brown. The latter clearly shows a progressive warm-up followed by 5 minutes at a set level, 1-minute rest, and 5 more minutes at the same level, with those stages repeated in a ramp-like fashion. The second chart shows only the data from the Hex with Train.Red FYER, with the y-axis slightly better scaled to illustrate the downward trend in SmO2 throughout the workout’s duration. However, the data is visually complicated by dropouts from the Hex.
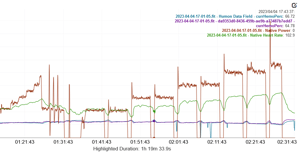
The two curves seem quite similar to each other when the data is smoothed to 10 seconds. Looking more closely during the warm-up, however, Hex readings are initially higher and then progressively lower compared to Train.Red as the efforts intensify.
Here are some takeaways:
- These charts may not be ideally scaled or presented, and I couldn’t post-process the data on Ray’s tool or change the y-axis scaling without editing the original data, which is time-consuming.
- I followed a standard British Cycling warm-up in the mini-ramp at the start, and you can see that the SmO2 peak in the recovery period after that ramp is similar to the recovered peaks in the earlier rest periods in the test. This indicates that the warm-up was adequate.
- You can see that during the easier ramps, the SmO2 levels remain stable in each work period. But when the going gets tough, I cannot sustain them, and they progressively decline toward the end. One interesting aspect to explore could be to see what happens as your heart rate eventually decouples during a long, steady-state effort. Is that from a lack of oxygen? fuel? or muscle performance ‘failure’? Do you need to run more or go to the gym 😉
- This workout wasn’t too far from a maximal effort, and 50% seems to be about the lowest that my SmO2 would go.
- My working range appears to be from 50% to 70%. From past experiences with other muscle groups on different days and in other tests, the range may be from something like 47% to 77%. Better-trained athletes will likely have higher upper ends than me.

Train.Red FYER Specs
Train.Red produces this data in the Android app. There is no iOS app and not all the data is currently broadcast to Garmin/Wahoo.
- TSI% (percentage of available oxygen in your muscles)
- Oxy and deoxyhemoglobin changes
- HbDiff (difference between oxy and deOxy haemoglobin)
- total haemoglobin
- Muscle states
Sensor details
- Size: 1.2 x 4.4x 5.9 (cm) / .5 x 1.7 x 2.3 (in)
- Weight: 20 grams
- Measure-depth: up to 20mm in your muscle
- Light source & detector distance: up to 35mm
- Sweat-proof: Yes
- Battery: up to 24 hours during active use
- Speed: 10Hz
- Connectivity: BLE and ANT+
Compatibility details
Compatible with: V02Master Manager, Splendo Health & Fit, ANT+ profiles with Garmin, Wahoo, etc. As well as Garmin data field
Take Out
From the research I have conducted and the conversations I have had with industry professionals who have used Train.Red, it appears that the data, like that of Moxy, is broadly accepted to be reliable.
However, the issue that I have encountered is that although this data may be standard in ANT+ terms, it was either challenging or impossible to use on my sports data platforms. For instance, I had to manually export the full data from the Android app (I usually use an iPhone), and during workouts, I could only view the muscle states on the Android app. The Garmin CIQ data field merely displays a number, which has limited usefulness.
Therefore, I am not entirely sure if Train.Red, like Moxy, is focused on the professional and laboratory ends of the market. If it is, then the product may be perfectly usable as of now. However, if one of the primary goals is to market to consumer-grade athletes or aspiring athletes, then more attention should be given to the in-workout experience. In simpler terms, all the data should be evaluated and colour-coded in a visually appealing Garmin CIQ data field.
I want to see a concept of Zones or states and know when mine changes so that I can react accordingly.
This is not intended to be a review so any comments, revisions or suggestions on tests to perform are appreciated below. I should hopefully have a Moxy as well this week and have reached out to Graspor.
Related reading: Apple looking to boost HRV features.
Last Updated on 10 April 2026 by the5krunner
My favourite kit and nutrition
- Injinji – Runners protect your toes. Avoid discomfort and minor injury. Run more. Run faster. I use them.
- Garmin 90-degree charging adapter — The small adapter that keeps your charging cables tidy. Essential for race day. I use one.
- Garmin charging puck — the fastest and most reliable way to top up your Garmin before a session. I use one.
- Ravemen FR300 — Front light that mounts directly under your Garmin or Wahoo head unit. Keeps your bars clean and your beam pointed where it matters. I use one.
- Body Glide – The blue anti-chafe stick that all swimmers and many runners use. I use it.
- Maurten — The race nutrition trusted by elite athletes. Gels and drink mixes engineered to be easy on the stomach. I use them.
- Garmin Varia RTL515 — A radar rear light that alerts you to vehicles approaching from behind. Pairs with your Edge or Garmin watch. I use this model.
- Favero Assioma Pro RS2 — The power-meter pedals most serious cyclists choose. Accurate, easy to move between bikes. I use this model.
- Garmin Forerunner 970 — A serious choice for a pro-grade triathlon watch. I use this.
- Polar H10 — My daily driver for accurate, waking HRV readings.
- Wahoo ELEMNT Roam 3 — The bike computer that has the feature Garmin lacks: usability. I use mine on most rides.
Reader-Powered Content

This content is not sponsored. It’s mostly me behind the labour of love, which is this site, and I appreciate everyone who supports it.
Support the site: Follow (free, fewer ads) · Subscribe (paid, ad-free) · Buy Me A Coffee ❤️
All articles are written by real people, fact-checked, and verified for originality. See the Editorial Policy. FTC: Affiliate Disclosure — some links pay commission. As an Amazon Associate, I earn from qualifying purchases.

tfk is the founder and author of the5krunner, an independent endurance sports technology publication. With 20 years of hands-on testing of GPS watches and wearables, and competing in triathlons at an international age-group level, tfk provides in-depth expert analysis of fitness technology for serious athletes and endurance sport competitors. ID

Given that, how do you use the data in a workout? Are any of the data actionable live, even assuming a sort of zone display? If so, how? Everybody intrinsically knows when oxygen consumption is going up (when you’re working harder) and you don’t need the SMo2 sensor to tell you that. Do you use the data post hoc to find your LT zone, or some other training threshold?
you use the android app !
which is kinda alright in a home pain cave when you might be able to get an extra device beside your bike
have a look at this: https://the5krunner.com/2018/10/31/humon-hex-review/ which might give you some more ideas on use cases
even tho Hex claimed to be able to determine LT2, I’m not entirely sure that science agreed with them! someone else can probably better chip in on that.
I remember using Hex going up the Tourmalet a couple of years ago. I was at 48% for quite a long way toward the end. Proof if it were needed that I could/should push no harder!
In a running race scenario would this tool be useful to gauge how long and what intensity to warm-up at?
yes. !
I guess you could try out a few warmups and races over several weeks, noting how you perform. Then once you’ve found the optimal warmup for you you would just do the same thing going forwards.
this is the BC one https://the5krunner.com/wp-content/uploads/2019/09/20_MINUTE_WARM_UP-British-Cycling.pdf which you could adopt for running based on your rFTP.
it’s essentially an easy cadence/wattage ramp to rFTP followed by plenty of recovery and recovery between 3x 6 second sprints. the one i use ramps up the wattage