 Train Red Review (FYER, PLUS)
This review covers the Train.Red FYER and Train.Red PLUS muscle oxygen sensors across endurance training, gym work, and structured intervals. Train.Red has since released the 2.0 generation of both sensors, which lifts active battery life into double-digit hours, adds onboard storage and offline recording, and brings an IMU to the FYER.
TL;DR – This Pro Level Muscle Oxygen sensor whose gold-standard sensor seems to offer good data, a nice app and some integration with Garmin devices. It is aimed at Pro and Lab usage plus committed self-training athletes in the gym and on the road.
Verdict: ⭐⭐⭐⭐ - Great for the gym, gold standard sensor, nice app.
Summary
Train.Red can deliver enlightening insights into the inner workings of your body during exercise. Muscle oxygen states are more complex to understand than simple metrics like HR Zones or Power Zones, yet oxygen supply and utilisation are fundamental factors determining our performance levels. The brand’s newly updated smartphone app goes a long way to demystifying and simplifying SmO2 for gym-based athletes. Endurance athletes can benefit too but perhaps from a narrower range of use cases.
Pros
- Has the ‘Just Works’ factor
- Gold standard ARTINIS sensor
- Good smartphone app
- Novel metrics: Recovery Phases/Zones, Muscle states
Cons
- Garmin CIQ Data Field needs work
- Expensive
- Consistent sensor placement is tricky
- Workout data cannot be cached and retrieved by the app
- Calibration only occurs before a workout starts in the smartphone app.
Train.Red – What this review is and is not trying to achieve
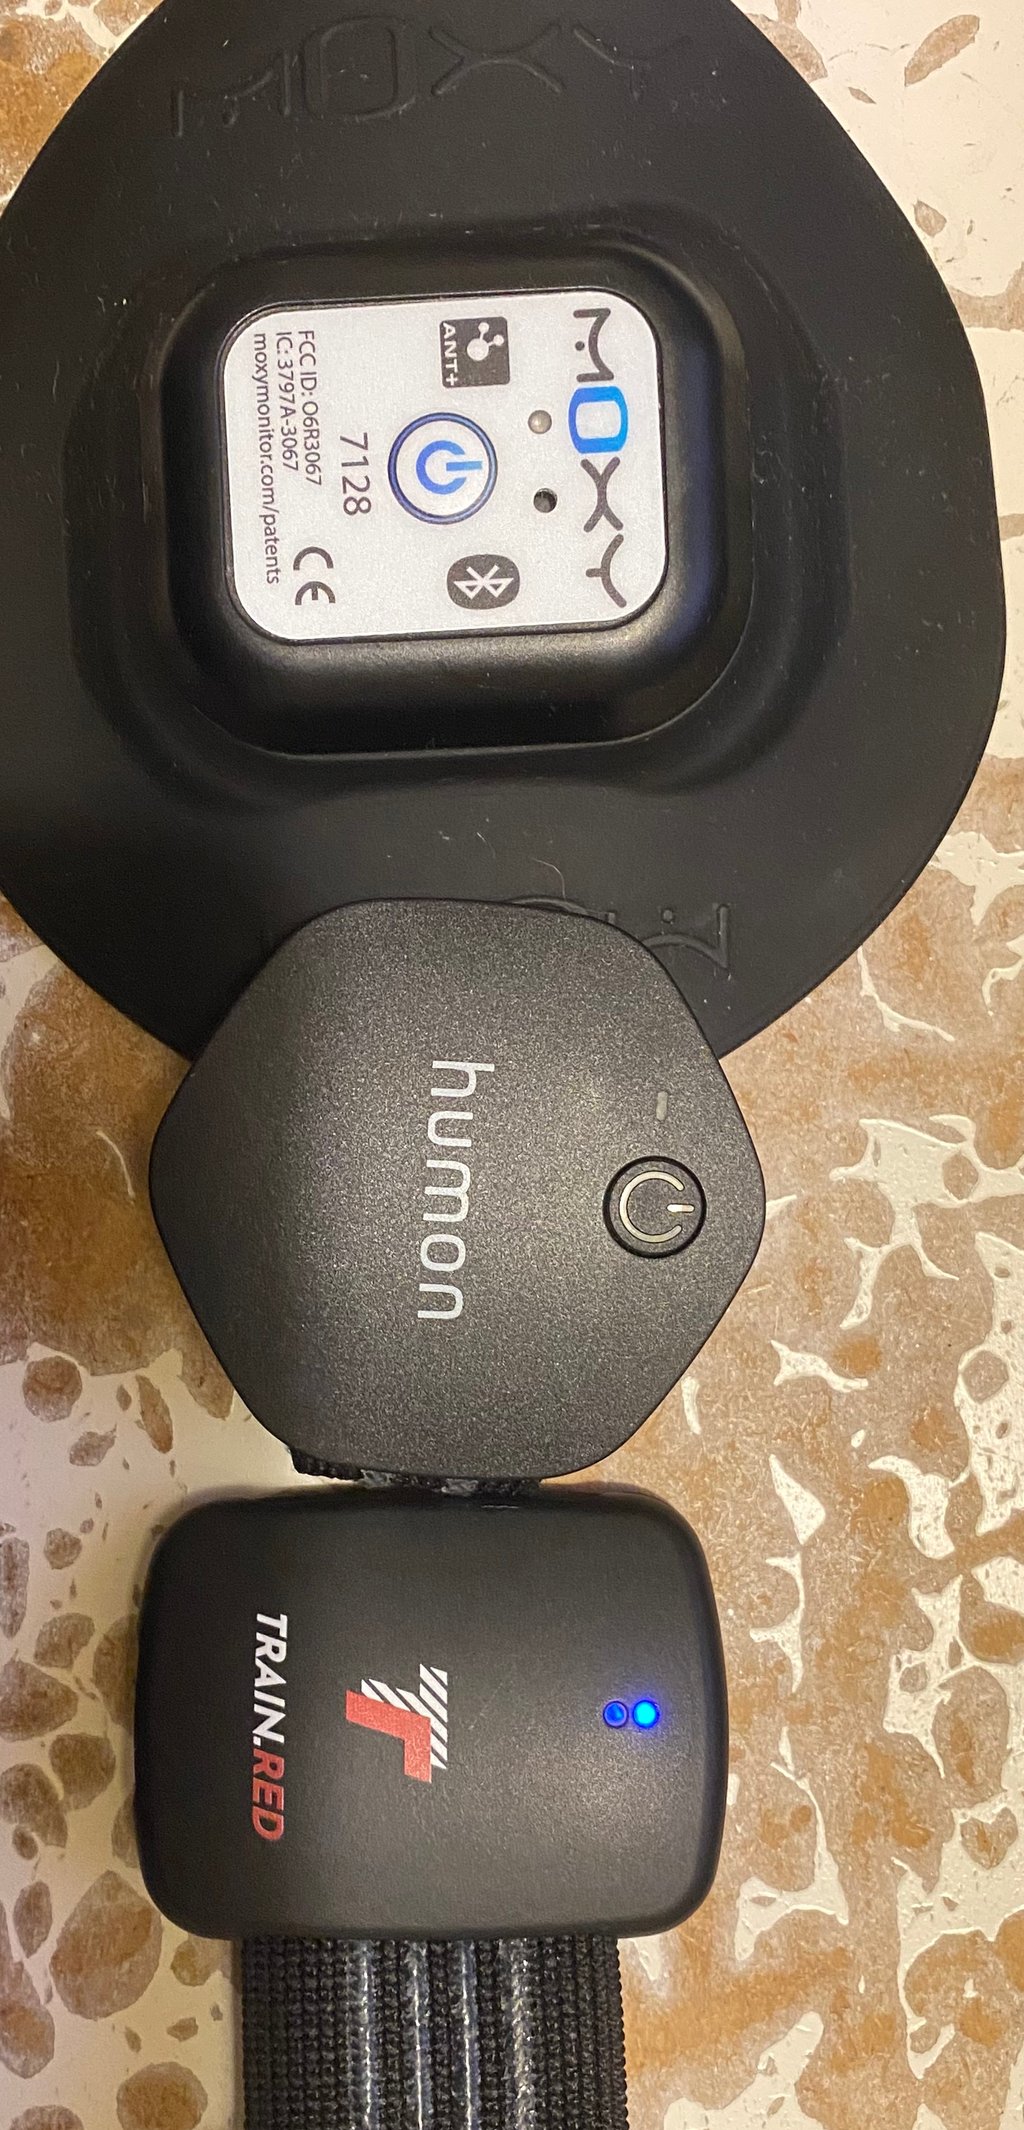
I don’t have access to a lab to validate accuracy. Nonetheless, I’ll compare it to my other muscle oxygen technologies (Moxy, NNOXX, Humon Hex) to highlight some distinctions.
I aim to strike a balance for readers at various levels, ranging from those unfamiliar with SMO2 to individuals considering the purchase of 12 units for their lab, possibly with extensive experience using Moxy over the years.
For this review, I intend to make it accessible to the average athlete, steering clear of overly technical descriptions of the human body.
What is Muscle Oxygen (SmO2) – Tissue Saturation Index?
The hint is in the name. Muscle oxygen, denoted as SmO2, differs significantly from SpO2, which measures blood oxygen. For performance athletes, the primary focus should be on SmO2, while SpO2 serves more as a wellness indicator for aspects such as sleep, altitude, illness, or jet lag.
Our primary concern lies in the percentage of oxygenated haemoglobin in the muscle, both in absolute terms and in terms of its trends, whether it’s rising, stable, or falling. We’ll delve into the maximums, minimums, and ranges of muscle oxygen to provide a comprehensive understanding.
- In English: Muscle oxygen is oxygen in the MUSCLE ie SmO2. TSI is TISSUE Saturation Index ie the oxygen in muscle PLUS other stuff.
- Oxygenated Hemoglobin Concentration = O2Hb
- Deoxygenated Hemoglobin Concentration = HHb
- Calc: Total Hemoglobin Concentration = tHb = O2Hb + HHb
- Calc: SmO2 is O2Hb as a percentage of total [ 100*O2Hb/(O2Hb + HHb) ]
- (De-oxy) Oxymyoglobin & (HMb) O2Mb cannot be distinguished by NIRS.
It’s also worth noting that blood volume and flow will change in the muscles during exercise.
A Brief History: Muscle Oxygen Sensors in Consumer Sports
While PORTAMON (Artinis) stands as the gold standard for laboratory use, several alternatives are vying to be its successor and cater to a broader audience.
- Moxy Monitor (2013-Present)
- BSX Insight (2014-2018)
- Humon Hex (2018-2020)
- Train.Red (2021-present), uses Artinis Sensor
- NNOXX (2023-present)
- Graspor, Repace, Portamon and Q-Lac are other products
Putting technical issues aside, muscle oxygen sensors solely aimed at the consumer space, such as the Humon HEX, seem to struggle to find a viable market.
Moxy, on the other hand, has consistently targeted labs, researchers, and professional or committed athletes. It is a scientifically validated and widely used product, albeit with low-resolution data and limitations in muscle penetration. Its measurements employ a Monte Carlo technique to address technical challenges.
In my view, Humon Hex boasted an excellent app and Garmin-based ecosystem, along with claims of scientific validation. Those factors proved insufficient to maintain a stable commercial position.
Train.Red, in contrast, focuses on the lab and professional market with what appears to be a solidly grounded product.
NNOXX enters the scene as a more affordable newcomer, also measuring Nitric Oxide in the muscle, a crucial regulator.
How does a Muscle Oxygen Sensor work
Train.Red employs modern, lab-grade sensors from Artinis, widely recognised as a Gold Standard. A detailed explanation of how these sensors work can be found here.
In simple terms, the characteristics of received infrared light can ascertain the real-time presence and proportions of different types of haemoglobin.

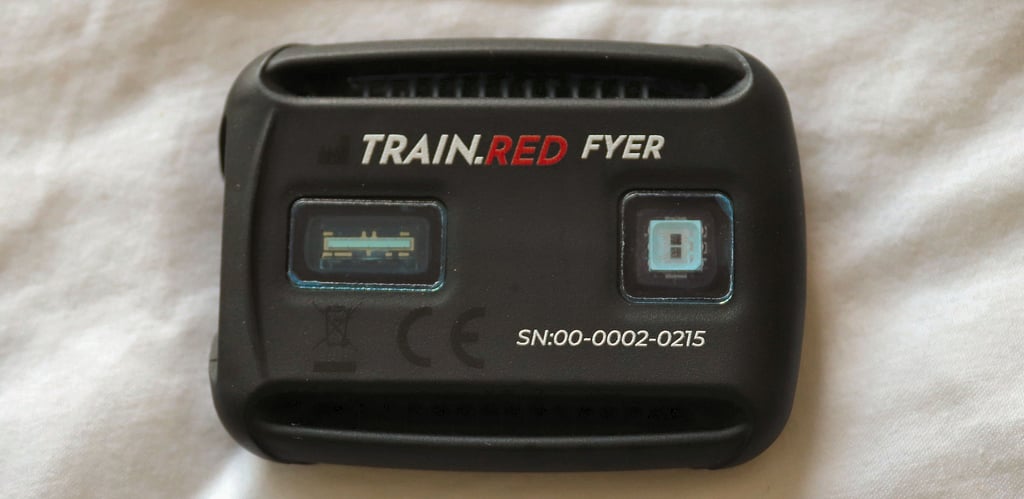
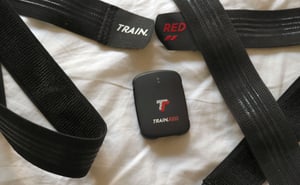
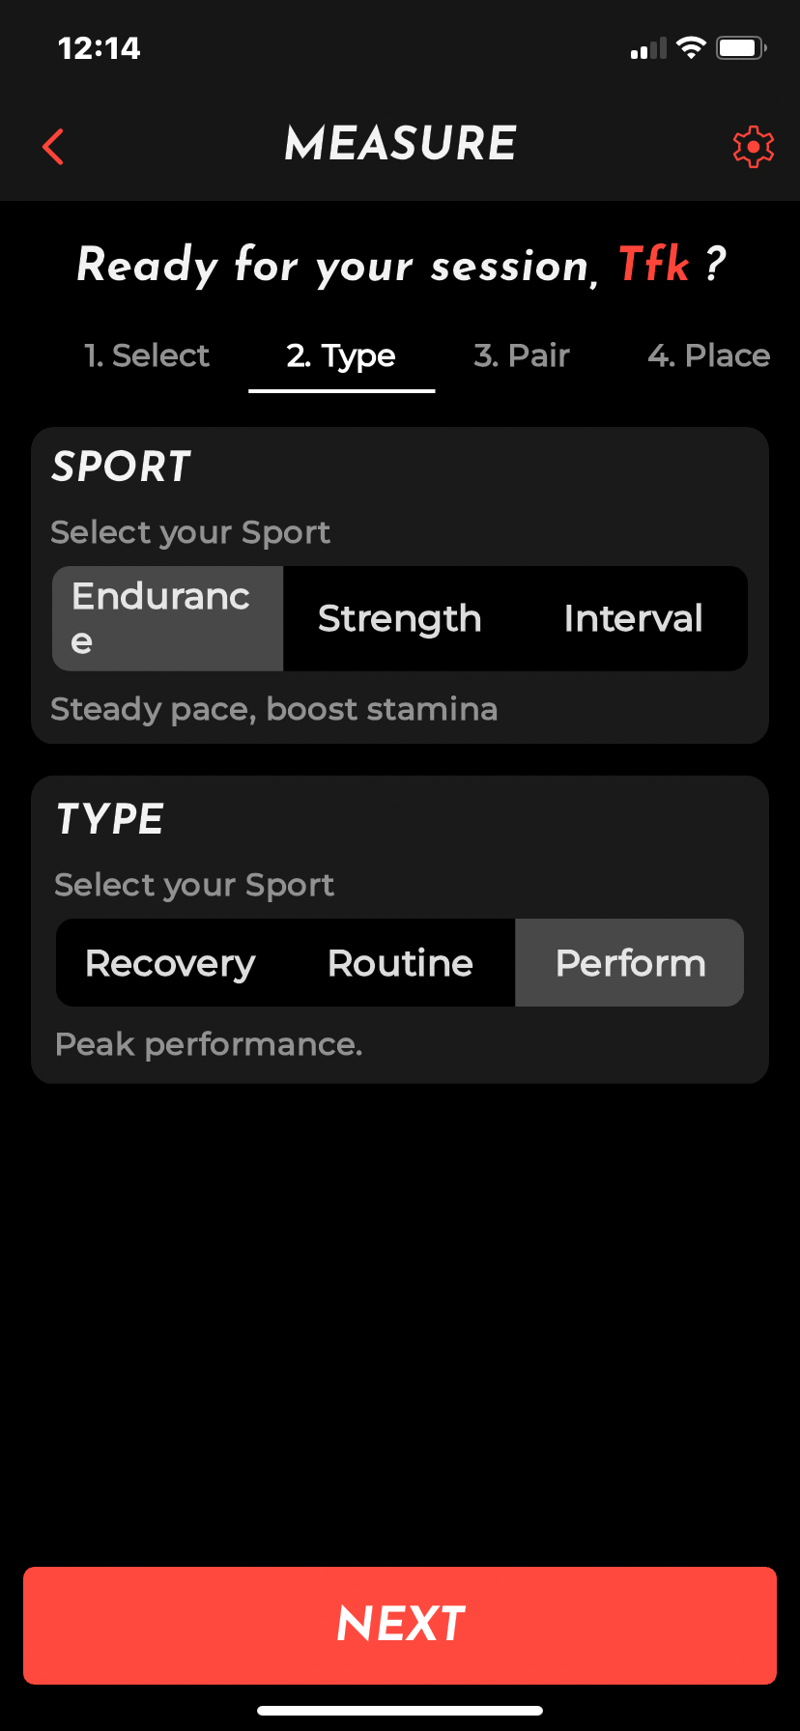
Train.Red – What’s In The Box, Compatability and Setting Up
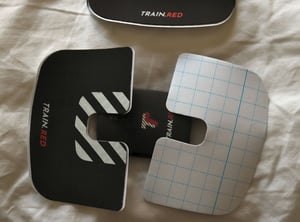
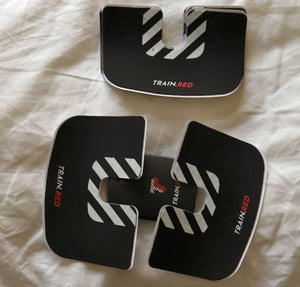
The sensor is packaged with three branded velcro straps of varying lengths, neatly arranged in a compact carry case. Adhesive patches are included for placing over the sensor to exclude light, although snug lycra shorts can serve the same purpose. The FYER 2.0 also ships with a waterproof USB plug.
Charging is facilitated with a standard USB-C cable.
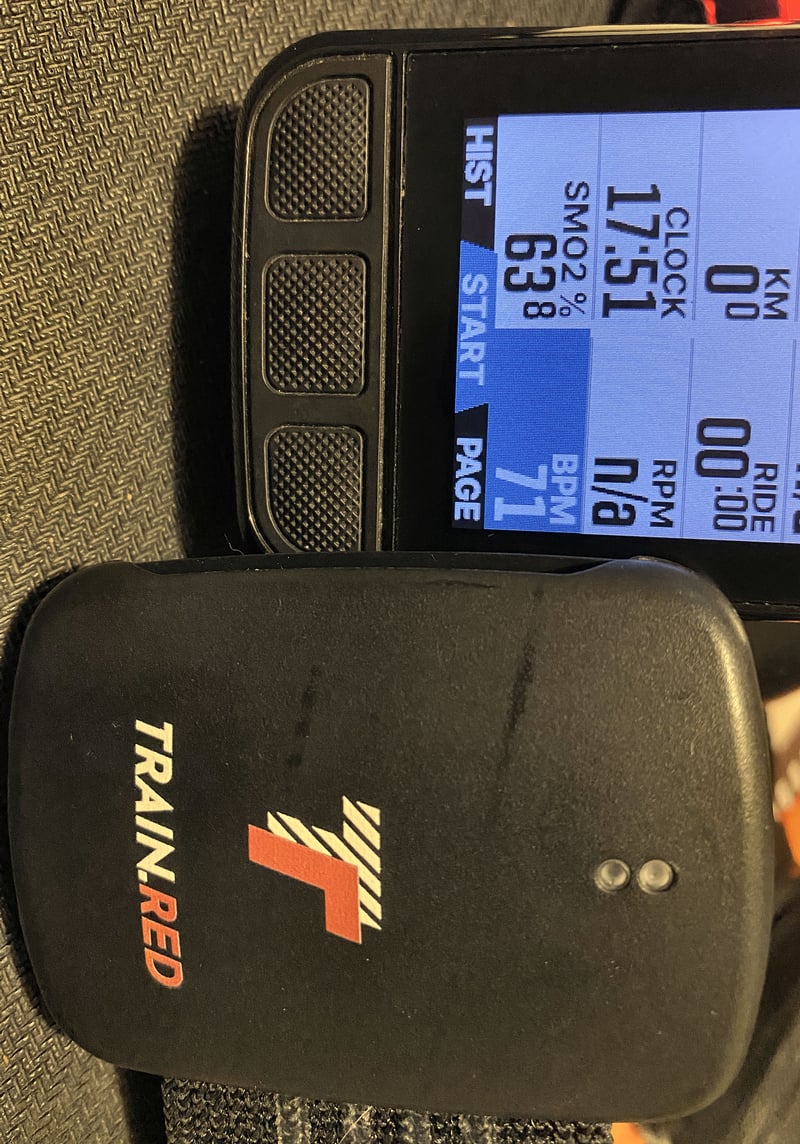
When initiating each usage, the smartphone app prompts for Bluetooth pairing with the strap. Pairing with Wahoo or Garmin is achievable using ANT+, leveraging the built-in muscle oxygen recording and display capabilities of those products.
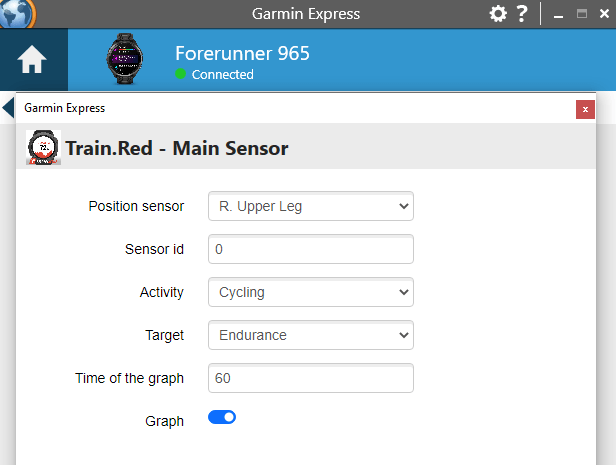
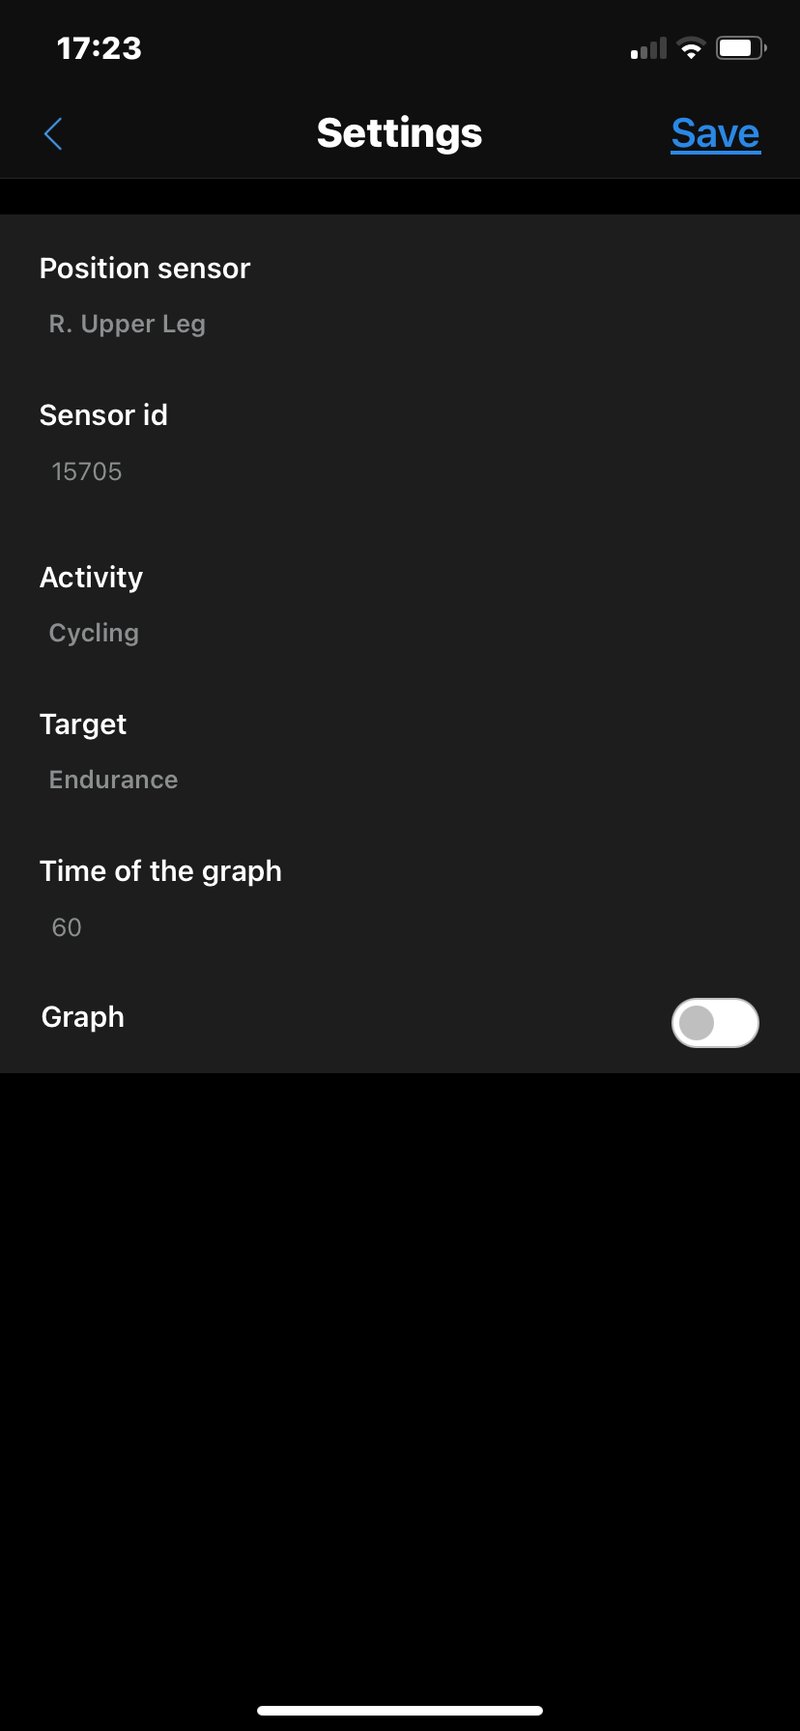
For Garmin watches and Edge bike computers, Train.Red offers compatibility through CIQ Data fields. It’s advised to disable sensor pairing and instead connect directly to the data field. To accommodate multiple sensors concurrently, several data fields are available. Manual assignment of an ANT+ ID to each field is recommended to prevent unintended pairing with other sensors.
Furthermore, Train.Red can seamlessly integrate with the VO2 Master app.
TRAIN.RED FYER 2.0 SPECIFICATIONS
-
- Size: 1.2 x 4.4 x 5.9 (cm) / 0.5 x 1.7 x 2.3 (in)
- Weight: 20 grams (lightest in its class)
- Measure-depth: up to 20mm in your muscle
- Light source & detector distance: up to 35mm
- Channels: 1 (64 micro channels)
- Sweat-proof: Yes
- Waterproof: Yes, IPX7 with the supplied plug
- Battery: up to 20 hours of active use
- Speed: 10Hz
- Connectivity: BLE and ANT+
- IMU: accelerometer and gyroscope
- Onboard storage: Yes, 1,000+ hours of offline recording
- Multi-sensor: 10+ FYER sensors to a single smart device
- Data export: CSV, FIT and Report
- Materials: high-quality biocompatible ABS and TPE
- Size: 1.2 x 4.4 x 5.9 (cm) / 0.5 x 1.7 x 2.3 (in)
TRAIN.RED PLUS 2.0 SPECIFICATIONS
Measures more frequently and deeper, with six channels for spatial coverage and an accelerometer and gyroscope to assess external work.
-
- Size: 1.5 x 4.4 x 6.8 (cm) / 0.6 x 1.7 x 2.7 (in)
- Weight: 26 grams
- Measure-depth: up to 25mm in your muscle
- Light source & detector distance: up to 40mm
- Channels: 6
- Sweat-proof: Yes
- Waterproof: No, sweatproof only
- Battery: up to 18 hours of active use
- Speed: 100Hz (fastest in its class)
- Connectivity: BLE and ANT+
- IMU: accelerometer and gyroscope
- Haptic feedback: Yes
- Onboard storage: Yes, 1,000+ hours of offline recording
- Multi-sensor: 10+ PLUS sensors to a single smart device
- Data export: CSV, FIT and Report
- Size: 1.5 x 4.4 x 6.8 (cm) / 0.6 x 1.7 x 2.7 (in)
Using Train.Red
The device is a one-size-fits-all model that swiftly and dependably pairs.
With no buttons to manage, the device turns on and off automatically, and a reset is achieved by placing it on charge.
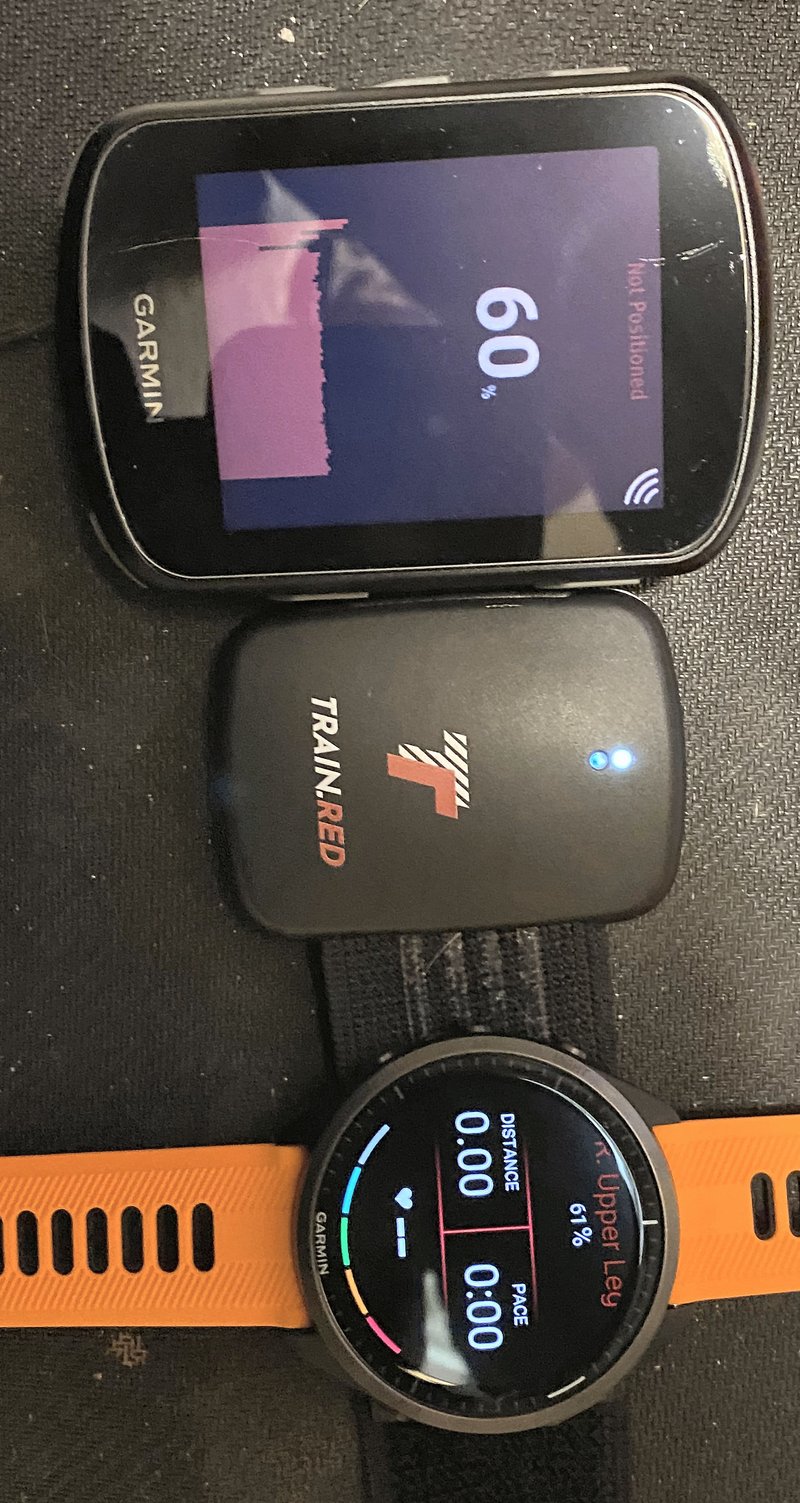
- LED colours:
- The green LED is solid while charging and off when fully charged
- When the blue LED is blinking the sensor is on and ready to connect
- The white pulsing light indicates the device is connected and working
- No light: Train.Red is off
Train.Red has its own Garmin Data Fields. However all other muscle oxygen sensor also have their data fields and all seem to work interchangeably, presumably because they all use the same ANT+ Profile for SmO2.
Practically, Train.Red is versatile and can be used on any muscle group, with the only limitation being the maximum size of the thigh due to the largest strap length available. Different muscle groups will need the sensor to be fastened on the body with one of the adhesive patches
To ensure optimal usage, consider the following key factors:
- Keep Train.Red in a fixed position during the workout to prevent subtle positional variations that could yield different results.
- Consistently place Train.Red in the same position across multiple workouts for more accurate comparisons.
- Prevent external light interference with the sensor by wearing tight lycra shorts and avoiding close proximity to other sensors.
- Utilize the app to calibrate before a workout. While this step is required when the app records a workout, it’s important to note that calibration through a Garmin data field may not be possible.
Train.Red App & Ecosystem
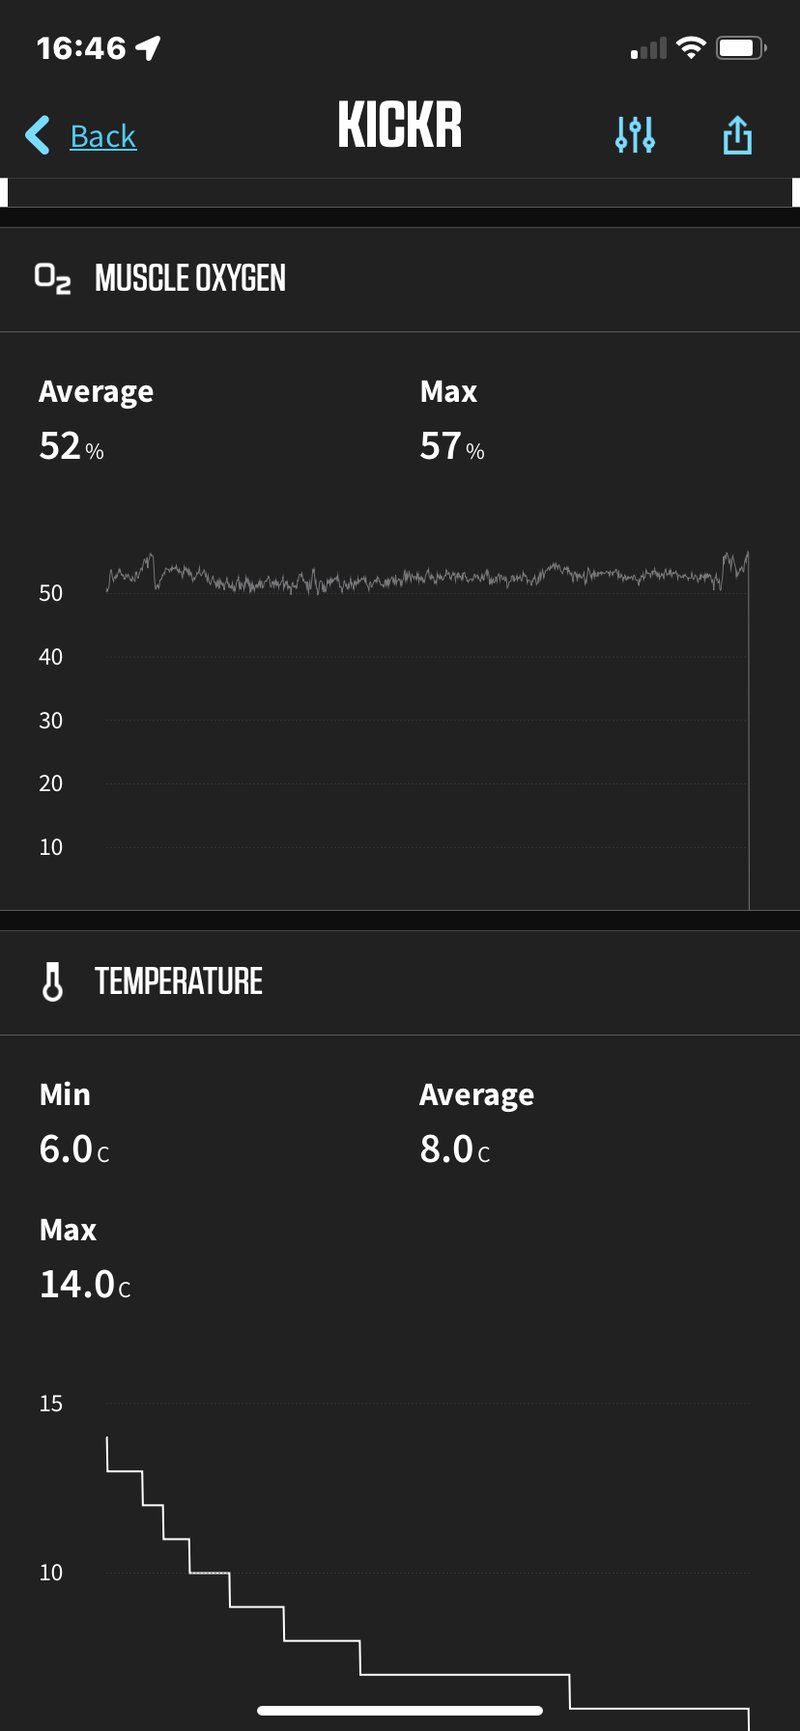
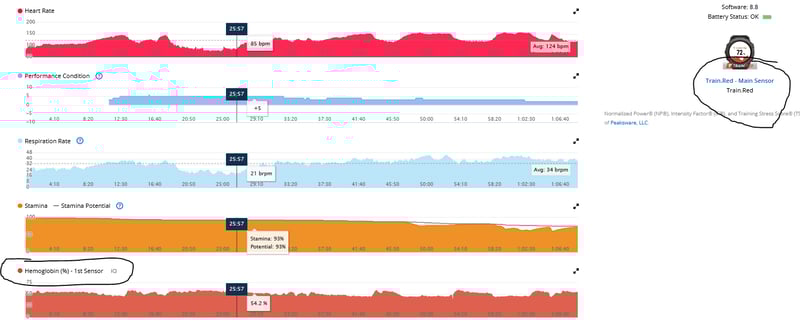
Train.Red’s smartphone app falls into the category of RECORD and REPORT applications. One segment of the app is dedicated to recording workouts, providing a live chart displaying changing muscle states and SmO2 ranges. Users can even capture a photo of their efforts overlaid with SmO2 metrics. The REPORT section of the app offers similar information for all workouts recorded within the app.
The app has matured into a visually appealing interface, and the relatively straightforward graphs gain enhanced significance through the addition of colour-coded sections corresponding to muscle states and profiles. The Train.Red app is available on iOS and Android.
It’s important to note that only workouts recorded within the app are displayed in the app. There is no functionality to sync workouts between Garmin, Wahoo, or VO2master.
Using Train.Red with Wahoo & Golden Cheetah
Train.Red broadcasts SmO2% using the standard ANT+ profile for muscle oxygen, providing a basic but crucial functionality. While you can use the inbuilt muscle oxygen metrics to display SmO2% on your Wahoo device, it’s important to note that the data saved in the FIT file and app is limited to just that specific metric.
Using Train.Red with Garmin EDGE/WATCH and Connect
Similar to the previous example, if you pair your Edge or Watch to Train.Red, you’ll only be able to display and record the transmitted data, specifically SmO2%.
Garmin provides an additional option where you can use one or more Train.Red data fields to record data from multiple sensors. These data fields show the sensor placement, the SmO2 measure, and a line chart of recent readings. You can assign the ANT+ ID of each sensor to its corresponding data field. However, as of now, only SmO2 data is available through this method, but it’s anticipated that this might change over time.
I want to now go through a several differetn workouts recorded with different devices, hopefully to give you a kind of story that will progressively introduce some of the aspects of training with muscle oxygen as well as illustrating aspects of the technologies I’ve used.
Train.Red vs Moxy in an easy aerobic Ramp
I conducted a straightforward ramp test in an attempt to gather values for dfa a1 (I failed!). Nonetheless, the SmO2 data collected appears to be accurate and reliable. I utilised an iOS app named VO2master for data collection, which is an excellent and free tool capable of recording similar data streams from multiple sensors. It allows CSV export but also produces a FIT file which I used to easily get the info into the DCRANALYZER as developer data fields. Ray’s tool isn’t perfect for displaying this data but the ease of getting the data into it and producing a simple graph is why I’m using it here.
Observing the graph, it’s apparent that as the ramp progresses, my SmO2/TSI levels start to plateau after around 18 minutes. This stabilisation point may signify a sustainable level where oxygen utilisation and demand reach a balanced state.
You might now be wondering why the Moxy and Train.Red values are completely different despite seeming to follow a similar pattern.
Moxy vs. Train.Red Technical differences
Moxy asserts that its product provides readings of absolute SmO2, while Train.Red measures something similar termed TSI (relative concentration change of Tissue Oxygenation). However, Train.Red reads values from different tissues. It emits light at a wavelength of 850nm, which penetrates more deeply than shorter wavelengths. In comparison, Moxy employs wavelengths of 680nm, 720nm, 760nm, and 800nm, where the 760nm wavelength penetrates only a few millimeters. Train.Red claims to incorporate technical design factors related to transmitter/receiver spacing, enabling penetration of up to 30mm.
Both sensors utilize complex mathematical models to derive readings. Moxy incorporates an adipose tissue layer correction based on a Monte Carlo model/look-up table, resulting in lower values.
The data presented has been averaged over per-second intervals. Other charts may display fuzzier data when plotting more frequent raw data. Moxy reports sample frequencies of 0.5, 1, or 2 Hz but samples at over 1000Hz. Train.Red FYER reports at 10Hz, with the PLUS reporting at 100Hz.
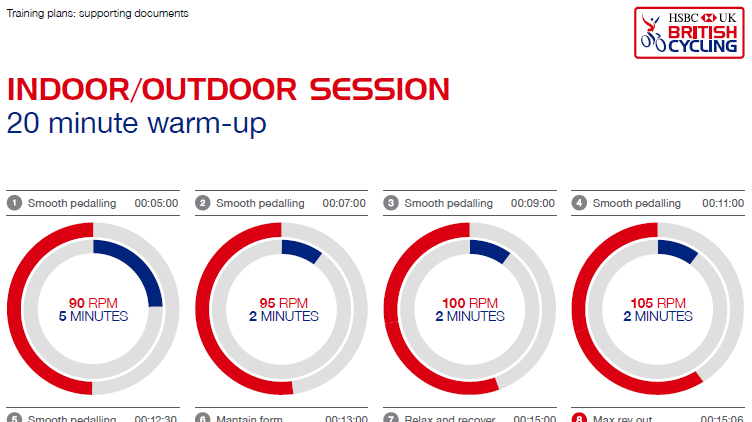
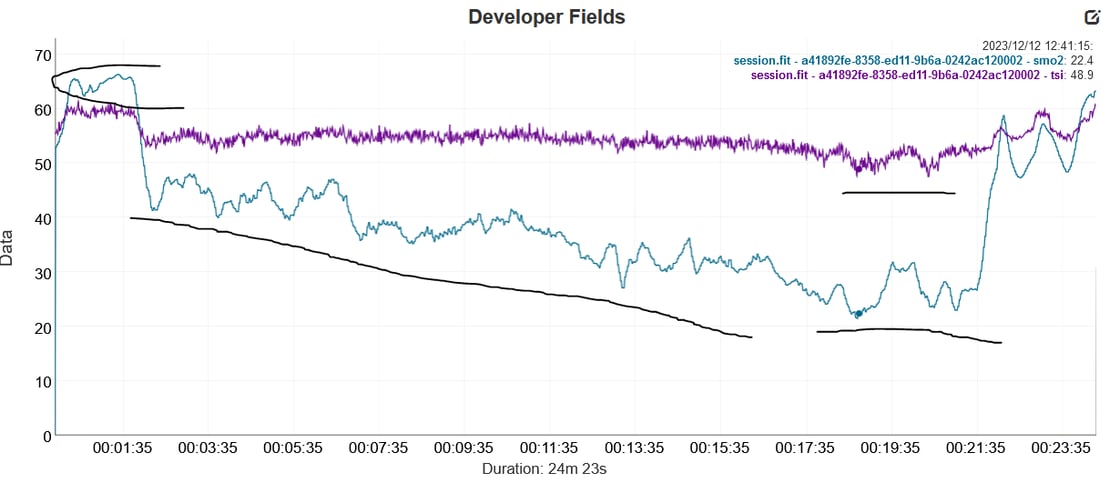
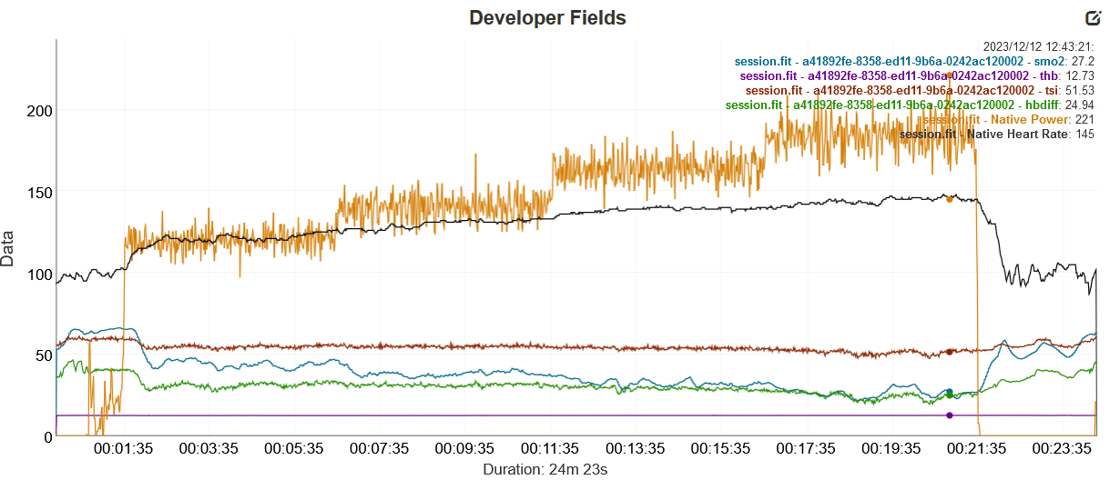
Train.Red Used In a Warmup
One use for Train.Red and muscle oxygen data is to ensure you have warmed up properly. The second of these two charts shows you the power/HR profile for reference of the British cycling warmup I typically use. The question to consider is whether this warm-up routine is effective.
In the first image, it’s noticeable that the warm-up initially reduces my Muscle Oxygen (Moxy left VL, Train.Red right VL), and at the end, it should ideally be higher than when I started. However, this expected increase didn’t occur in this instance, contrary to the usual outcome with this warm-up routine. Normally, I would anticipate Moxy to be around 70% and Train.Red in the mid-60s. In the subsequent workout, my SmO2/TSI did eventually reach the expected levels, suggesting that I might not have been fully warmed up during by this protocol.
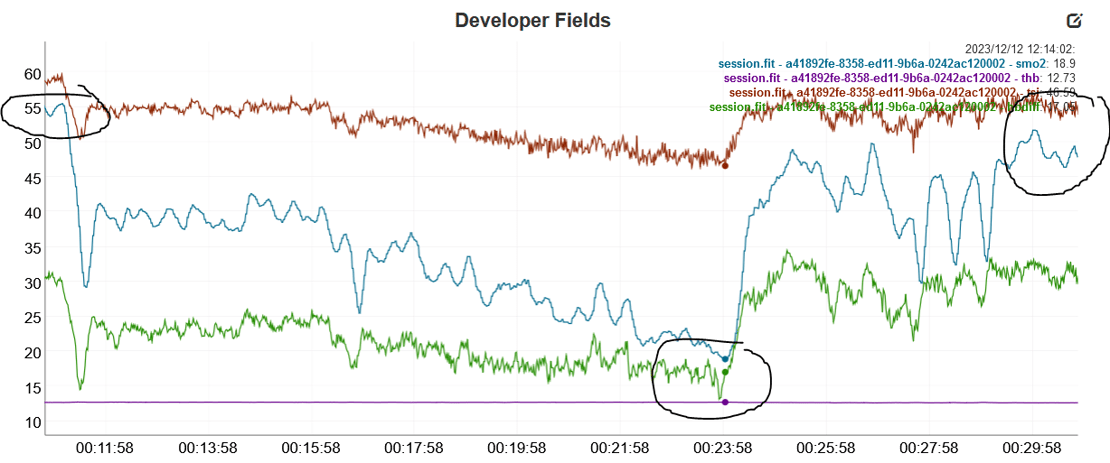
On a different day, following the same warm-up protocol, the next chart displays only Train.Red SmO2/TSI data using its app. I’ve overlaid a green line representing total Hemoglobin (tHb = O2Hb + HHb, oxy plus deoxy). The warm-up appears to have the desired effect, increasing haemoglobin levels to an initial plateau where short sprints were performed. Following the sprints and additional rest, the plateau reached an even higher level, indicating a positive outcome.

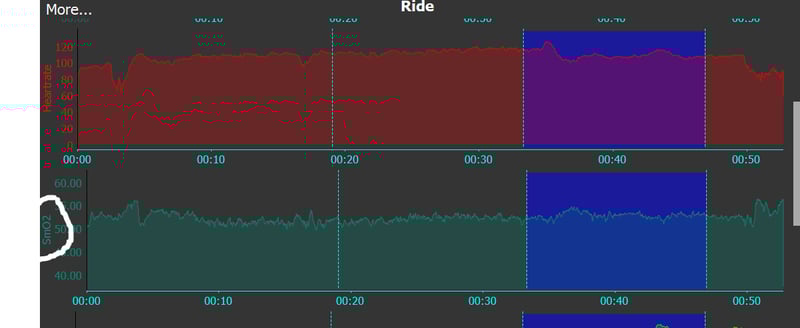
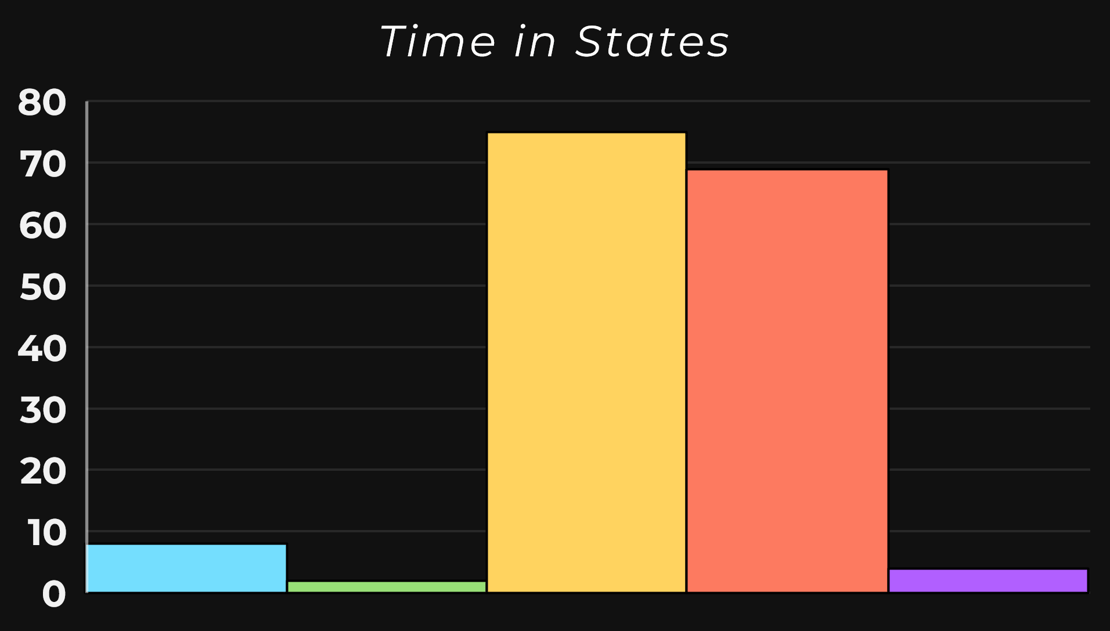
Hopefully, that makes sense so far. Looking at the overlaid Muscle State information on the same data (below), it’s important to realise that there aren’t defined SmO2 zones akin to HR zones. In simplistic terms, 55% SmO2 doesn’t have a specific meaning, as the oxygenation could be either increasing or decreasing at a variety of rates. Instead, the concept of Muscle States is employed, as depicted in the chart with its visually informative shading.
Explanation: Train.Red Muscle States & What They Mean
- BLUE: Recovery – the muscle is recovering. Not as simple as a SmO2 increase, but a combination of all the parameters.
- PURPLE: Load – similar to an occlusion where blood flow is restricted by your muscles growing and compressing small capillaries
- GREEN/YELLOW/RED: EASY – MEDIUM – HARD effort – Increasing rates of SmO2 consumption
TRAIN.RED Used In A Ramp Test vs. Moxy
This is a straightforward ramp. As you might expect heart rate rises with power and SmO2 falls with power. Both recovered quickly after the effort stopped, interestingly, two and a half minutes after I finished, SmO2 rose to my normal level of around 68% (77% with Moxy).
You can perhaps partly see that at about 10:00, the rate of decline of SmO2 (Moxy) lessened, whereas the rate of decline of TSI/SmO2 (Train.Red) appears to fall consistently in line with the increased load.

To demonstrate improvement you would want to ramp to higher power levels before failure. However, another thing that marks improvement is to watch when the flattening of the SmO2/TSI curve occurs, this is called the 2nd SmO2 break point. The longer you can sustain an effort after this point reflects how well your aerobic system contributes to your performance. This point would also broadly correspond to a VT or Lactate Threshold.
The following chart better shows this for someone fitter than me!

TRAIN.RED Desaturation Intervals vs. HR
Here is another warmup (as above) followed by 6 intervals of a minute or so. I did a complete recovery in between. From memory, the power level was quite a bit over FTP; hard, but nothing crazy. You can see that my SmO2/TSI declined to about 58% each time and that my HR was similar each time. So using those conventional metrics you might assume each effort was the same. Clearly not! as the recovery in SmO2 is different each time. The first recovery is to 67.5% and the fifth to 65.5%…funnily enough it shows that the more intervals you perform the harder they get!
That’s perhaps not the most enlightening thing I’ve ever shared, however, consider if rather than using time for recovery you used SmO2 or Muscle state.
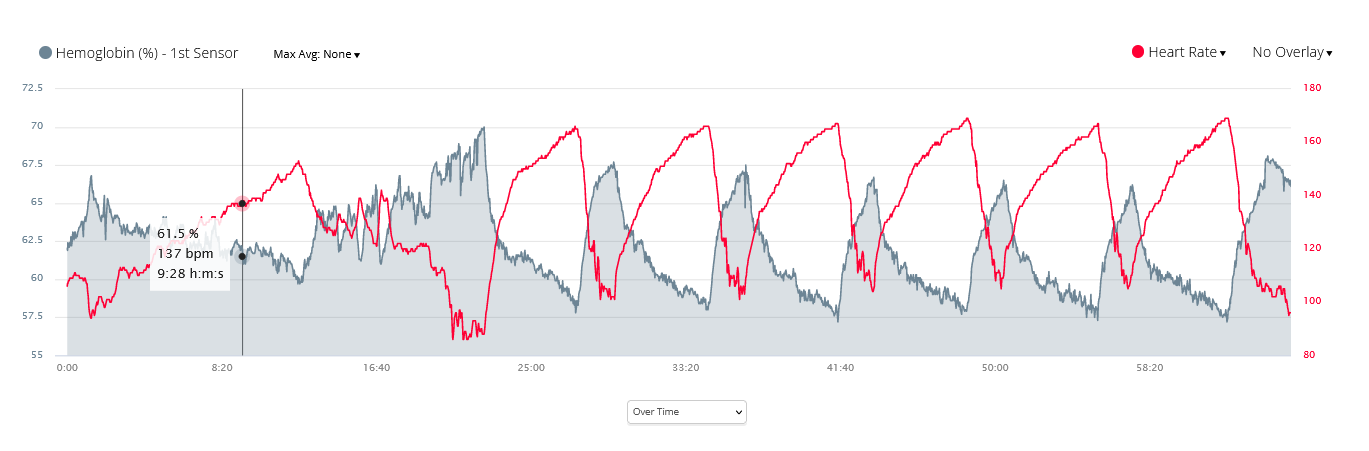
ie I could have performed the effort based on the same power/duration but waited until I recovered to 66.5% or some other desired level. This would potentially make each rep equally as difficult.
If you’re familiar with power-based training using Xert, you may have engaged in similar types of intervals with recoveries of varying durations based on the modelled recovery from the preceding intensity and duration. The principle I’m discussing here is akin to that, but with Train.Red/Muscle Oxygen, the key distinction is that you can MEASURE the recovery rather than relying on a model.
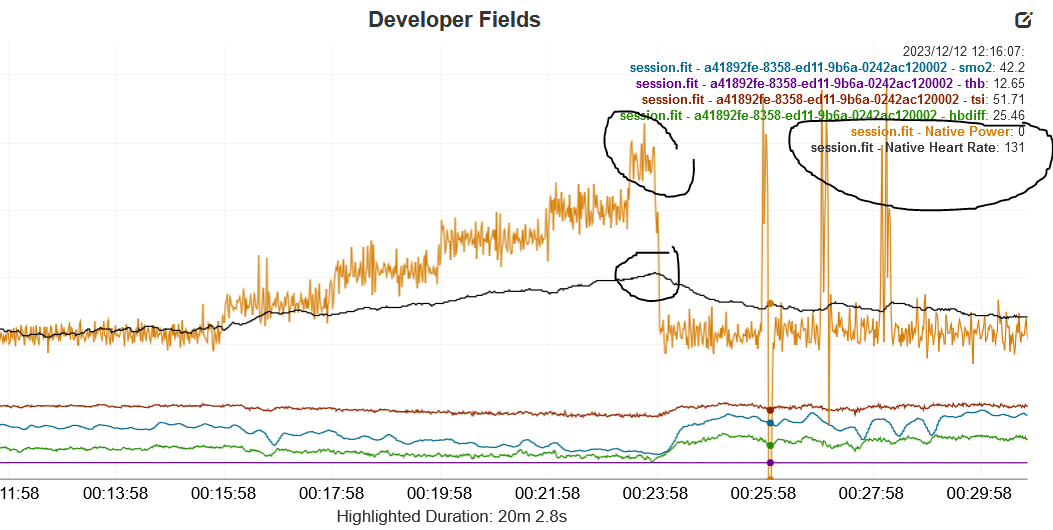
TRAIN.RED to build muscle more efficiently
A broad principle for your work lifting in the gym might be that endurance athletes should do higher numbers of reps and lift lighter weights. Whereas those looking to build muscle mass would do fewer amounts of heavier weights. If you were doing weights to build more powerful muscles you might also want to wait until you have fully recovered from one set before embarking on the next.
Using the same principles outlined in the previous section we can see from this chart how monitoring Muscle Re-Oxygenation can be used to tell us when to start the next rep depending on what we want to achieve.
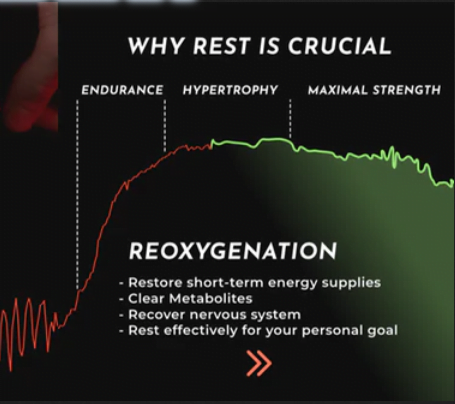
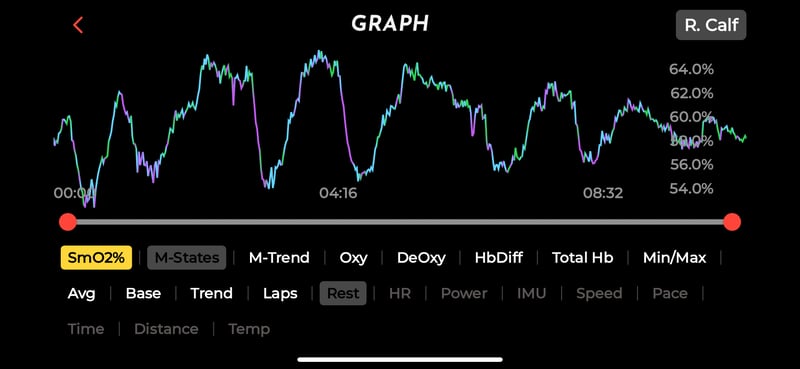
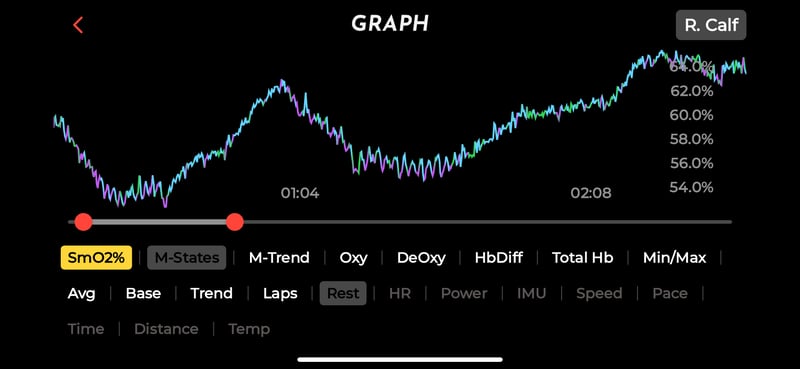
Check out my calf workout in the following images. The second image is zoomed in, showing two of the troughs. You might think the line is a little bit jagged. Those are individual muscle contractions…you can see each one!
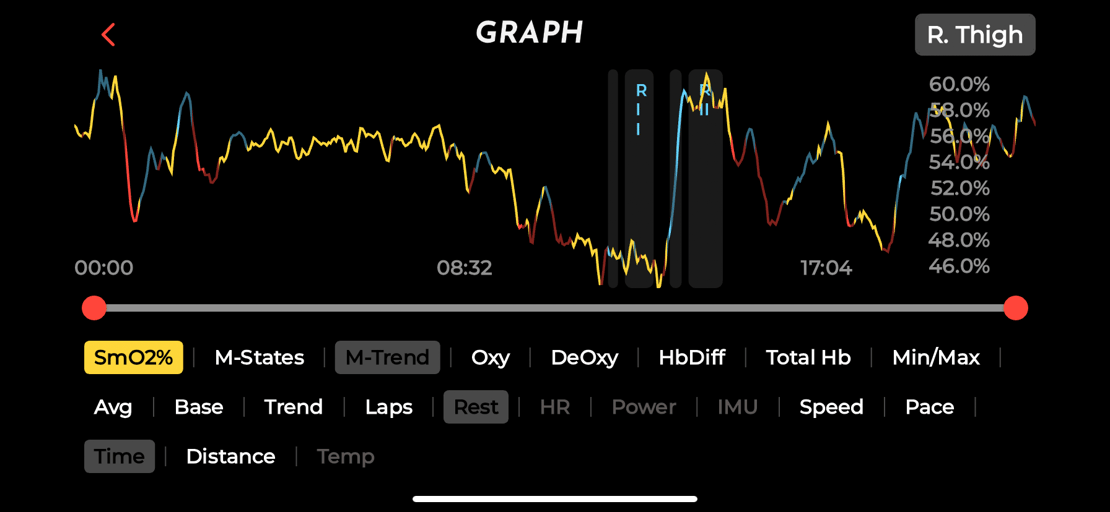
Train.Red Smart Recovery and De-Saturation Intervals
I restarted this workout after a good warmup as my SmO2 levels jumped to 80% which is unusually high for me at the start of a workout, I thought maybe the calibration was off and that a restart would fix that with recalibration. It didn’t. I’m assuming the sensor placement was right over a chunky blood vessel? 🙂
This test was designed to let me do a lot of 30-second intervals at 120% FTP (thirty reps, I think) but I wouldn’t start the next interval until my reoxygenation rate had just started to flatten off. What I hoped would happen would be that the recovery time would lengthen between intervals…but it didn’t, at least not noticeably. The only clear change is about three-quarters of the way through where my muscle oxygen range drops.

I basically ran out of pre-programmed interval steps, so stopped! (I got a bit bored as well) The session was perhaps ‘comfortably’ hard with my HR only just creeping into Z3 despite Z6ish power efforts – I don’t think I’d made the workout hard enough! If only Train.Red could help with that. Oh…wait a minute. What’s this?

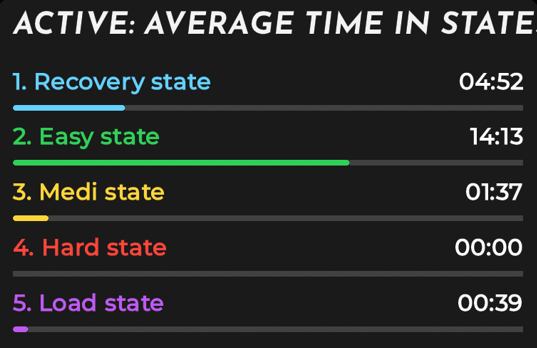
You can see the SMART REST analysis shows the REST ZONES. What I was aiming for was REST ZONE 1 (“Stamina” for endurance) but clearly spent way too much time recovering beyond that in the R2 and R3 zones. Grrr. If only Train.Red could have helped with that whilst I was exercising rather than after the fact. Oh…wait a minute…you guessed it
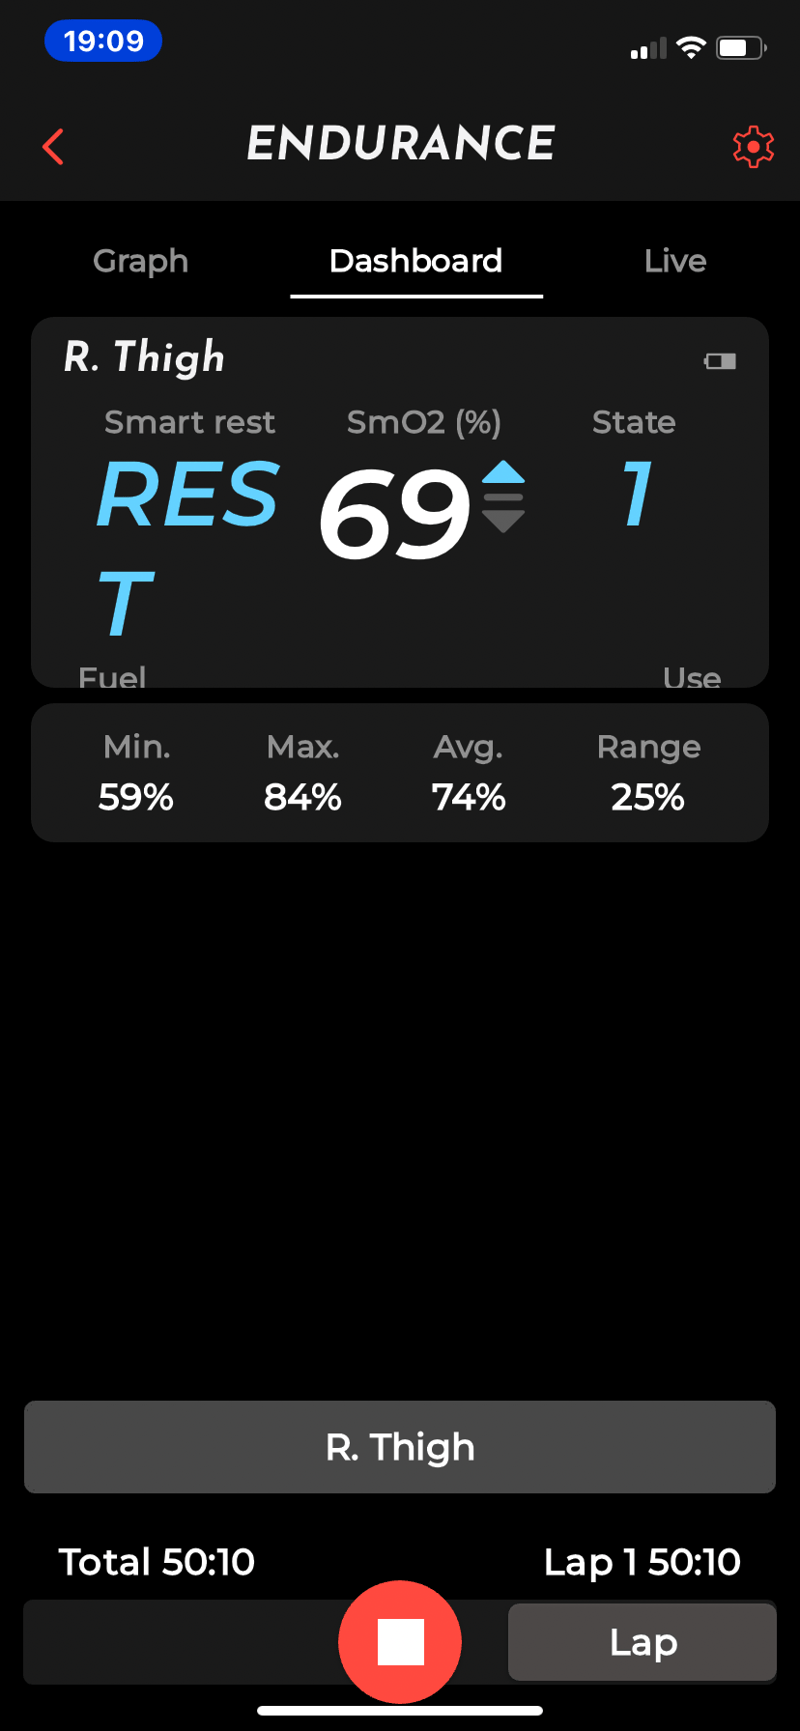
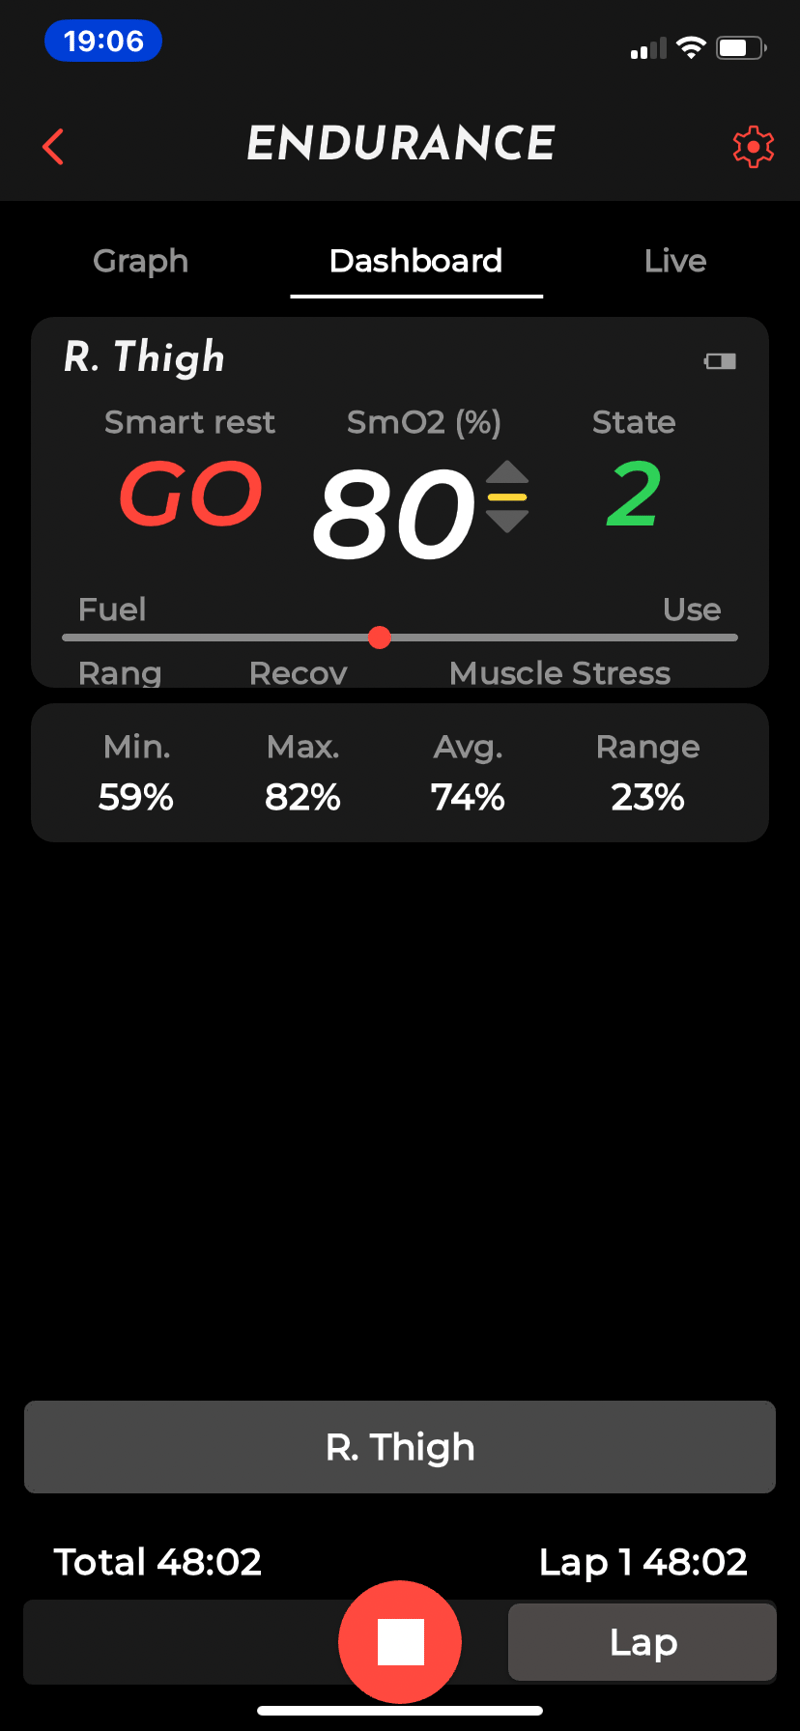
The REST and GO message on the live workout dashboard gives you the instruction you need to end the rest period at just the right time. I think the GO message is determined by the classifications you provide at the start of the workout.
The rest zones and smart rest feature are pretty cool…I’d like to have them on my Garmin.
Identify Your ‘Threshold’
One of the neat features of the old Humon Hex product was that it included a feature that purported to determine your LTHR (LT2). It always seemed to me to be “broadly” right. But what if you want a more rigorously tested approach? To that end, I spoke with Bruce Rogers (NFRMC, Florida) who co-authored this recent study that found how to better detect the RCP/MMSS (maximal metabolic steady state) from HHb break points and dfa a1.

Pacing Endurance Efforts
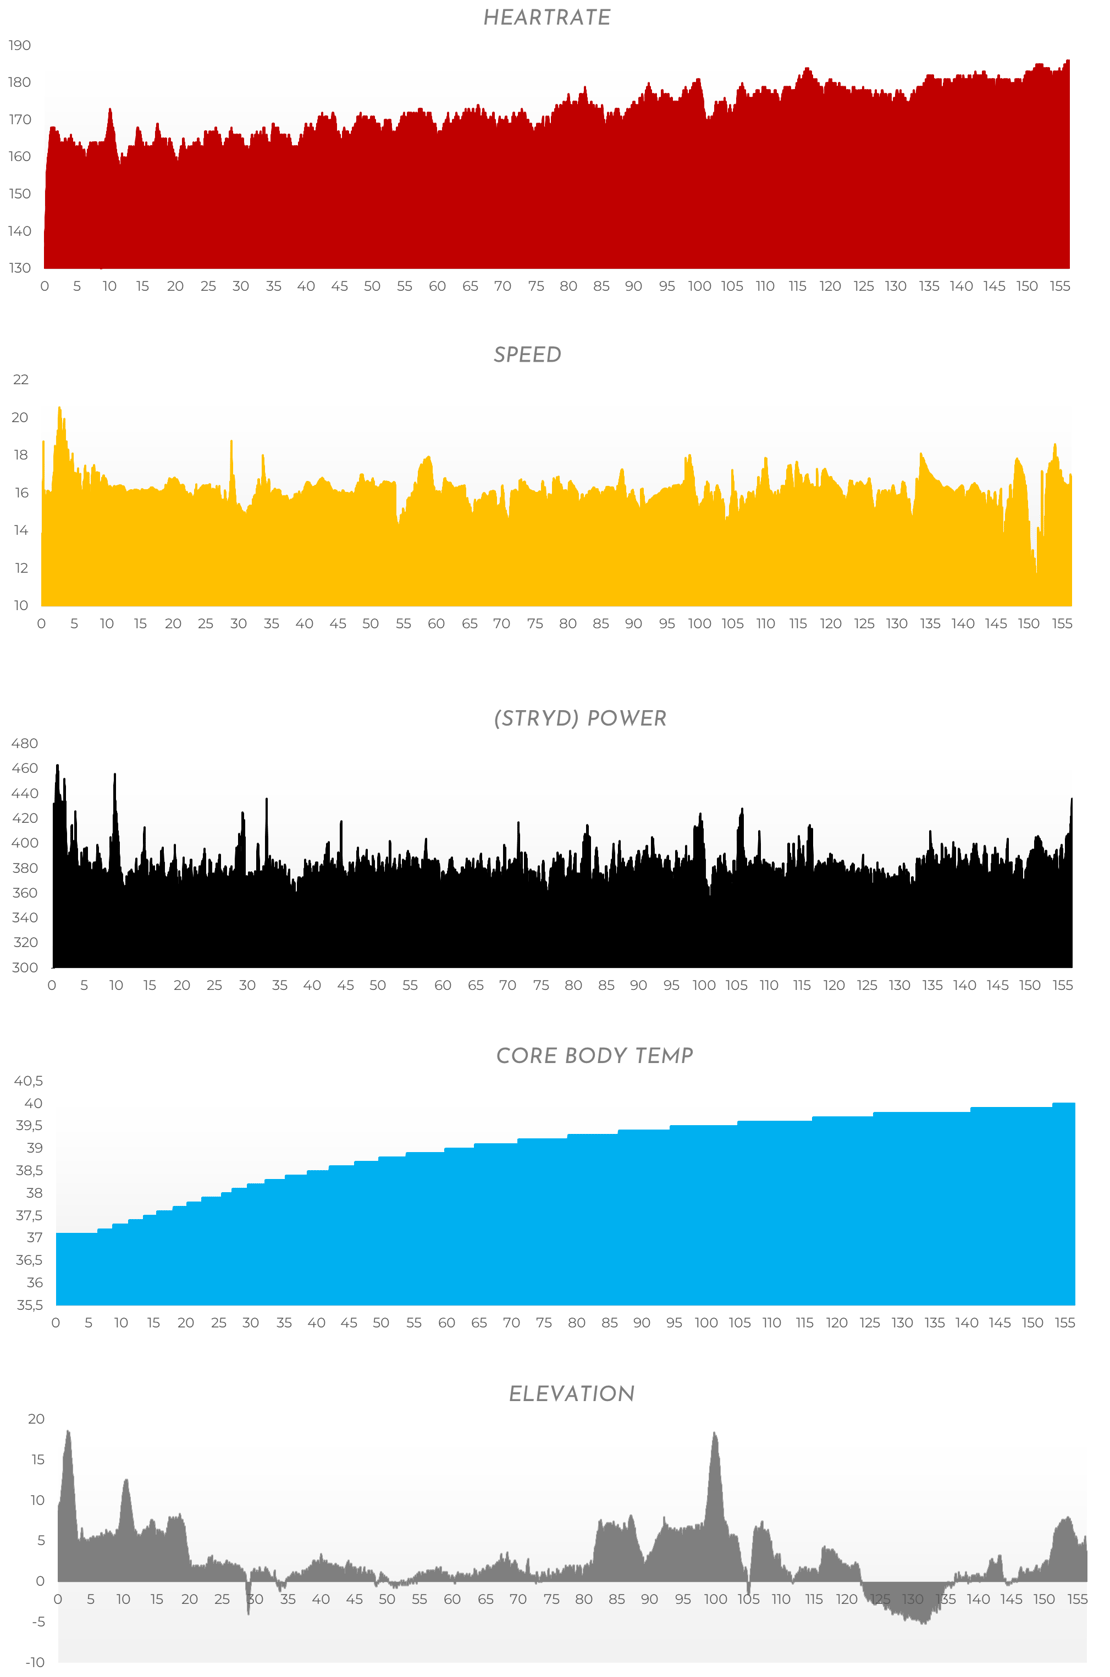
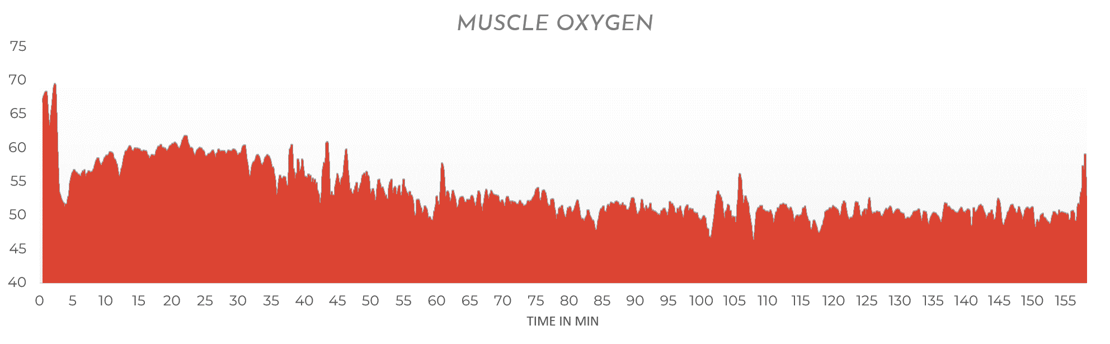
On long days of relatively challenging riding in the Pyrenees, I used a muscle oxygen sensor to manage my efforts. The consistently hot weather, combined with the effects of altitude, presented additional challenges. Caffeine affected the reliability of my heart rate data, and the interpretation of power data was influenced by altitude. In this context, SmO2 was useful for gaining a better understanding of when I was approaching my SmO2 2nd breakpoint. My approach was more practical than scientific at that time but it seemed to work.
Here’s an example from one of Train.Red’s employees in the Rotterdam marathon, where they utilised various gadgets. The SmO2 data became notably useful around 60-90 minutes into the race, indicating a settled and hopefully sustainable level that was maintained through to the end. Post-run data revealed that the athlete spent most of the time in roughly equal proportions in the medium and hard states, a pattern potentially suitable for the marathon distance. If the athlete was pacing based on heart rate, you can appreciate the dilemma they would have faced given that HR rose progressively through the race, what instead was a target HR?; SmO2 adds another potentially valuable data point.
I wouldn’t entirely entrust my race pacing solely to Muscle Oxygen level or threshold in the same manner as I might rely on power, speed, or heart rate. Instead, I view it as an additional data point that adds value. It provides supplementary insights and may maintain its usefulness and reliability for an extended duration compared to some other data points. A variety of data sources can contribute to a more comprehensive understanding of your performance and aid in making informed decisions during a race.
Placement & Wearing
Ensuring consistent placement and excluding external light interference is crucial for accurate readings with Train.Red. Wearing dark lycra shorts is highly recommended for stability during running or cycling. While Train.Red provides a robust Velcro strap, and the addition of lycra prevents undesired movement. Disposable patches are also available for this purpose, suitable for lab experiments yet potentially costly for everyday athletic use. It’s worth noting that if you intend to place the sensor on the torso, the largest strap will not be sufficient.
In discussions with Jem Arnold @UBC during the preparation of this review, he highlighted that day-to-day variability for one athlete could be 5-10% SmO2 with another technology. This implies a notable degree of uncertainty around repeatability, making it challenging to rely on a given SmO2 level as a pacing target. It’s unclear if the same variability applies to Train.Red – thank you, Jem!, he authored a paper on Muscle Oxygen, albeit with competing technology.
Other Things you can try or should know
- Breathing – this might sound stupid! If you focus on breathing, then oxygenation can increase. It does for me. So long as you are not in an athletically stressed state, breathing in with two breaths and out with one long breath impacts stroke volume, NO, HRV and SmO2. Who would have thought breathing was good for you? 😉 The point here is that you might benefit from actively moving away from your body’s default learnt breathing behaviour, or at least consider some alternatives. With Train.Red you can see within a few 10s of seconds if it makes any difference.
- Getting off the saddle – Other things equal, you should find that short periods of riding out of the saddle boost SmO2. Perhaps blood flow is improved or perhaps the muscle you are measuring is being partially relieved by other muscle groups taking the strain in your new position.
- Calibration with Train.Red involves an app prompt, but there’s an alternative calibration method involving an occlusion. By using a band to temporarily restrict blood flow to the muscle where the sensor is placed, you aim for SmO2 to decrease to a minimum during the occlusion. Comparing these minimums with readings from other sensors or workouts on different days allows for better comparisons.
- Physiological occlusions – some cyclists’ physiology adversely affects blood flow in certain positions, as, say, the hip bones could restrict flow in certain riding positions eg TT. You can perform tests to check for this.
- Demographics – Moxy is reliable on young, fit men (Source: Jem Arnold). Less so with other demographics. I don’t know if the same holds for Train.Red.
What’s Missing
As an endurance athlete, I want better guidance from Train.Red in the Garmin and Wahoo environments. As a minimum, I want coloured Muscle State information in real time.
I have some of Moxy’s apparel, which has a pocket and a shield to ensure the product is placed consistently from one day to the next, AND that light is excluded. Similar apparel from Train.Red would be great and would add the opportunity for the brand to boost revenues…WHOOP apparel is similar.
Take Out
I felt a bit disheartened when Humon Hex shut down. While I wasn’t a daily user of SmO2, I did use it occasionally, and it still sits on my desk as I write this. Hex had a solid ecosystem for endurance athletes, covering both the smartphone app and Garmin data fields. Train.Red has reignited my interest in SmO2 sensors, particularly for warm-ups and optimising rest periods between intervals. For context on how SmO2 sensors fit within the broader recovery tracker and lifestyle band category, including Whoop’s April 2026 NIRS patent and Garmin’s Muscle Battery trademark, see our complete guide.
I continue to use it periodically for endurance runs and rides. However, Train.Red needs to enhance its rather basic Garmin data field. The smartphone app, while generally good, could also see improvements for in-workout usage. The product is certainly usable today, and I have faith in the sensor’s quality. That said, it might involve a bit of “blind faith” as I haven’t found a way to conclusively prove the data’s accuracy. I rely on trust in others and the fact that the sensor comes from the same people behind the PORTAMON Gold Standard Lab product (Artinis).
Now, let’s talk about the repeatability of the data. Wearing it in the same place from one workout to the next isn’t as straightforward as you might think. Even if you manage to do that, there’s likely to be variability from one day to the next. While there’s a calibration mechanism on the app, the challenge arises on race day when I’m not carrying a phone. Additionally, the gym crowd faces the choice of repositioning the sensor multiple times in one workout on various muscle groups or investing in multiple sensors.
The CrossFit and HYROX community has embraced this technology, arguably more enthusiastically than endurance athletes. As a sports data geek, I’m naturally inclined to want to use this kind of tech. However, I’m not entirely convinced that there are many other endurance athletes with the same trait, especially given the hefty price tag.
Quick answers
What is the difference between Train.Red FYER and PLUS?
The FYER is the entry point and the PLUS is the lab-grade option. Both sensors share the same Train.Red app, the same Muscle States system, and the same connectivity over BLE and ANT+. The PLUS measures deeper into the muscle, up to 25mm against 20mm on the FYER, with six channels for spatial coverage rather than the FYER’s single channel of 64 micro channels. The PLUS reports at 100Hz against the FYER’s 10Hz, and adds haptic feedback on the device itself. The FYER 2.0 is now waterproof to IPX7 with the supplied plug, while the PLUS remains sweatproof only. Both 2.0 sensors include an IMU, onboard storage for over 1,000 hours of offline recording, and the ability to broadcast to a phone alongside ten or more other sensors. The FYER suits committed athletes and coaches who want serious data without lab pricing. The PLUS targets exercise labs, education, and professional coaches who need the deeper measurement and faster sampling rate.
How does Train.Red FYER compare to Moxy?
Moxy reports absolute SmO2 derived from a Monte Carlo adipose correction model. Train.Red reports TSI, the relative concentration change of tissue oxygenation. The two readings track in parallel during exercise but the absolute numbers differ, so they cannot be compared like for like. Train.Red emits at 850nm and penetrates more deeply, with Train.Red claiming up to 30mm in their technical literature. Moxy uses 680, 720, 760, and 800nm wavelengths and samples at over 1,000Hz internally while reporting at 0.5, 1, or 2Hz. The FYER reports at 10Hz, giving smoother on-screen traces. Moxy has the longer scientific publication history. Train.Red uses the same Artinis sensor technology as the PORTAMON lab standard, which gives it strong technical credibility even without Moxy’s depth of independent validation.
Does Train.Red work with Garmin?
Yes. Train.Red broadcasts SmO2% over the standard ANT+ muscle oxygen profile, which any Garmin Edge or watch with a sensor pairing option can read. Train.Red also supplies Connect IQ data fields that show the sensor placement, the SmO2 figure, and a recent trend line. The data field route is the better choice when you want to record more than one sensor at once. The current limitation is that only the SmO2% figure is exposed through this path. The richer Muscle States, Muscle Stress Score, and recovery analysis remain inside the Train.Red app.
Does Train.Red work with Wahoo?
Yes, over ANT+. A Wahoo ELEMNT will pair to Train.Red as a muscle oxygen sensor and display SmO2% in real time. The FIT file records only the SmO2% value. Anything richer than that, including Muscle States and the Smart Rest analysis, requires the Train.Red app.
Can I use Train.Red without a phone?
Yes, on the 2.0 generation. Both the FYER 2.0 and the PLUS 2.0 record offline to onboard storage with capacity for more than 1,000 hours of data. The 1.0 generation sensors require a connected phone or compatible head unit to record. The offline mode matters for race day, for outdoor sessions where a phone is impractical, and for gym sessions where you would rather not carry one.
How accurate is Train.Red?
The sensor hardware comes from Artinis, the same company that makes the PORTAMON laboratory NIRS device. PORTAMON has been the subject of peer-reviewed validation work over many years. Train.Red itself has fewer published independent validation studies than Moxy. Day-to-day repeatability in NIRS sensors is constrained by sensor placement, ambient light exposure, skin pigmentation, and adipose tissue thickness. Research on competing sensors has shown day-to-day variability of 5 to 10 percentage points of SmO2 even with consistent placement. Treat absolute SmO2 figures with caution and place more weight on trends within a session.
How long does the Train.Red FYER battery last?
Train.Red rates the FYER 2.0 at up to 20 hours of active use and the PLUS 2.0 at up to 18 hours. Both charge over USB-C. A full charging cycle resets the sensor.
What is muscle oxygen and why does it matter?
Muscle oxygen, written SmO2, is the percentage of oxygenated haemoglobin in the muscle. It is not the same as SpO2, which measures oxygenation in arterial blood. SmO2 reflects the local balance between oxygen delivery to a specific muscle and that muscle’s oxygen consumption. The figure rises when delivery exceeds demand, as during recovery, and falls when demand outstrips delivery, as during a hard interval. The metric is useful for verifying that a warm-up has actually warmed the working muscle, for spacing intervals by physiological recovery rather than the clock, and for identifying the SmO2 second breakpoint that corresponds broadly to lactate threshold.
Is Train.Red useful for HYROX and CrossFit?
HYROX and CrossFit athletes have adopted Train.Red more enthusiastically than the endurance community. The format suits muscle oxygen monitoring because each station hammers a specific muscle group and recovery between stations is short. SmO2 gives a direct read on whether a target muscle has cleared enough during the run leg to attack the next station effectively, which is information that heart rate alone does not provide. The Smart Rest feature is particularly relevant for gym-based functional fitness training, where the optimal rest between sets depends on the goal, whether strength, hypertrophy, or endurance. The practical constraint for HYROX use is sensor placement across multiple muscle groups, which either requires repositioning during the warm-up or investing in more than one sensor.
Is Train.Red worth the price for endurance athletes?
The honest answer depends on whether you already train with structure. If you train by feel or by heart rate alone, the marginal value of SmO2 is limited and the price is hard to justify. If you already train with power, structured intervals, and a clear physiological framework, Train.Red adds a measured recovery dimension that power and heart rate cannot supply. The case is strongest for warm-up verification, for interval pacing where recovery between reps drives training quality, and for long endurance efforts where progressive heart rate drift makes HR unreliable as a pacing input.
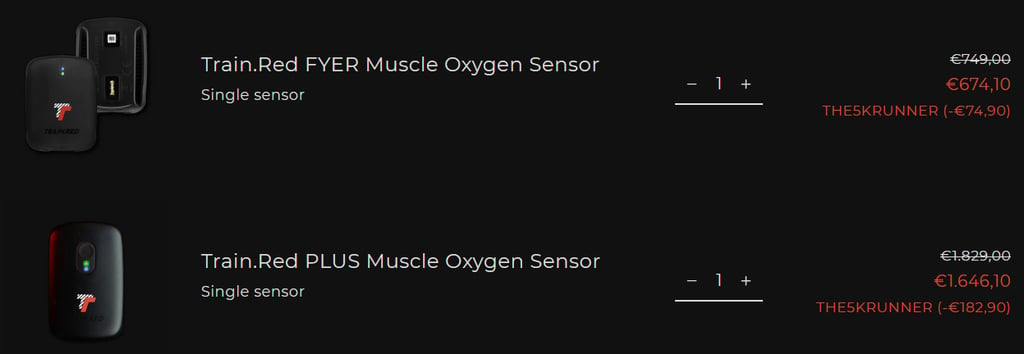
Train.Red Products
10% Train.Red discount automatically applied to any sensor at checkout with code THE5KRUNNER at this link https://the5krunner.com/Train.Red
- Train.Red FYER 2.0: from €699, 10Hz reporting, IMU, IPX7 waterproof with plug, onboard storage
- Train.Red PLUS 2.0: from €1,799, 100Hz reporting, six channels, IMU, haptic feedback, onboard storage
- Set of 4 FYER 2.0: from €2,650 (regular €2,799)
- Set of 4 PLUS 2.0: from €6,850 (regular €7,199)
This post is part of the Apple Watch guide for endurance sport on this site, which covers the full lineup, watchOS, accuracy data, the medical roadmap, and the complete set of articles.
This article is part of the site’s sports science reference for endurance athletes.
Last Updated on 28 June 2026 by the5krunner
My favourite kit and nutrition
- Injinji – Runners protect your toes. Avoid discomfort and minor injury. Run more. run faster. I use them.
- Garmin 90-degree charging adapter — the small adapter that keeps your charging cables tidy. Essential for race day. I use one.
- Garmin charging puck — the fastest and most reliable way to top up your Garmin before a session. I use one.
- Ravemen FR300 — front light that mounts directly under your Garmin or Wahoo head unit. Keeps your bars clean and your beam pointed where it matters. I use one.
- Body Glide – The Blue anti-chafe stick that all swimmers and many runners use. I use it.
- Maurten — the race nutrition trusted by elite athletes. Gels and drink mix engineered to be easy on the stomach. I use them.
- Garmin Varia RTL515 — radar rear light that alerts you to vehicles approaching from behind. Pairs with your Edge or Garmin watch. I use this model.
- Favero Assioma Pro RS2 — the power meter pedals most serious cyclists end up choosing. Accurate, easy to move between bikes. I use this model.
Reader-Powered Content

This content is not sponsored. It’s mostly me behind the labour of love, which is this site, and I appreciate everyone who supports it.
Support the site: Follow (free, fewer ads) · Subscribe (paid, ad-free) · Buy Me A Coffee ❤️
All articles are written by real people, fact-checked, and verified for originality. See the Editorial Policy. FTC: Affiliate Disclosure — some links pay commission. As an Amazon Associate, I earn from qualifying purchases.

tfk is the founder and author of the5krunner, an independent endurance sports technology publication. With 20 years of hands-on testing of GPS watches and wearables, and competing in triathlons at an international age-group level, tfk provides in-depth expert analysis of fitness technology for serious athletes and endurance sport competitors. ID
