Wahoo’s New Dimensional Training Metrics (DTL, LTL, TC) Explained: Beyond FTP
Wahoo has fundamentally changed how its cyclists can track, analyse, and understand their training with the release of a sophisticated new suite of Fitness Metrics. Moving past simpler, single-focus models like those based purely on Functional Threshold Power (FTP), this system claims to provide a multi-dimensional view of training impact, readiness, and capacity.
This in-depth analysis is rooted in Wahoo’s proprietary Four-Dimensional Power (4DP) model, using advanced algorithms to measure not just how much you ride, but how you ride and how those different efforts contribute to various aspects of your cycling fitness. This is the comprehensive guide to understanding Wahoo’s new data if you want a more personalised and accurate picture of your fitness journey.
TL;DR (Simplified) – The Old TSB(TSS)/CTL/ATL model based on FTP/CP is updated to include multiple critical power signals at different durations with differing decay properties.
Dimensional Training Load (DTL): The Core Measurement
The foundational metric in Wahoo’s new system is Dimensional Training Load (DTL). Unlike static scores (like the widely used Training Stress Score – TSS), DTL is a composite, dynamic score that reflects the total physiological impact of a ride relative to your current capacity.
How DTL is Calculated
The calculation of DTL is highly personalised and comprehensive:
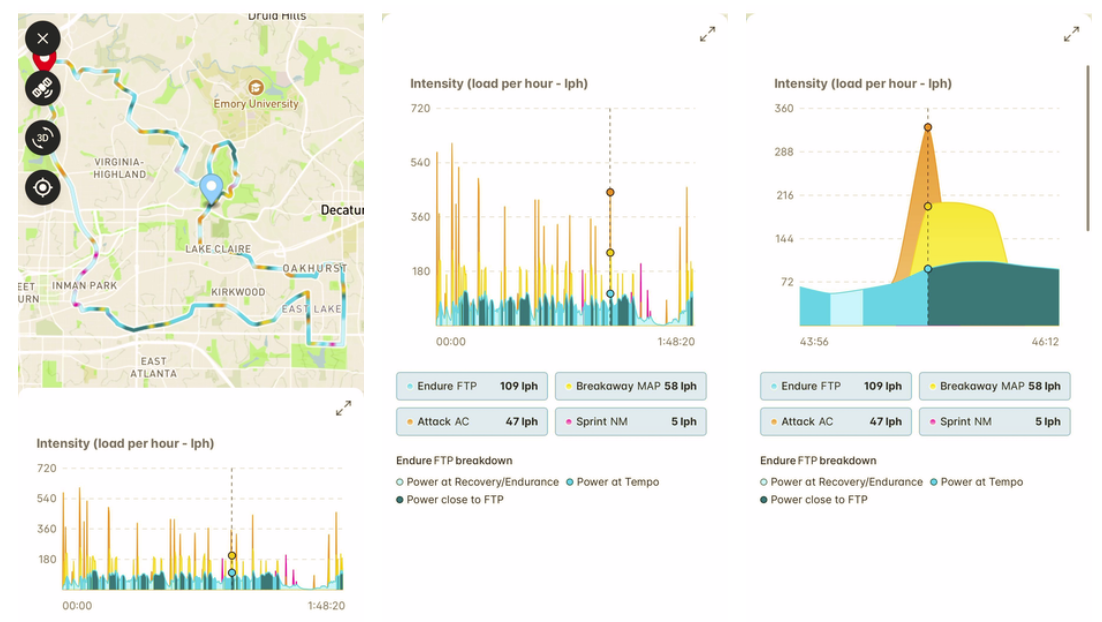
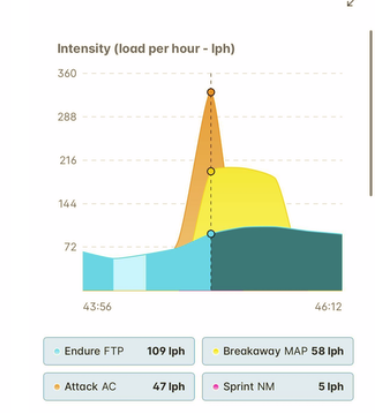
- References Your 4DP Profile: The Wahoo Cloud uses your established 4DP Athlete Profile to analyse your ride’s power, time, and cadence data.
- Analyses Four Dimensions: It breaks down the ride’s efforts across the four physiological dimensions of 4DP:
- FTP (Endure): Your sustained power for long periods.
- MAP (Breakaway): Your maximal aerobic power (MAP) for moderate-length hard efforts.
- AC (Attack): For short, powerful efforts, your anaerobic capacity (AC).
- NM (Sprint): Your neuromuscular (NM) power for maximum sprints.
- Weights “Load Contributors”: Instead of a simple “time-in-zone” approach, DTL identifies specific “load contributors” like hard sustained efforts, super high cadence, or power spikes. High-intensity efforts are weighted more heavily than steady-state efforts, even shorter ones, to accurately reflect their true impact on fatigue and fitness building.
- Multi-System Contribution: A key feature is that a single effort can contribute simultaneously to multiple physiological systems (e.g., FTP, MAP, and AC), providing a far more accurate measure of training stress.
The total DTL score for a ride is the sum of these contributors, aggregated within their respective 4DP dimensions. Because DTL is relative to your personal capacity, it provides a much more meaningful gauge of training stress than comparative values.
Tracking Training Stress Over Time: STL and LTL
DTL values are aggregated to provide a long-term context of accumulated training stress and adaptation. These metrics are crucial for preventing overtraining and maximising gains.
Short Term Load (STL)
Short Term Load (STL) is the average training load accumulated over about a week.
- It’s designed to reflect your current level of short-term fatigue.
- The weighting is calibrated to show that high-intensity DTL (MAP/AC efforts) causes fatigue faster than steady-state (FTP) DTL.
- An increase in STL over a few weeks indicates a build phase, while a decrease signals a recovery phase.
Long Term Load (LTL)
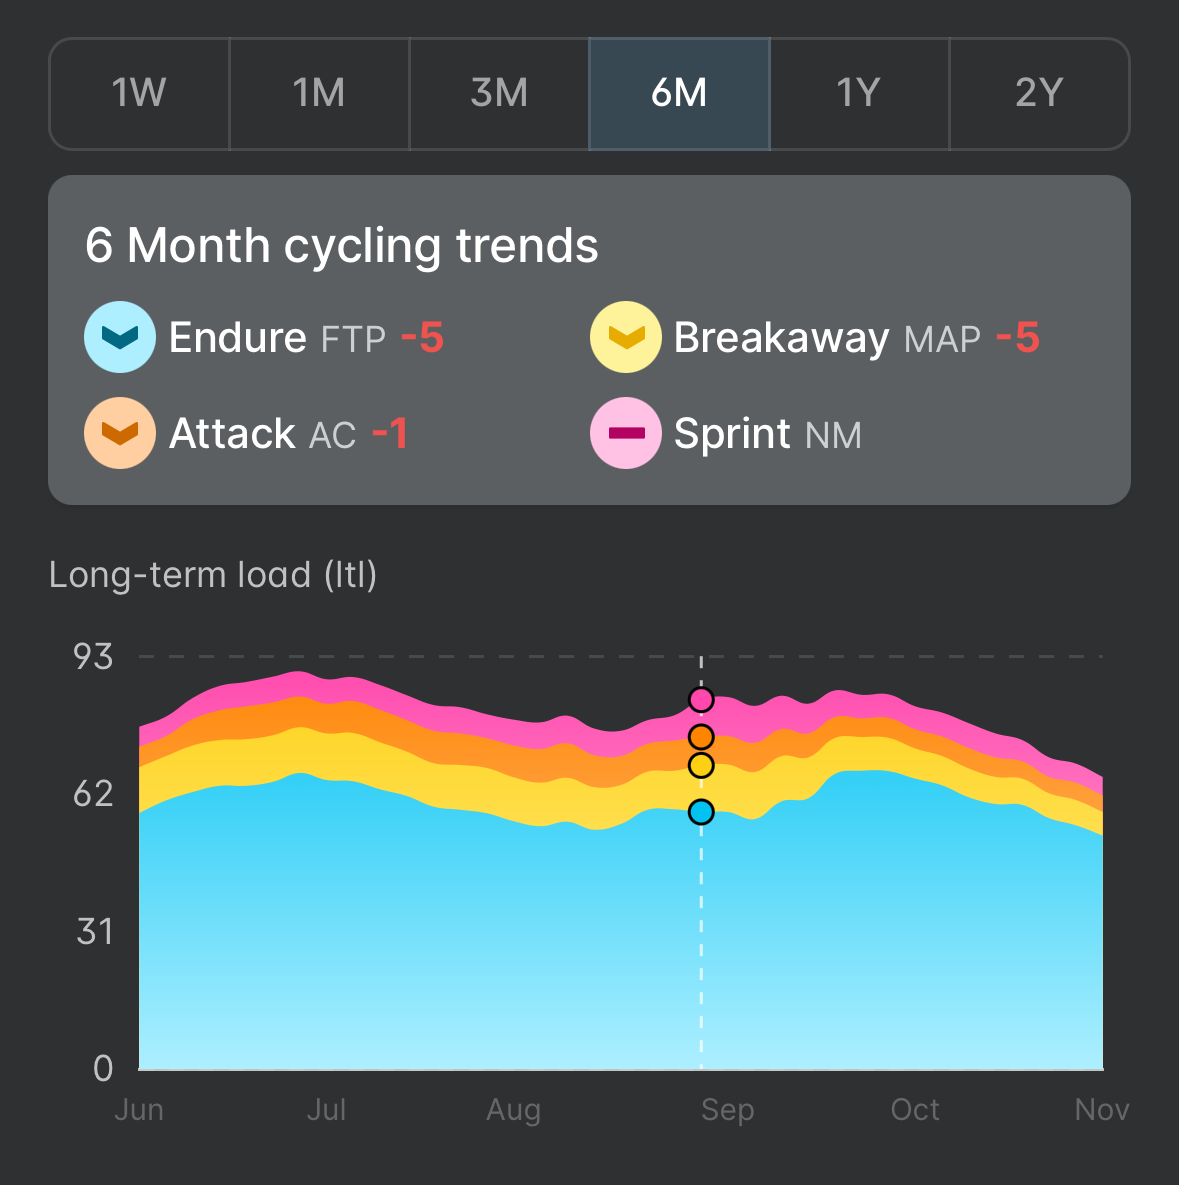
Long Term Load (LTL) provides the long-term perspective—a rolling average of DTL over several months. This is your baseline fitness and capacity to train.
- A higher LTL indicates a sustained and consistent training volume, suggesting you can safely handle greater short-term loads.
- LTL calculation is nuanced: it accounts for the differences in how quickly fitness gains decay across the 4DP dimensions. Endurance (FTP) gains linger longest, while higher-intensity gains fade more quickly without consistent training.
- It requires about 90 days of regular training data to stabilise and accurately reflect your baseline fitness.
The “Cycling Trends” data visualisation within the Wahoo ecosystem presents a breakdown of the composite LTL across the four 4DP dimensions, allowing you to track the ebb and flow of your strengths.
Assessing Readiness and Overall Fitness: TC and Fitness Score
These two metrics use the load data (DTL, STL, LTL) to provide context around your performance, answering the critical question: Am I ready to train or race?
Training Capacity (TC)
Training Capacity (TC) represents your immediate readiness for competition or continued hard training.
- TC is calculated as the Short Term Load (STL) ratio relative to Long Term Load (LTL).
- It’s displayed on a spectrum ranging from Rested to Fatigued.
- Negative TC (STL > LTL): You are accumulating more training stress recently than your baseline fitness suggests. This is required for building fitness, but leads to fatigue. A negative TC for 2-3 weeks promotes fitness gains.
- Positive TC (LTL > STL): Your recent training has been lighter, allowing for recovery and adaptation. This is when you are “peaking” and most ready for a top-level performance.
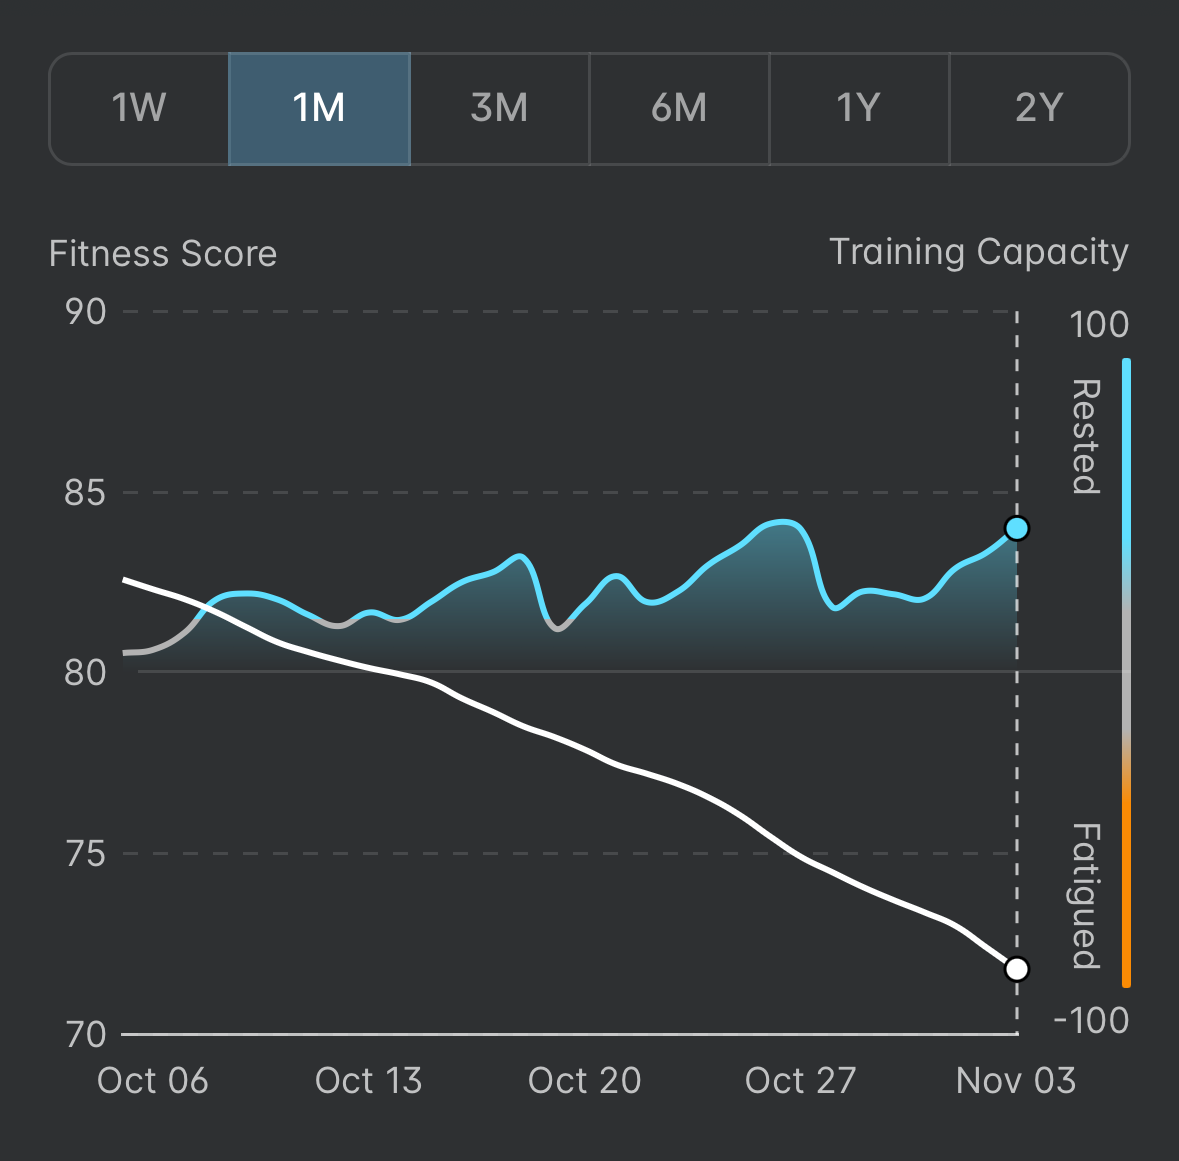
Fitness Score
The Fitness Score measures your overall fitness level by combining the long-term work you’ve put in (LTL) with your immediate readiness (TC).
- Unlike older models that only rewarded accumulating load, the Wahoo Fitness Score incorporates the benefits of proper recovery (via TC).
- The system recognises peak fitness, which is achieved when a rider is strong (high LTL) and well-rested (positive TC).
Requirements for Accessing Dimensional Analysis
To get Wahoo’s dimensional training analysis working you need to have the following three things in place:
1. Subscription Status
Your subscription status affects how much of the DTL ecosystem you can see.
- Full Access: Access to the full suite of metrics, data visualisations, and detailed dimensional analysis needs either a subscription or an active trial.
- Limited Access: Non-subscribers can still view a DTL summary and the overall Training Progress panels.
2. Data Quality
- Cycling activities must contain power and cadence data to receive dimensional training analysis. These can be recorded on an ELEMNT computer, the Wahoo or SYSTM apps, or synced from third-party services like Zwift or Strava.
- Activities without power/cadence (e.g., running, swimming, or cycling without a power meter) will generate an estimated total DTL based on duration and your “Post Session Rating” (PSR). However, because dimensional analysis isn’t possible, their training impact is applied solely as Endure (FTP) DTL values. This may over- or underestimate the actual training load.
3. Athlete Profile
- A 4DP Athlete Profile must be established in the Wahoo app. This is optimally generated by completing the Full Frontal or Half Monty fitness assessments within the SYSTM app, as this provides the most accurate and up-to-date baseline for your four physiological dimensions.
Thoughts
This approach seems similar to XERT’s, albeit from a different perspective. Xert’s take on my cycling data has always felt the most accurate of all the models I use.
To me, DTL/4DP feels like a correct way of adequately accounting for the load types and their implications. I understand it is based on accepted principles but not backed holistically by published scientific research (Partially, here: DOI:10.1249/01.mss.0000986472.92100.40 )
Once the core calculations work correctly, other interesting analyses are available in the app. For example, individual rides show colour-coded intensity shading over your route, and other charts show how the loads accumulate/decay.
So, this is a significant and welcome step forward for Wahoo, and if you see the kinds of Garmin CIQ apps and insights that Xert has developed over the years (e.g Durability, Magic Buckets), you’ll understand that Wahoo can also add much more.
More: Wahoo
the5krunner.com © 2010-2025

Reader-Powered Content
 This content is not sponsored. It’s mostly me behind the labour of love, which is this site, and I appreciate everyone who follows, subscribes or Buys Me A Coffee ❤️ Alternatively, please buy the reviewed product from my partners. Thank you! FTC: Affiliate Disclosure: Links pay commission. As an Amazon Associate, I earn from qualifying purchases.
![]()
