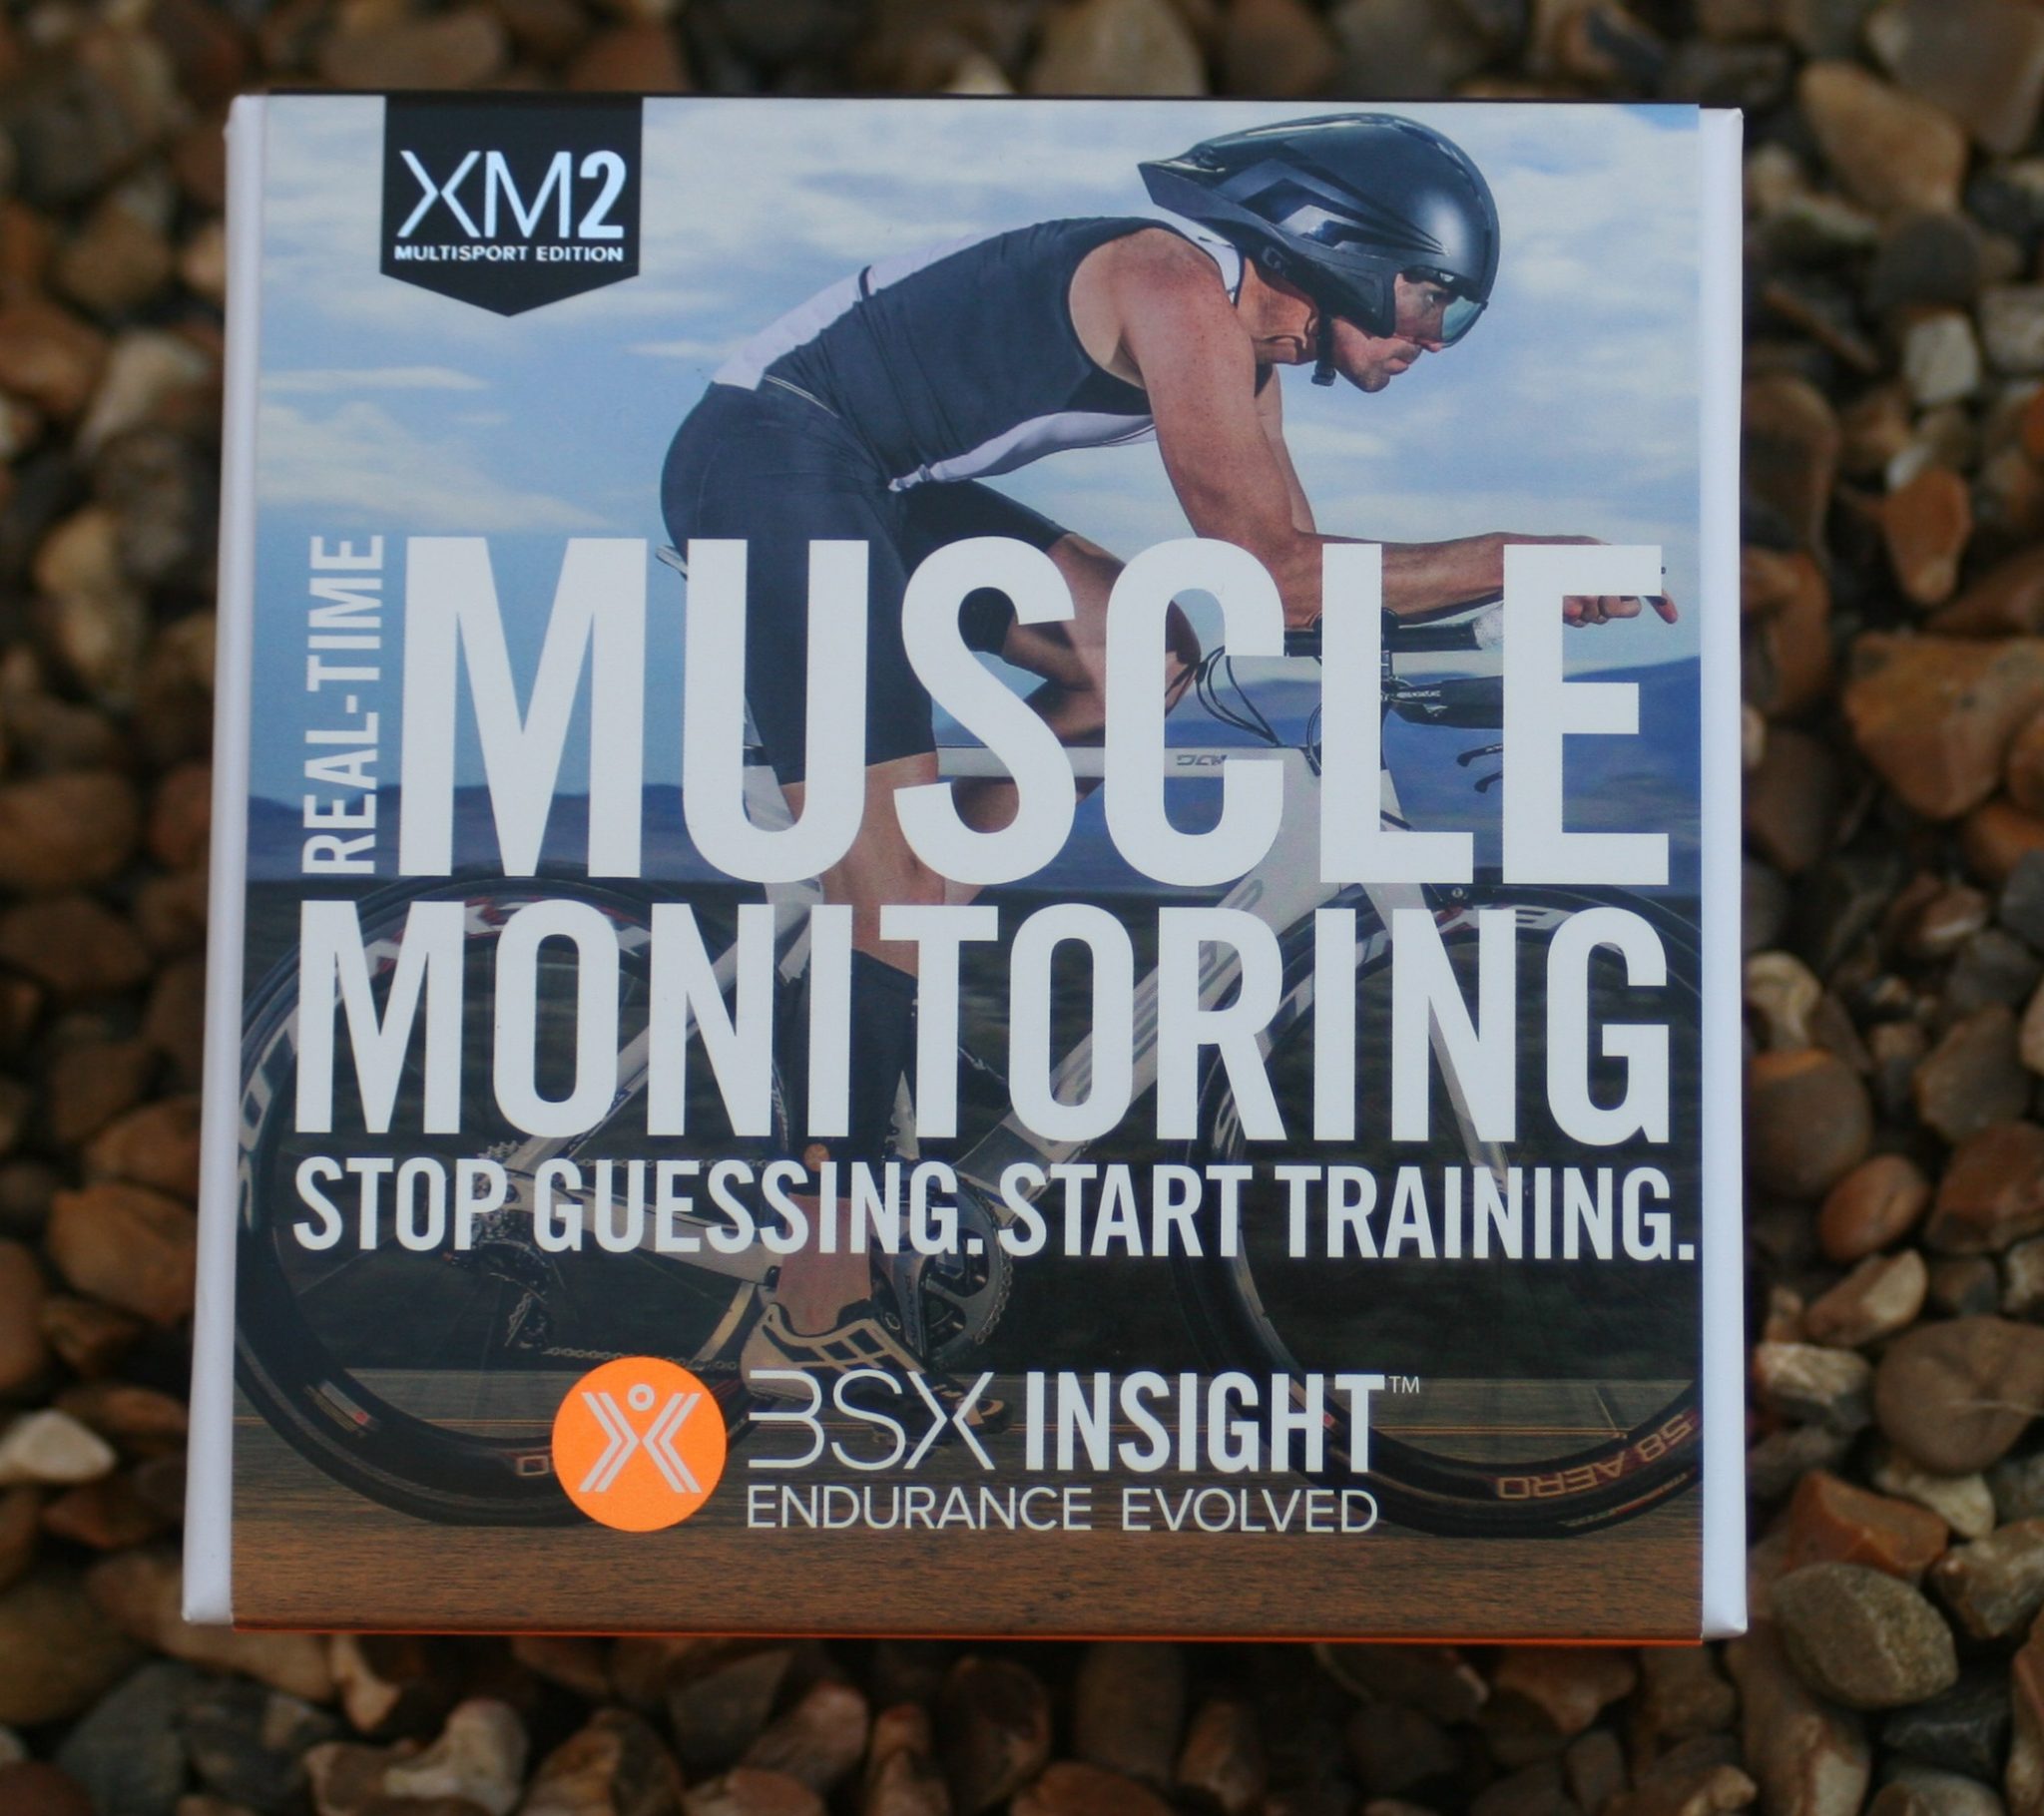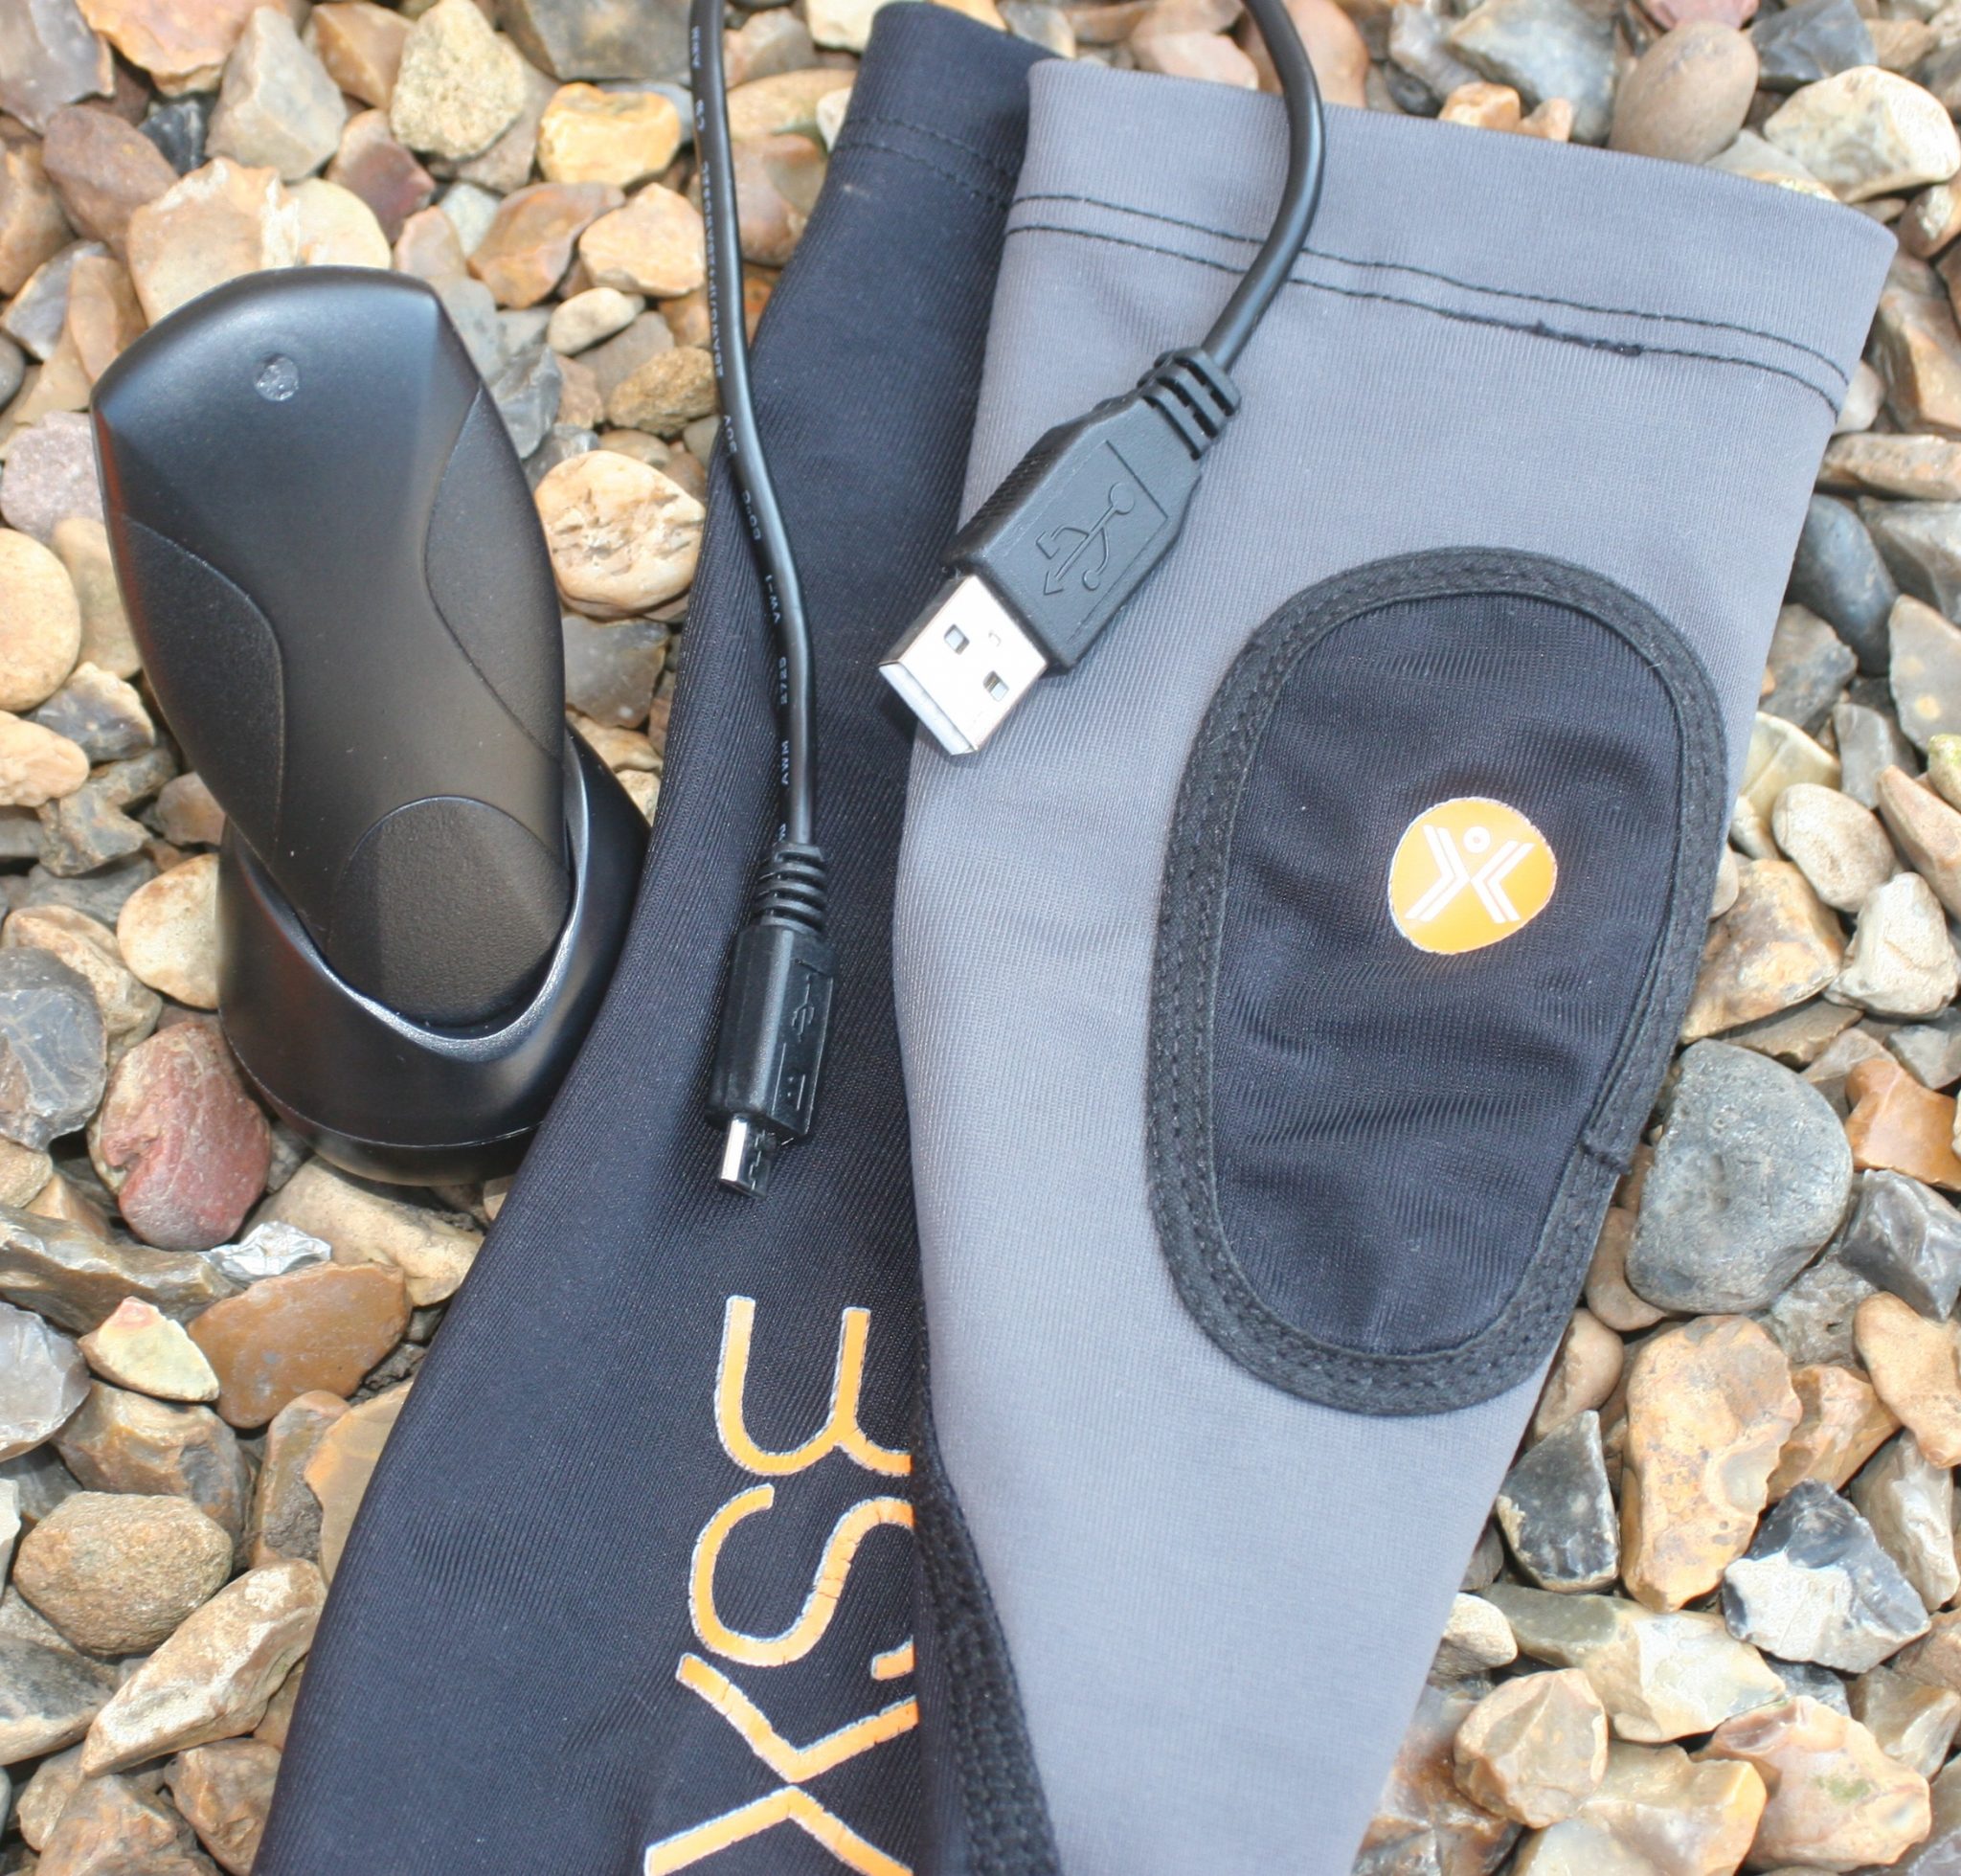
This post is initially heavy on unboxing, contents, setting up and a few thoughts on some of my first uses of it.
Essentially it will provide a reference link for a more detailed and hopefully entertaining look at muscle oxygen data use at a later date.
What Is It?
This is the Second Generation device for triathletes (XM2). You can loan it to your club mates to help them assess their SmO2 and tHb, unlike the first version it is NOT linked to your account.

Box & Contents
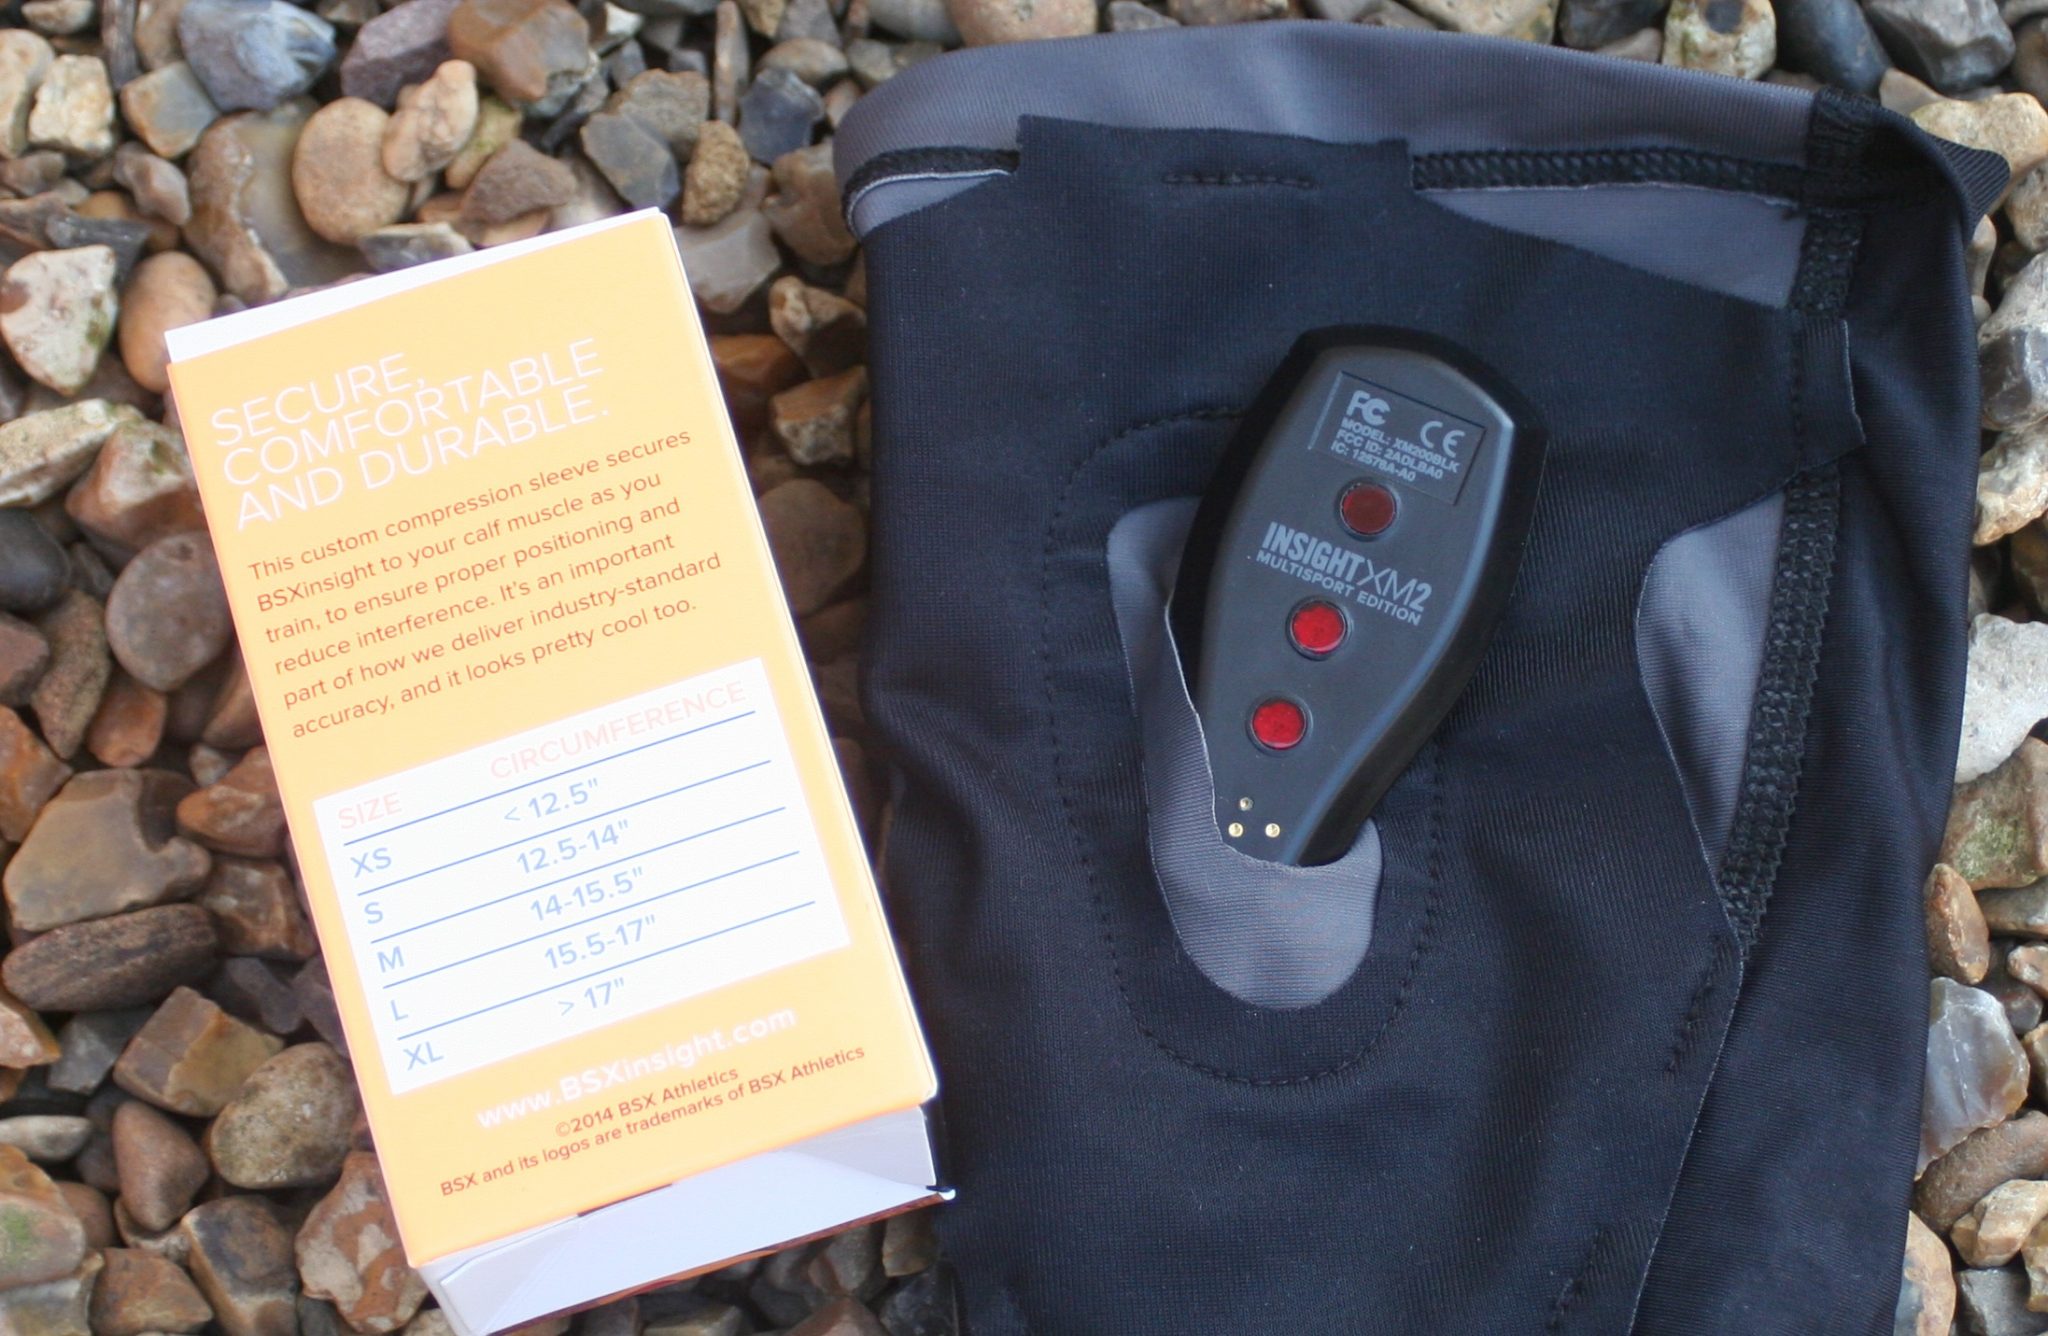
It’s well presented. There’s quite a lot of packaging. Presumably it’s been thought through to support the various flavours of the device (run, bike and multisport) which each require a different card sleeve outer. Similarly the little box that’s inside contains a calf compression sleeve – they come in various sizes.
Here’s what you will get some variation of


The device


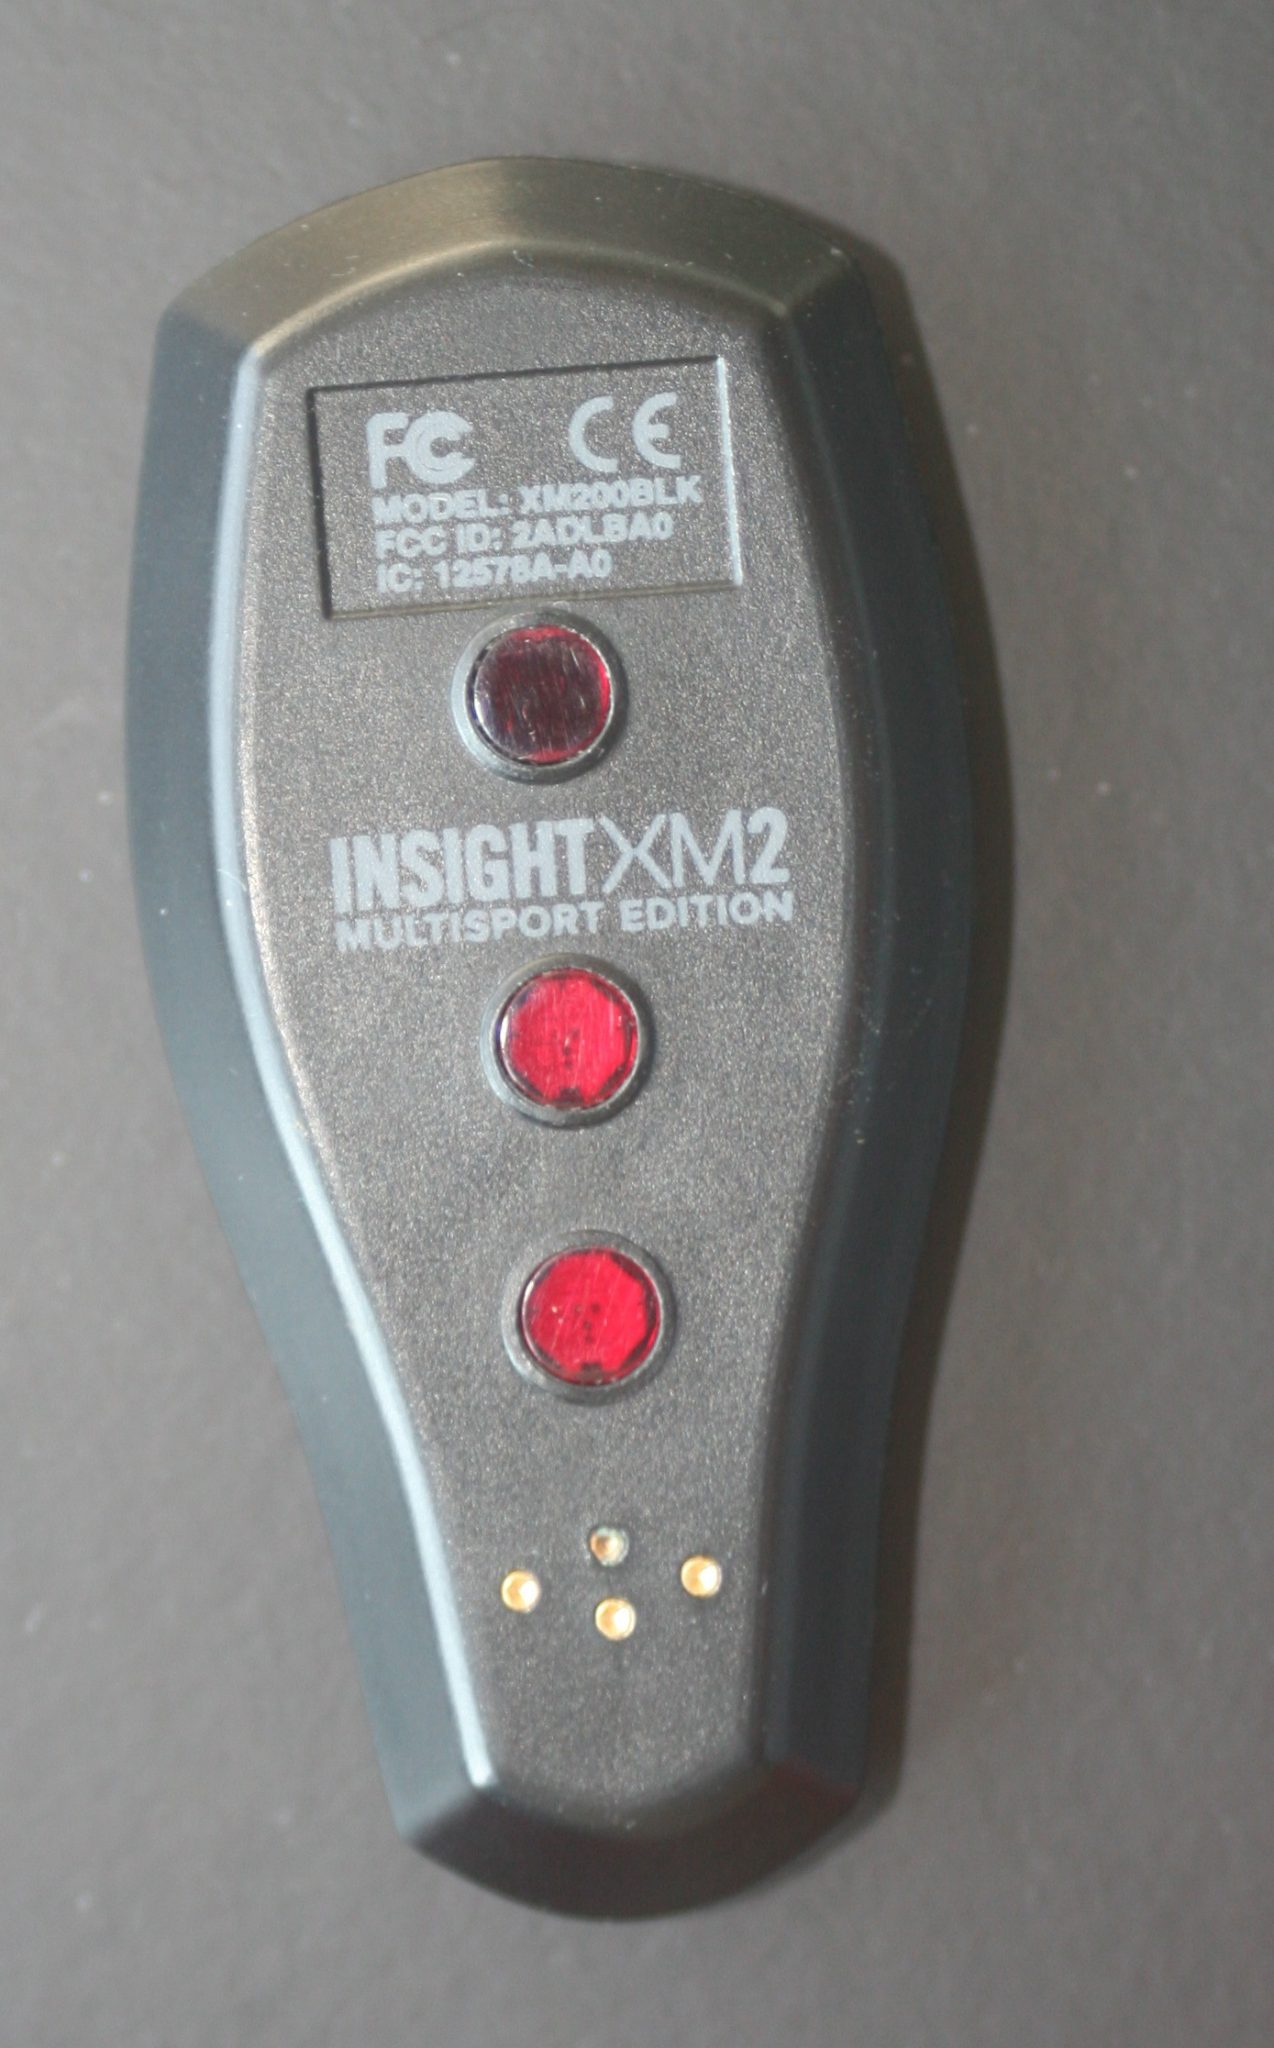
The LED and receivers do their thing. It’s largely irrelevant to a user as all of them must be in contact with your skin and inside the sleeve.
The only other relevant bit about the rear is that rarely you might have to hard reset the device by waving a magnet above the phrase “INSIGHT XM2”. Normally just placing it in the charger effectively reboots it without losing data.
It’s quite a small unit and here you can see it next to a 920XT with the front blue LED. A flashing blue is charging and a solid blue is charged and in the cradle. For purple and red then it’s doing resets or firmware stuff. And a green LED is good to go.


As well as being small (8cm x 4xm x 1.5cm) it’s super light at 20g.
When it’s charged up, you will need turn it on so that it can pair. You need to tap it or take it off the charging cradle.
Pairing and Linking
The BSX Insight can pair with a lot of device types. The issue to be aware of is that SmO2 and tHb ‘data types’ are in a state of flux in the ANT+ standards world. So you may well be able to VIEW the data on your DEVICE but are unable to SAVE the data into a FIT file.
A further problem is that some devices will not support muscle oxygen sensors at all. Cleverly, BSX can take over one of the other data fields on those devices. For example, SmO2 may well show on a Garmin 910XT as speed/cadence when cycling or as a footpod when running. There is no SmO2 field available on the 910.
This was the same approach adopted by STRYD with the power running product. “Channel Hijacking” is as good a phrase as any. If ‘fault’ needs to be attributed somewhere on this issue it would be with the watch/device vendor rather than BSX. I’m not really sure what other alternatives BSX had but having SmO2 showing as cadence or some other measure is just plain annoying and requires lots of fiddling about later with data files. I just haven’t got the time for that for my sporting endeavours, other than for reviews. Of course it may well be an ideal compromise for you.
People who may want/need to look at SmO2 data are going to be MORE serious than the average athlete. Most likely, many will have access to the other ways of ‘correctly’ linking to the BSX and avoiding ‘channel hijacking’ such as these:
- Golden Cheetah (free): Has a view for the live recording of ANT+ data through a computer’s USB ANT+ stick
- Garmin Edge 520 and WAHOO ELEMNT can display this data and should imminently be able to save it to a FIT file – Edit: WAHOO can!
- Garmin IQ Connect – Garmin’s app store has mini apps that reside on your watch enabling you to view the SmO2 and tHb data but not yet record them.
- BSX have an app that works on iOS and some relatively recent versions of Android. The app and/or device sync to BSX’s online platform and from there .CSV files can be exported (March 2016 SmO2 only) and reimported into other products. I only managed to get this to work going into Golden Cheetah.
- Sporttracks has the required data fields in it. I just don’t know how to get the data into those fields with BSX. No-one else seems to either.
I don’t want to dwell on the channel hijacking method of pairing too much. Suffice it to say that it’s as easy as pairing any other ANT+ sensor. If the running cadence channel has, for example, been hijacked then your device should prompt you to choose a sensor if a real running cadence sensor is also present (if you’re lucky). Otherwise you will have to specifically ensure the sensor is paired as the only one of its type.
Wearing It
Ease-of-wear is generally GOOD for athletes in the field.
There is a calf compression sleeve that, ahem, fits over your calf. Of course, you could put them anywhere you want where you get a good fit – your forearm or skinny thighs for example.
It would seem most sensible that for running you measure on your calf and for cycling on your quads. Of course in both of those cases other muscle groups are involved as well.
BSX would point out that the calf is a good proxy for your entire running muscular activity. And, indeed, that it is a good proxy for cycling too. Maybe.
Others may well disagree and also point out that your left side and right side might be different.
If you plan to do 6-weekly lactate threshold tests then all of the above is probably mostly irrelevant. You just use it in the same place, in the same way, each time.
If you are a sports scientist or an elite coach then you may very well be concerned with these details and need multiple sensors in multiple locations.
Of course the great thing with wearing it in a sleeve is that you are not fixed by wires to a machine.
I got the small size. I think pre-worn by Sweaty Adam at BSX (only joking, 🙂 thanks Adam!). I would say that it seemed to come out a little bigger than I expected. So when choosing your size err on the small- and tight-side otherwise you might have to wear an additional compression sleeve to stop it slipping down.
It’s best to put the device into the sleeve after you have the sleeve at least over your heel.


Turning The Device On
Turning On/Off: Not so Simple
This is not as easy as you would think.
Tap it a bit to activate it.
You MUST then connect to the app to start recording. Even if you leave the app at home when you then run/bike with the data displaying on your watch.
BSX are working on watch-based activation through Garmin Connect IQ app. This exists and apparently is working but not yet released (Source: BSX)
Furthermore there needs to be an internet connection when you turn it on. So in a car park at the start of a race you might have to create an impromptu mobile hotspot on your smartphone to mobile data or find a friendly, open wifi network. For my last HM I did not have that option…no SMO2 data :-(.
When you get back and want to stop recording you must either stop it via the app or put it in the charging cradle, with the computer turned on.
This is all a bit too complicated. It needs to work like a caching HR strap and start recording when put into contact with the skin. Sounds simple, I know, but it is harder to implement than it sounds.
Unless you are WAHOO. The WAHOO ELEMNT works properly and in the start/stop respect.
Keeping It On – Battery Life
Battery life was always sufficient for my needs and was officially stated as 8 hours. However the battery slowly discharges even when not in use and not on the cradle. So you need to keep it in the cradle until you are ready to exercise.
Lactate Threshold Tests – Bike and Run
These can be super important if you train by heart rate. In my opinion, despite its flaws, training by HR Zones has it’s place for efforts from 15 minutes to an hour and 15 minutes. HR zones based on HRmax/HRrest/HRmin are often plain wrong. Determining zones from your LTHR (LT2) is a great idea. Again, there’s problems and flaws but it’s good enough for most of us, most of the time.
The biggest problems are trusting yourself to properly perform a LTHR test and/or regularly paying for a fairly expensive lab test.
BSX let’s you do it yourself. From my limited experience the results were quite plausible. I’d certainly trust it to get it ‘about right’…give or take a beat or two. And that’s accurate enough. Even lab test results could be different the next day.
Ok here’s my bike test result of 159bpm (image below). I reckon it should be a couple of beats higher but I don’t KNOW that for sure. I do know that I did a RUNNING Half Marathon 3 days earlier and my HRavg for that was 164 (same as my earlier lab tested LTHR). So let’s say my LTHRrun was a bit higher at 165/6 that would often translate to a LTHRbike in the very low 160s…yep, or about 159bpm as the BSX found! (162 when I last had it lab tested).


I would also point out that I controlled my own power output with a constant resistance on my trainer.
You also get your FTP and power based training zones from the same test. Obviously you need a power meter.
In the bike test I felt I very slightly underperformed. My FTP was 2w lower than mFTP from 6 months of Golden Cheetah data. That’s good enough for me.
Also: 5w lower than when last formally lab tested.
There you go. No more CP20/CP30s needed. Just do your BSX test or put all your data in Golden Cheetah. Finally you have an excuse to avoid those particular versions of discomfort and pain (maybe!).
The run tests are essentially the same and you will likely get a different LTHR and associated HR zones for running. You will also get pace zones.
The running test is best done on a treadmill. I only do treadmills when it is snowing and not always then. If you are reasonably good at controlling your pace you would get some sort of result on open flat ground. I haven’t tried either yet.
Day-to-day usage
One of the great things with the BSX is that you can just stick it on just as you would do a HR strap. I wear a HR strap every time I exercise but do I analyse the HR data afterwards EVERY time? No, of course not.
The BSX Insight is just about Ok to use daily. Wearing is easy; turning on/off, less so. Analysing, kind of.
If something unexpected happens on your run/ride you have the ability to look at muscle oxygen data afterwards, maybe for further insight.
Fair enough; ad-hoc usage – it is more than fine for that purpose.
Instead though, you could spent a little more time and effort to delve into these potentially useful avenues of usage for muscle oxygen data. I’ll maybe cover them in another post at some point:
- Optimise Workout duration/Intensity – perhaps helping you to also curtail an unproductive training session
- Optimise Intra-Interval Recovery – quantify your recovery before you start the next interval
- Quantify your warm up
- Optimise Cadence – look at effects of muscle oxygen at same power levels but varying cadence. You could do the same sort of thing to look at positional changes.
- Racing – is there much left I the tank?
A teaser…
Consider: What is good, HIGH SM02 or low SMO2?
A thought: A partial and superficially indicative answer would be that you could consider the analogy of a running tap filling a leaky bucket. Water is oxygen in this case and the bucket is the muscle. If you are near exhaustion with a relatively high SmO2 then your legs aren’t using the oxygen that is available – the water is flowing nicely but the holes aren’t big enough. Conversely a relatively low SmO2 being maintained near FTP might mean that your muscles are pretty good at using what oxygen is there; you just need to turn the tap on a bit more through more aerobic training. In each case you have an insight as to where to focus your future training.
You might also look at how quickly the bucket fills up once you have plugged some holes (stopped exercising), the rate of recovery of muscle oxygen levels might give you insights into cardiac, muscular or respiratory limiters.
Consider this running session of mine where I am alternating between HM pace and 5k pace ie under and over threshold up until about 57 minutes when I stopped.
I’ve not analysed this properly. But as an indication I might say that the sharp peaks represent a speedy recovery in muscle oxygen levels when I slow to HM pace. Reverting back to 5k pace, the drop in muscle oxygen levels is quick. So, overall, I’m probably Ok as I am adapting quickly to the demands of faster speeds and then adapting quickly to the partial recovery. However my high 60’s SmO2% possibly indicates that my general levels of aerobic supply are Ok but I need to work on increased muscular usage of oxygen. In the absence of SMO2 data that’s what I would have said anyway.
Let me know if I’m wrong, please, in my interpretation ! It’s a complex area.
Exporting The Data
In order to get benefits over and above the lactate tests, you need to get your data out of the BSX app’s environment.
You maybe lucky enough to have native recording in a WAHOO ELEMNT or top-of-the-range Garmin. Or you may be lucky enough to have an indoor trainer and some form of computer based ANT+ recording nearby eg with Golden Cheetah and an ANT+ stick.
The reality for most of us will be different.
From the BSX app you can export to FIT (beta April 2016) or CSV. Although I don’t quite know what to do with a CSV file other than admire it in Excel.


Now you have your FIT file you can manually stick it anywhere, politely of course! With Sporttracks and Golden Cheetah you can combine other data for the same session into one analysis. Probably too with Training Peaks. Of course those of you who had it in your WAHOO ELEMNT will have automatically sent it to anywhere that was able to receive it eg from STRAVA/GARMIN via TAPIRIIK/fitnesssyncer/syncmytracks.
To Be or not THb
BSX Insight includes THb capability. The data is shown on the IQ Connect Datafield and smartphone apps that support that data but it does not show on the BSX online app nor in the exported data. Although it is coming ‘soon’ (Source: BSX)
- Oxygenated Hemoglobin Concentration = O2Hb
- Deoxygenated Hemoglobin Concentration = HHb
- Total Hemoglobin Concentration = tHb = O2Hb + HHb
- SmO2 is O2Hb as a percentage of total
Now you know.
Scientific Accuracy
Apparently it’s accurate for runners! So say the scientists
Research Summary: Wearable lactate threshold predicting device is valid and reliable in runners.
SOURCE: bit.ly/1S0uqi3 Journal of Strength and Conditioning Research, online December 15, 2015. Borges & Diller (National Strength & Conditioning Association, copyright 2016)


Summary
It seems to have a useful degree of accuracy from LT testing to day-to-day usage.
It seems to have several use-case scenarios that could benefit many aspects of our training.
I’m certainly going to play with it some more as, for one, I am sure more insight is to be had from muscle oxygenation data.
It’s easy to wear but a bit of a faff to get at the data in the same way you would your HR data. That situation is improving and also relies on others, like Garmin, to sort out standards and the implementations thereof.
It seems keenly priced.
If you already have a power meter; STRYD, Garmin or otherwise, then this baby is next on the shopping list. Actually it would be ahead of the STRYD.
Costs
BSX Insight prices start from £350 in the UK: , with a 10% discount using the code TFK10
- BSXinsight (Gen 2): Running Edition $300
- BSXinsight (Gen 2): Cycling Edition $370
- BSXinsight (Gen 2): Multisport Edition $420
- BSXinsight (Gen 2): Compression Sleeve $60


Agree totally that the turn on/off needs to be simplier…
It have happen several times that my BSX have been turned off before I have been able to start the session.
Otherwise I´m pleased with the product.
Did you find differences on left/right legs in same place? for me seems to be lower on my weaker leg (maybe)
I have actually not tested it with my left leg.
Only used it on my right.
Hi,
Is there any further developments regarding the bsx insight (muscle oxygen sensor) data being written to Garmin fit file? I believe Garmin said it would be available in quarter 1 2016? We are still waiting….
Are the improvements within the IQ network linked to a possible update or am I dreaming?
Cheers
I am asking about this in parallel. no info from anyone. I believe it is imminent but, as you point out, obviously not as imminent as Q1.2016. so the CIQ thing *IS* holding write to fIT back HOWEVER as well as that the device manufacturer needs to do their bit. I don’t know if bsx have or not. I THINK they have…we’ll see.
I’m a little disappointed with the development of the Bsx insight, I originally had very high hopes of what this device could provide, but as a company i’m a little confused with there approach…..
They have little to No information available, without the likes of you and Dc rainmaker there would 90% less information in the field… I am desperate to use this device to help provide me with a meaningful metric, as yet all i have is a pretty graph that shows me little to nothing.
Yes i have a value on my watch and cycle computer but where and what does that correspond too? The ramp test provides a nice graph but where does the watch data fit in? Surely a graph that mirrors the ramp test would help… Even a forum where people with good knowledge and experience could pass over/ swap ideas and take the product forward…. The sheer lack of anything coming out of there business speaks volumes for the company/product, i hope i’m wrong but i feel a little let down having spent 450 dollars on something that provides me with nothing other than a pretty graph. 🙁
lots of points there
1. once write to FIT file is possible (v soon) then Iwould hope that the bsx device will record straight into that on your device. further analysis will then be easier
2. the MOXY forum discuss the interpretation of SM02 data. It’s not so straightforward as hr/power/etc
use the moxy data field on garmins. they pick up bsx data