Respiration Rate
Within 0.5–1.5 brpm during sleep; degrades to 4+ brpm above lactate threshold during exercise
Spotting rising fatigue or early illness from multi-night sleep trends.
Wrist-based accuracy is materially lower than from a chest-strap during exercise
Plain English: Respiration rate is the number of breaths per minute that the watch measures at the wrist. During sleep, lower is better — typically under 15 for fit individuals. A sustained rise over several nights points to fatigue or an oncoming illness.
In practice: Breathing rate is a metric I almost never look at for health purposes. I trust it to work behind the scenes, feeding into the results of other algorithms that Garmin shows me. Garmin understands that there are too many raw, low-level metrics, such as respiration, to check every day to see whether they have strayed beyond the normal range. Breathing rate also has another use in assessing athletic intensity, where it is an excellent predictor of threshold-like efforts and perhaps even more useful than power or heart rate for assessing effort over multiple-hour durations. However, Garmin’s wrist technology can’t yet provide the required level of accuracy, and its Connect ecosystem doesn’t consider ventilatory thresholds and zones for sporting uses, which is surprising
Quick answers
What is a normal respiration rate on Garmin?
A healthy adult breathes 12 to 20 times per minute at rest, and fit endurance athletes typically sit at the lower end of that range during sleep. Garmin’s own Connect interface uses this same 12–20 range as its reference. Readings that persistently fall below 12 or above 20 during sleep warrant attention, but a single outlier night is not informative — verify watch fit before drawing conclusions.
What does respiration rate mean on Garmin during sleep?
During sleep, Garmin records breathing frequency continuously and averages the result across each sleep stage — light, deep, and REM. A lower rate when asleep, particularly in deep sleep, indicates that the body is in a well-recovered state with reduced cardiorespiratory demand. The metric is most useful as a trend: a rate that climbs over three or more consecutive nights before other symptoms appear is a reliable early signal of fatigue or oncoming illness.
Is Garmin respiration rate accurate?
During sleep, wrist-derived respiration has been validated against polysomnography with mean absolute errors of approximately 0.5–1.5 breaths per minute under controlled conditions. Accuracy is lower during exercise: a 2021 study in the Journal of Clinical Medicine found divergence of 4 or more breaths per minute above lactate threshold intensity. For sleep trends, the metric is reliable enough to act on; for exercise, a chest strap produces materially better data.
Why has my Garmin respiration rate suddenly gone up?
A sudden single-night spike is almost always a loose watch fit or a warm sleeping environment rather than a genuine physiological change. If the reading has jumped across multiple consecutive nights without a change in training load, consider early illness, alcohol consumption the night before, altitude exposure, or — on Fenix 8 and Venu 3 devices — a known firmware issue from a February 2025 update that caused reported rates to approximately double. Check the Garmin forums and install the latest firmware to confirm whether a software fix applies.
Respiration Rate — A Deep Dive
When Respiration Rate Is Actually Useful
- When I tested this feature in more detail a few years ago, one thing that stood out was the signature of a late-evening hard session in the night’s sleep data. My respiratory rate was clearly elevated throughout the first two sleep cycles, whereas my resting heart rate had not yet been affected.
- I can think of two occasions over recent years where falls in SpO2 and rises in breath rate above my baseline signalled the start of a chest infection and a separate viral illness. In both cases training load was stable and no other explanation fitted.
Garmin Respiration Rate measures how many breaths an athlete takes per minute and is recorded continuously during sleep and during certain activities. It provides a window into cardiorespiratory load that heart rate alone cannot supply.
Garmin primarily uses respiratory rate as a sleep-quality signal and a recovery indicator in the Health Snapshot tool. The metric is passive — it requires no action from the wearer — but its accuracy is materially lower than chest-strap-derived measurements, and it cannot yet replace clinical spirometry or laboratory gas analysis as a fitness assessment tool.
What the Number Actually Means
A healthy adult at rest breathes between 12 and 20 times per minute; fit endurance athletes typically sit at the lower end of this range during sleep. A rate that trends upward over several nights often signals incomplete recovery, accumulating fatigue, or the early stages of illness before other symptoms appear. During exercise, rate rises with intensity, but Garmin does not currently derive a discrete training metric from it — the data is recorded and visible in the activity file.
Interpretation
| Respiration Rate (breaths per minute) | Clinical Classification | Context for Athletes |
|---|---|---|
| Below 12 | Bradypnoea (abnormally slow) | May appear in highly trained endurance athletes during deep sleep; warrants attention if sustained during waking rest |
| 12–20 | Normal adult range | Typical resting and sleeping range; fit athletes often sit at the lower end |
| 21–24 | Mildly elevated | May indicate incomplete recovery, early fatigue, or environmental stress; review trend over 3–5 nights |
| 25–30 | Moderately elevated (tachypnoea) | Consistent readings in this range during sleep warrant investigation; rule out illness, wrist fit issues, or altitude exposure |
| Above 30 | Significantly elevated | Unlikely in a resting athlete without acute illness or sensor error; verify watch fit before drawing conclusions |
Source: NHS clinical guidance and American Thoracic Society reference standards
How Garmin Calculates It
Garmin derives respiration rate from the optical heart rate sensor using photoplethysmography-derived respiration (PDR). The Elevate sensor detects subtle fluctuations in blood volume at the wrist that correspond to respiratory effort; Firstbeat Analytics processes these signals to estimate breath cycles per minute. During sleep, the watch calculates the rate continuously and presents the average for each sleep stage. A minimum of approximately two hours of wear is required for a reliable nightly baseline.
During recorded activities, respiration rate is captured as a data stream when the activity profile supports it. A Garmin HRM-Pro Plus or HRM-600 chest strap produces a materially more accurate reading than wrist-based derivation, particularly at intensities above the lactate threshold, where movement artefact degrades the optical signal.
What Affects the Reading
Wrist fit is the single largest source of error. A watch worn too loosely during sleep picks up movement artefacts that the algorithm misinterprets as respiratory cycles, inflating the reading. The watch should sit one to two finger-widths above the wrist bone and not rotate freely. During exercise, movement artefact increases substantially with intensity, making the wrist sensor unreliable above easy aerobic effort.
Illness reliably elevates respiratory rate before other symptoms appear. Altitude raises it further as the body compensates for reduced oxygen partial pressure; athletes travelling to high altitude should expect elevated readings for the first several days regardless of fitness level. Alcohol disrupts the normal pattern of respiratory variation across sleep stages and can produce a reading resembling early illness.
How Accurate Is It
Wrist-derived PDR has been validated against polysomnography in sleep settings, with reported mean absolute errors of approximately 0.5–1.5 breaths per minute under controlled conditions. Real-world accuracy varies with wrist fit, skin tone, and movement during sleep.
During exercise, accuracy degrades above the lactate threshold. A 2021 study in the Journal of Clinical Medicine found agreement within 2 breaths per minute at easy efforts but divergence of 4 or more breaths per minute at high intensity. The metric is more useful as a trend indicator than as an absolute measurement in either context.
Competitor Equivalents
- Apple Watch measures respiratory rate during sleep via wrist-based PDR and reports it in the Health app, but does not integrate it into a training readiness or recovery score.
- Polar records breathing rate during exercise using chest-strap impedance pneumography on the H10, which is materially more accurate than wrist-based derivation; sleep breathing rate is available via Nightly Recharge on compatible devices.
- Coros does not offer a dedicated respiration rate metric as of March 2026.
- Suunto records sleep breathing rate on the Race and Vertical series via wrist-based optical sensing, feeding it into the Suunto Sleep Score but not into a broader recovery indicator.
- Wahoo does not offer a respiration rate metric on its ELEMNT computers.
Which Garmin Devices Support It
Garmin introduced respiration rate monitoring in 2019 on the Fenix 6 series. Sleep respiration rate is available on all mid-tier and above devices on the Garmin OS unified codebase — including the Fenix 8 series, Enduro 3, Tactix 8, Quatix 8, Forerunner 970, Forerunner 570, Venu 4, Venu X1, and Vívoactive 6. The Forerunner 165 and Forerunner 55 record sleep respiration rate but do not display it as a standalone glance or link it to a recovery score. Exercise respiration rate with full Garmin Connect integration is limited to the unified codebase devices from mid-2024 onwards; the Forerunner 965, Forerunner 265, and Epix Pro Gen 2 offer more limited exercise presentation. The Instinct 3 records the metric during sleep but does not surface it in a full health status view.
Where to Find It
- Watch glance — within the health glance stack on supported devices, shows the previous night’s average and a seven-day trend graph.
- Activity data field — add manually through the activity settings menu; absent from default layouts.
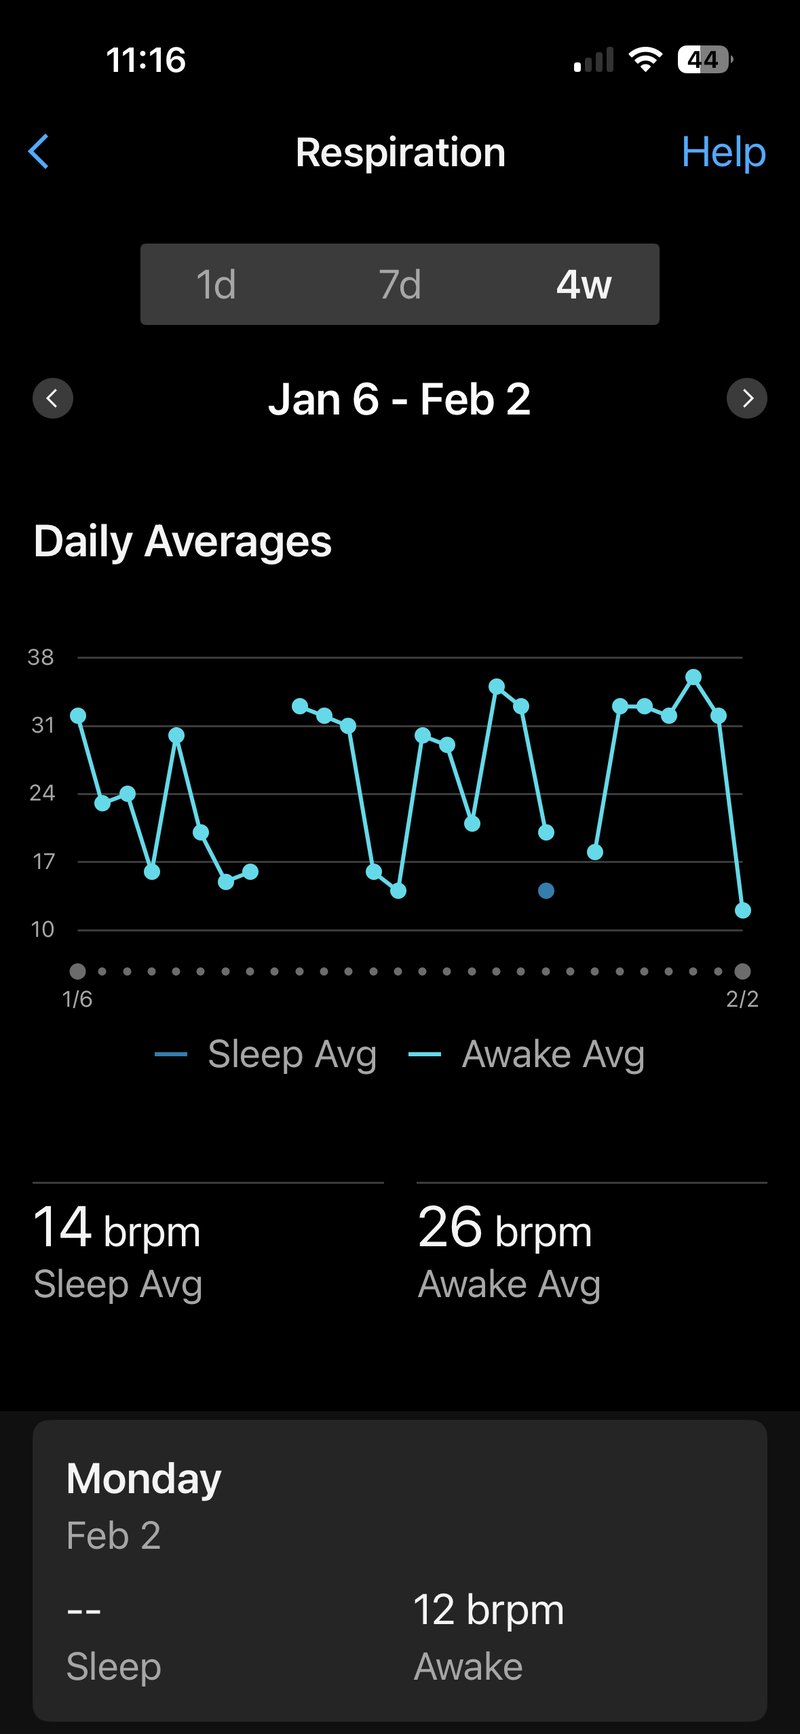
- Garmin Connect Mobile — Sleep — Health Stats tab; tap to see the nightly reading graphed alongside sleep stages; four weeks of history available without a Connect Plus subscription.
- Garmin Connect Mobile — Health Snapshot — records a 60-second live reading alongside heart rate, HRV, pulse ox, and stress.
- Garmin Connect Web — Health Stats — nightly average only; the sleep-stage breakdown available in the app is absent.
Common Problems and Misreadings
Readings above 25 breaths per minute in a resting athlete with no illness history are almost always caused by a loose watch fit, as covered in What Affects the Reading. Checking the fit and cleaning the sensor window resolves the majority of these cases. See FAQ above for details.
A single elevated night is not informative. The seven-day trend view is the correct lens for identifying genuine recovery problems; individual readings should not trigger a training change. See FAQ above for details.
Respiration rate is not a sleep apnoea screen. Garmin measures average breathing frequency, not apnoeic events, oxygen desaturation, or airflow interruptions. Athletes with clinical concerns should seek a formal sleep study.
How to Improve It
Resting and sleeping respiratory rates decrease as aerobic fitness improves. Sustained easy aerobic training performed consistently over months strengthens the respiratory muscles, improves chemoreceptor sensitivity, and reduces ventilatory demand at any given workload. The adaptation is gradual; short training blocks do not produce a measurable change in the Garmin-recorded metric.
Accumulated training fatigue raises the nightly respiratory rate relative to baseline; planned recovery weeks produce a measurable reduction, as shown in the Connect trend view. Managing load — rather than adding more training — is the primary lever for lowering an elevated nightly reading in an already fit athlete.
Other Points
Elevated resting respiratory rate is associated with increased all-cause mortality risk independent of other cardiovascular risk factors. A 2011 study by Parkes, published in Primary Care Respiratory Journal, found that rates above 20 breaths per minute were associated with significantly higher mortality in a general adult population, giving the metric clinical relevance beyond athletic recovery.
Resting respiratory rate increases during detraining. The ventilatory adaptations gained through endurance training begin to reverse within two to four weeks of inactivity, resulting in a measurable increase in resting respiratory frequency (Mujika and Padilla, Sports Medicine, 2000).
Scientific Basis
Charlton, P.H. et al. (2021). Breathing rate estimation from the electrocardiogram and photoplethysmogram: a review. IEEE Reviews in Biomedical Engineering. Comprehensive review of PDR derivation methods directly applicable to Garmin’s wrist-based approach.
Nicolò, A. et al. (2020). The importance of respiratory rate monitoring: from healthcare to sport and exercise. Sensors, 20(21). Establishes the physiological rationale for respiration rate as a training and recovery marker in sport.
Parkes, R. (2011). Respiratory rate as an indicator of acute deterioration in ward patients. Primary Care Respiratory Journal. Links resting respiratory rate to all-cause mortality risk, establishing clinical significance beyond athletic use.
Firstbeat Technologies (2014). Firstbeat Athlete — Physiological Background. Firstbeat white paper. Documents the HRV-derived signal framework within which Garmin’s respiration rate estimation operates.
How It Connects to Other Features
Respiration rate feeds into [LINK: health-snapshot], recorded alongside resting heart rate, HRV, stress, and pulse ox as a composite sixty-second reading. It contributes to Sleep Score, where breathing frequency across sleep stages informs sleep depth assessment. Elevated nightly readings suppress Body Battery recovery, and typically coincide with reduced [LINK: hrv-status] — both reflecting the same underlying autonomic stress response and visible together in the Health Stats view.
