Garmin Sleep Score
Useful as a weekly trend; stage values carry substantial uncertainty
Spotting patterns across a week — duration, alcohol impact, late training. Good for a daily sense check of how sleep felt.
Sleep stage agreement of 40–50% in independent testing; poor REM and wake detection
Quick answers
What is a good Garmin Sleep Score?
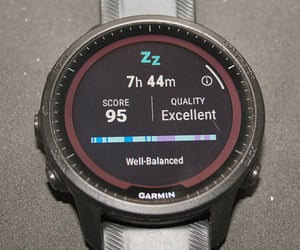
Garmin rates 80–89 as Good and 90–100 as Excellent, with the global average sitting at 72 for the period Feb 2024–Jan 2025. A consistent score in the mid-70s to low 80s indicates adequate sleep for most recreational athletes; only 5% of Garmin users regularly reach the Excellent band.
Why is my Garmin Sleep Score low?
The most common cause is the HRV recovery component rather than sleep duration. Alcohol, a hard training session in the evening, mild illness, and elevated ambient temperature all suppress overnight parasympathetic activity and drive the score down even when sleep duration and continuity were normal.
How is Garmin Sleep Score calculated?
The score combines three elements: sleep duration compared against age-adjusted standards, stage balance across deep, light, and REM sleep, and overnight HRV recovery measured via the autonomic nervous system stress score. Sleep stages are estimated using proprietary algorithms that analyse heart rate, HRV, respiratory rate, and accelerometer data.
Why is my Garmin Sleep Score not showing?
Check first whether the sleep period was three hours or less — shorter periods are classified as naps and produce no score. Also, confirm that heart rate tracking was enabled, that battery saver was disabled overnight, and that the Garmin Connect app has synced since waking. Verify that sleep time and wake time windows in Garmin Connect user settings include the actual bedtime.
Garmin Sleep Score — A Deep Dive
When Sleep Score Is Actually Useful
- I’ve used Sleep Score as a flag to research deeper on those nights where I scored badly to find the cause – changing my routine if that was the cause, or taking it easier if I’m less ready to train or perhaps coming down with illness.
- Garmin’s coloured bars that indicate the sleep stages throughout the night (or over the weeks) are well-placed below the Sleep Score number and sometimes quickly tie a lack of Deep Sleep together with a lower-than-expected score.
Garmin Sleep Score is a nightly number from 0 to 100 that summarises how well a wearer slept, calculated from sleep duration, the quality of sleep stages, and evidence of autonomic nervous system recovery derived from heart rate variability data.
Garmin Sleep Score (sometimes referred to as a nightly sleep score or sleep quality score) was introduced in mid-2020 on the Fenix 6 series via beta firmware (e.g., version 19.20) and broadly launched shortly after, using the same HRV analysis that powers all-day stress tracking. The score is not a clinical measure of sleep health; it is an estimate derived from wrist-worn optical sensor data, and the accuracy of the underlying sleep stage classification is measurably lower than that of laboratory polysomnography.
What the Number Actually Means
Garmin assigns four bands to the scale, shown below. A low score on a single night is not significant in itself; patterns over a week are more meaningful. Age affects the score because Garmin uses age-adjusted reference standards to evaluate whether sleep duration and stage distribution are appropriate — enter a correct date of birth in Garmin Connect for accurate results.
| Score range | Rating |
|---|---|
| 90–100 | Excellent |
| 80–89 | Good |
| 60–79 | Fair |
| Below 60 | Poor |
How Garmin Calculates It
The score is built from three elements:
- how long the wearer slept,
- how well sleep was structured across stages, and
- how much physiological recovery occurred overnight.
Sleep duration is compared against the American Academy of Sleep Medicine recommendation of seven to nine hours for healthy adults, adjusted for age.
Stage balance — the proportion of deep, light, and REM sleep — is assessed against reference ranges. The overnight recovery element is derived from HRV: beat-to-beat heart rate variation is analysed to assess the balance between parasympathetic (rest and recovery) and sympathetic (stress and arousal) ANS activity during sleep, with greater parasympathetic dominance contributing more to the score.
Sleep stages are estimated using proprietary algorithms that analyse heart rate, HRV, respiration rate, and accelerometer movement data recorded by the watch and processed within the Garmin ecosystem.
A sleep period must exceed approximately three hours to generate a Sleep Score; periods of three hours or less are classified as naps and do not produce a score. Garmin has not published an exact minimum threshold — the practical lower bound is derived from the nap classification ceiling. If the watch is not worn or heart rate tracking is disabled, no score is generated for that night.
What Affects the Reading
Watch fit is the most common hardware source of degraded data: the optical heart rate sensor requires consistent skin contact to measure HRV accurately overnight, and a watch worn loosely or positioned over a wrist bone produces noisy or absent HRV data that directly degrades the stress score and stage classification. Pulse Ox (blood oxygen saturation) is not used in the calculation of Sleep Score. On devices that support overnight Pulse Ox monitoring, the data appears separately in sleep reports but does not affect the Sleep Score itself.
Alcohol reduces overnight HRV to below-normal levels even when sleep duration is adequate, and the watch correctly registers this suppression as elevated stress. Late-evening training has the same effect: a workout completed close to sleep reduces the overnight recovery component regardless of sleep duration or continuity. Illness and immune activity produce HRV patterns similar to physiological stress, sometimes driving a lower score before symptoms appear.
How Accurate Is It
Garmin’s own internal validation study, testing the sleep stage classifier on a vivosmart 3 against a Sleep Profiler reference device scored via polysomnography (PSG — a full clinical sleep laboratory test), reported overall accuracy of 69.7%, sensitivity in detecting sleep of 95.8%, and specificity in detecting wake of 73.4%, with a moderate level of agreement against the reference standard, compared with an inter-scorer human agreement on PSG of approximately 83%.
Two independent peer-reviewed studies using older Garmin hardware found weaker results: Chinoy et al. (2021, Sleep) tested the fēnix 5S and vivosmart 3 and reported specificities of 0.18 and 0.19 — the lowest of any consumer device in that study — indicating a systematic tendency to classify wake as sleep; Chinoy et al. (2024, Frontiers in Physiology) found the vivosmart 4 was the only device among five unable to estimate total sleep time with accuracy comparable to research-grade motion tracking. Both studies predate the current Elevate sensor generations and should be treated as a historical baseline.
Testing of current Garmin devices summarised on the5krunner.com (October 2025), drawing on the Quantified Scientist’s reference-standard comparisons, found average sleep-stage agreement of 40–50%, placing Garmin toward the lower end of consumer wearables for sleep-stage agreement in those comparisons, with particularly poor REM and awake-period agreement. Devices from Oura, Apple, Whoop, and Fitbit/Google consistently outperformed Garmin on this measure. The absolute stage values underpinning Sleep Score, therefore, carry substantial uncertainty, and the score is more reliable as a trend across multiple nights than as a precise daily verdict.
Competitor Equivalents
- Polar — Nightly Recharge includes a Sleep Score (0–100) as one of two sub-components, assessed against the athlete’s own 28-day rolling average rather than fixed interpretive bands, with six sub-components grouped as Amount, Solidity, and Regeneration; the Sleep Plus Stages algorithm is stated to have been validated against polysomnography.
- Apple Watch — Sleep Score (watchOS 26) uses three fixed-weighted components: sleep duration (50 points), bedtime consistency versus the preceding 13 nights (30 points), and interruptions (20 points); the scale runs from Very Low to Very High (top band renamed in watchOS 26.2) and contains no HRV or autonomic recovery element.
- Coros — Sleep Quality produces a five-band categorical label (Great, Good, Fair, Low, Poor) based on duration against National Sleep Foundation recommendations and stage distribution, with no numeric score and no published component weighting.
- Suunto — Sleep Quality Score is a 0–100 percentage based on sleep duration relative to a target or the general eight-hour recommendation, and on overnight HRV, where higher HRV indicates better recovery; component weighting is proprietary and not published.
- Wahoo — no sleep score or overnight sleep tracking feature exists on any current Wahoo product.
Which Garmin Devices Support It
Sleep Score is available on all current Garmin watches with an optical heart rate sensor capable of overnight HRV measurement, covering the full current range from the fēnix 8 and Forerunner 970 at the top to the Forerunner 165, Instinct 3, vívoactive 6, Venu 4, and vívosmart 5 at the entry tier. The feature was introduced in 2020 on the fēnix 6 series via beta firmware, with a broader launch in 2021, and has since been extended to additional families, including the vívomove series, Lily 2, and Instinct 2, via firmware updates. The notable exceptions — devices with an optical HR sensor that do not support Sleep Score — are the Forerunner 55, Forerunner 245, vívoactive 4, and vívosmart 4. The Index Sleep Monitor, a dedicated sleep-tracking arm band rather than a watch, also produces a Sleep Score in Garmin Connect when used independently or alongside a compatible watch.
Where to Find It
- Watch sleep widget — displays the Sleep Score and last night’s sleep summary; the insights screen appears as the final page of the widget, but only on nights when the data contains something noteworthy, not guaranteed nightly.
- Morning Report — shows the overnight score and its primary influencing factor on devices that support it.
- Garmin Connect app — My Day page — sleep score card appears in the daily summary.
- Garmin Connect app — Health Stats — More (bottom right) > Health Stats > Sleep or Sleep Score; shows a full component breakdown and historical trend data.
- Garmin Connect web — Health Stats > Sleep or Sleep Score in the left navigation; presents score and stage breakdown with a less interactive historical view than the app.
No aspect of Sleep Score access or history requires a Garmin Connect Plus subscription.
Common Problems and Misreadings
A score lower than expected after a night that felt restful is most commonly explained by the overnight HRV stress component. Alcohol, a hard session in the evening, mild illness, and elevated ambient temperature all suppress overnight parasympathetic activity, reducing that component even when sleep duration and continuity were fine. The physiological causes are covered in “What Affects the Reading”; the key point is that the score is not wrong — it is registering a genuine reduction in restoration that does not always align with subjective experience. See FAQ above for further detail.
A score that is higher than expected after poor subjective sleep is usually explained by the watch classifying motionless wakefulness as light sleep. Lying still, unable to sleep, results in reduced movement and a stable heart rate, which the algorithm interprets as sleep onset. The resulting score overstates duration and may overstate quality.
A missing score — where the watch tracked the night but nothing appeared in Garmin Connect — has three common causes: the sleep period was three hours or less and was classified as a nap; heart rate tracking was off, or battery saver mode was active; or the app had not synced since waking. Check that sleep time and wake time windows in Garmin Connect user settings bracket the actual bedtime, and confirm heart rate tracking is set to On. See FAQ above for further detail.
How to Improve It
Sleep duration is the single largest component. Reliably reaching seven to nine hours requires a consistent bedtime and sufficient time in bed. Going to bed at the same time each night stabilises the stage distribution across the week and reduces the cumulative effect of variability on the weekly average.
The HRV recovery component responds most directly to three levers: training session timing, alcohol, and the pre-sleep environment. Complete hard sessions in the morning or early afternoon to allow HRV to return to baseline before bed. Reduce or eliminate alcohol on nights when recovery matters. A cooler sleeping environment and reduced screen exposure in the hour before sleep are both associated with faster sleep onset and stronger early-night HRV, which contributes disproportionately to the quality of overnight recovery.
Other Points
Short sleep duration is associated with a range of adverse health outcomes in the general adult population. Watson et al. (2015), in the joint consensus statement of the American Academy of Sleep Medicine and Sleep Research Society, published in the journal Sleep, reviewed evidence linking habitual sleep of fewer than 7 hours per night to increased risks of obesity, diabetes, hypertension, cardiovascular disease, and all-cause mortality. Garmin Sleep Score uses this consensus as the basis for its age-adjusted duration evaluation.
Scientific Basis
Burgett, S., Blair, R., Lightfoot, D., et al. “Commercially Available Wearable Provides Valid Estimate of Sleep Stages.” Garmin Health / University of Kansas Medical Centre. Published garmin.com, June 2019. A validation study using the Vivosmart 3 as a data collection device, testing whether wrist-worn optical and accelerometer data could estimate sleep stages against a PSG-scored reference, found 69.7% overall accuracy — establishing that the sensor inputs used in Garmin’s sleep tracking can produce valid stage estimates.
Watson, N.F., Badr, M.S., Belenky, G., et al. “Joint Consensus Statement of the American Academy of Sleep Medicine and Sleep Research Society on the Recommended Amount of Sleep for a Healthy Adult.” Sleep. 2015;38(8):1161–1183. Establishes the seven-to-nine-hour adult sleep duration recommendation and health risk thresholds that Garmin uses as the age-adjusted reference standard for the duration component of Sleep Score.
Chinoy, E.D., Cuellar, J.A., Huwa, K.E., et al. “Performance of seven consumer sleep-tracking devices compared with polysomnography.” Sleep. 2021;44(5):zsaa291. PMC8120339. The fēnix 5S and vivosmart 3 had the lowest specificities (0.18 and 0.19) among all devices tested for detecting wake periods, indicating a systematic tendency to over-assign time to sleep.
Chinoy, E.D., Cuellar, J.A., Mukherjee, S., Jungquist, C.R. “Evaluating Accuracy in Five Commercial Sleep-Tracking Devices Compared to Research-Grade Actigraphy and Polysomnography.” Frontiers in Physiology. 2024;15. PMC10820351. Found the vivosmart 4 was the only device among five unable to estimate total sleep time with accuracy comparable to research-grade motion tracking, with systematic overestimation of light sleep.
How It Connects to Other Features
Sleep Score feeds directly into Training Readiness as a named sleep sub-component weighted alongside HRV Status, recent training load, and recovery time, and influences Training Status over sustained periods of low scores, which can shift status toward Overreaching or Unproductive. The overnight HRV measurements that drive the stress-during-sleep component use the same data source as [LINK: hrv-status], so any night on which the watch is not worn or heart rate tracking fails affects both metrics simultaneously. Sleep quality is the primary overnight driver of Body Battery recovery, with the stress-during-sleep component determining how much recharging occurs each night. [LINK: sleep-stages] provides the granular stage structure that underlies the stage balance elements of Sleep Score, and the score is also shown in the [LINK: morning-report] alongside its primary influencing factor.
