FIT Dashboard: Free, Privacy-Focused, Local-First Garmin Activity Analytics Desktop App
Garmin Connect works, but it relies entirely on the cloud. If you want to analyse your training data offline, build a custom dashboard, compare stats, organise, or simply keep your telemetry out of a corporate database, the options have historically been clunky or required advanced coding skills. I have built a more customisable dashboard tool before for Garmin and Grafana users, named Garmin-Grafana. Still, it’s highly technical to set up as it requires installation and knowledge of Docker stacks, and is not suitable for most average users.
FIT Dashboard is an open-source desktop and self-hosted web app that tries to solve this. The premise is simple: an extremely fast, modern, clean-looking, high-performance analytical dashboard that runs entirely locally on your machine. It parses Garmin FIT files directly, stores them in an embedded database, and gives you rich, interactive charts without ever pinging a remote server. It also lowers the barrier to getting started by providing built desktop app binaries for instant installation and use.
How It Works
Built using a modern tech stack (Tauri, Rust, React, and DuckDB), FIT Dashboard acts as a standalone repository for your activities. You import your raw .fit files (either in bulk from a Garmin Connect data export or individually), and the app’s native Rust parser processes them instantly. Export the .fit files from your Garmin devices locally (from \GARMIN\Activity when connected to the PC) or from the Garmin Connect web app.
Once imported, the data lives in a high-performance DuckDB database on your local drive. The interface provides an Overview tab for aggregate statistics – total distance, duration, and activity counts, alongside a recent activity feed in the sidebar.
What It Handles
The app parses standard Garmin FIT activity files and extracts the full suite of telemetry. When you click into a specific run or ride, you get:
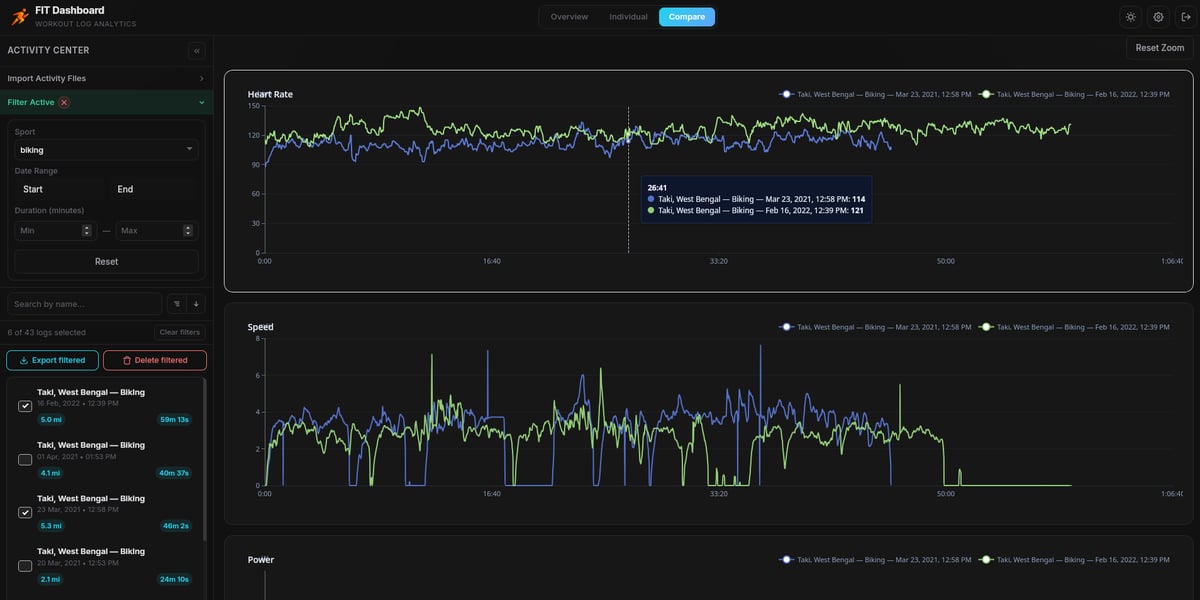
- Interactive Telemetry Charts: Speed, heart rate, cadence, altitude, power, and temperature are plotted out. The charts support synchronised zoom and pan, meaning you can isolate a specific interval and see how all your metrics behaved simultaneously.
- Dynamic Mapping: A MapLibre GL map traces your route, automatically colour-coding the path by the metric of your choice (e.g., a GPS track that shifts from green to red based on heart rate or power output). Hovering over any point on the map reveals exact telemetry for that specific coordinate.
- Advanced Filtering: You can sort and filter your entire database by sport type, date, or duration to isolate specific training blocks.
- Overview page: Shows aggregate values of the currently filtered activities. If nothing is selected, it displays an overview of all imported activities.
Comparison page: This is where you can select up to 4 different activities and compare their metrics in the same charts overlapped – this comes in handy when you want to see if you have improved something in the same activity over time.
Data Privacy and Storage
This is where FIT Dashboard sets itself apart from subscription platforms. It is fundamentally local-first. There is no cloud sync, no tracking pixels, and no telemetry sent back to the developer. Your coordinates, health metrics, and workout histories stay on your hard drive.
For those who want to self-host, there is a Docker-deployable web app version. Still, for most runners, the pre-compiled desktop binaries (available for Windows, Mac, and Linux) provide the easiest path to secure, private analytics.
To back up the setup, make a copy of the standalone DuckDB database file when the app is not running.
Exporting and Management
If you need to move your data to another platform, the app includes robust bulk export tools. You can select filtered activities and export them as CSV, JSON, GPX, or KML files. The KML export even supports 3D line paths using absolute altitude, which is a brilliant touch for trail runners and cyclists wanting to visualise elevation profiles in Google Earth.
Things to Note
- Manual Import: FIT Dashboard does not automatically pull data from the Garmin Connect API (which would require cloud infrastructure, and Garmin currently does not provide free API access to end users). You must manually feed it your exported FIT files. For a full history, requesting Garmin’s bulk data export zip is the best starting point. Refer to this guide on how to get the files from Garmin. After the first import, the application creates a fit-files sync folder in the app storage location. You can drop your fit files there and sync directly. This is also a way to keep an offline backup copy of your raw activity fit files.
- Duplicate Handling: If you accidentally import the same workout twice, the app uses file hashing and timestamp matching to automatically skip duplicates.
- Cost: It is entirely free and open-source – made for the community. Donations and support are appreciated, but never required. No features are paywalled.
What Early Adopters Are Saying
Early feedback on r/GarminWatches, the Garmin Forums, and the intervals.icu Forum has been measured, but positive.
Quick answers
Which operating systems does FIT Dashboard support?
FIT Dashboard ships as pre-compiled desktop binaries for Windows, macOS, and Linux. A Docker-deployable web version is also available for users who prefer server-style self-hosting on their own infrastructure.
Does FIT Dashboard sync automatically with Garmin Connect?
No. Garmin does not provide free API access to end users, so automatic sync is not possible without cloud infrastructure. Activity files are imported manually, either individually or in bulk from a Garmin Connect data export.
How do I import my existing Garmin history?
Request a bulk data export from garmin.com under Data Management and Export Your Data. Garmin will email a ZIP archive when it is ready. Extract the archive, locate the folder named DI_CONNECT/DI-Connect-Fitness-Uploaded-Files, and import those files into FIT Dashboard. Alternatively, copy the .fit files directly from a Garmin device’s \GARMIN\Activity folder when the watch is connected to a PC over USB.
What file format does FIT Dashboard import?
The Garmin FIT activity file format. The native Rust parser extracts the full telemetry from standard Garmin FIT files without relying on external tools.
What file formats can I export?
CSV, JSON, GPX, and KML. CSV contains the complete time-series with all telemetry fields. GPX preserves heart rate, cadence, and power as standard extensions. KML uses 3D line paths with absolute altitude mode, which makes elevation visible when opened in Google Earth.
Where is my activity data stored?
In an embedded DuckDB database file on your local drive. No activity data is transmitted to remote servers. For Docker deployments, the database is stored in a persistent named volume mounted into the container.
How do I back up my FIT Dashboard database?
Close the app, then copy the standalone DuckDB database file from the application’s storage location to your backup destination. The entire database is contained in that single file.
What telemetry metrics does FIT Dashboard display?
Speed, heart rate, cadence, altitude, power, and temperature. Each metric is plotted on an interactive chart with synchronised zoom and pan. The activity map can colour-code the GPS track by any of these metrics to visualise where on the route they peaked or dropped.
How many activities can I compare at once?
Up to four. The Comparison page overlays the selected activities on the same telemetry charts, providing the fastest way to assess improvement on a repeated route or training session.
Does FIT Dashboard send any data to the developer or the cloud?
No. There is no cloud sync, no tracking pixel, and no telemetry sent back to the developer. The app is local-first, and activity data does not leave your device unless you export it yourself.
How does FIT Dashboard handle duplicate imports?
Duplicates are detected using file hash matching combined with exact start and end timestamp comparison. Re-importing the same workout is skipped automatically.
Can I self-host FIT Dashboard on my own server?
Yes. A Docker-deployable web app version is published for users who prefer server-style hosting, running alongside the standalone desktop binary.
Does FIT Dashboard replace Garmin Connect, Strava, or TrainingPeaks?
No. It does not provide social features, automatic cloud sync, segments, coaching plans, or community leaderboards. It is intended as a local analytics vault that complements cloud platforms rather than replacing them.
How does FIT Dashboard differ from Garmin-Grafana?
Garmin-Grafana, also developed by Arpan Ghosh, is a Docker-based pipeline that ingests daily health metrics from Garmin Connect into an InfluxDB database, then visualises them in Grafana. FIT Dashboard focuses specifically on individual activity files, requires no Docker for the desktop install, and targets users who found the Grafana stack too technical to maintain.
What technologies is FIT Dashboard built with?
A Rust backend for native FIT parsing and data processing, a DuckDB embedded analytical database for fast aggregations and downsampling, a React frontend, MapLibre GL for the interactive mapping, and the Tauri framework to package the desktop app. Apache ECharts powers the telemetry charts.
Summary
For athletes who care about data ownership, privacy, and speed, FIT Dashboard is a highly capable alternative to cloud-bound analytics. It does not replace the social aspects of Strava or the dynamic coaching plans of TrainingPeaks. But as an offline, high-performance vault for your Garmin data.
- Download: FIT Dashboard GitHub repository
- Official website: https://fitdashboard.app
- Author: Arpan Ghosh,
- Edited by: tfk, the5krunner
Last Updated on 29 June 2026 by the5krunner
My favourite kit and nutrition
- Injinji – Runners protect your toes. Avoid discomfort and minor injury. Run more. Run faster. I use them.
- Garmin 90-degree charging adapter — The small adapter that keeps your charging cables tidy. Essential for race day. I use one.
- Garmin charging puck — the fastest and most reliable way to top up your Garmin before a session. I use one.
- Ravemen FR300 — Front light that mounts directly under your Garmin or Wahoo head unit. Keeps your bars clean and your beam pointed where it matters. I use one.
- Body Glide – The blue anti-chafe stick that all swimmers and many runners use. I use it.
- Maurten — The race nutrition trusted by elite athletes. Gels and drink mixes engineered to be easy on the stomach. I use them.
- Garmin Varia RTL515 — A radar rear light that alerts you to vehicles approaching from behind. Pairs with your Edge or Garmin watch. I use this model.
- Favero Assioma Pro RS2 — The power-meter pedals most serious cyclists choose. Accurate, easy to move between bikes. I use this model.
- Garmin Forerunner 970 — A serious choice for a pro-grade triathlon watch. I use this.
- Polar H10 — My daily driver for accurate, waking HRV readings.
- Wahoo ELEMNT Roam 3 — The bike computer that has the feature Garmin lacks: usability. I use mine on most rides.
Reader-Powered Content

This content is not sponsored. It’s mostly me behind the labour of love, which is this site, and I appreciate everyone who supports it.
Support the site: Follow (free, fewer ads) · Subscribe (paid, ad-free) · Buy Me A Coffee ❤️
All articles are written by real people, fact-checked, and verified for originality. See the Editorial Policy. FTC: Affiliate Disclosure — some links pay commission. As an Amazon Associate, I earn from qualifying purchases.

tfk is the founder and author of the5krunner, an independent endurance sports technology publication. With 20 years of hands-on testing of GPS watches and wearables, and competing in triathlons at an international age-group level, tfk provides in-depth expert analysis of fitness technology for serious athletes and endurance sport competitors. ID
