Ground Contact Time (GCT)
Accuracy
Sufficient for trend tracking; mean absolute error 5–15 ms from chest strap
Best for
Monitoring fatigue accumulation and cadence-driven form changes within a training cycle
Weakness
Strongly pace-dependent — a single reading without effort context carries limited meaning.
In Plain English: GCT is the amount of time your foot is in contact with the ground from heel strike to toe off. A lower value is better, indicating greater leg spring stiffness and more effective storage and release of elastic energy in the Achilles tendon and plantar fascia. Value ranges from approximately 160 ms in fast, well-trained runners to over 300 ms, with an average population range of 218-248 ms. Age and sex do not materially alter the interpretation, but heavier, less-experienced runners will have higher GCT.
In practice: I have found little use for ground contact time in my training. Attempts to improve it by running drills had no noticeable effect at any given speed-cadence combination. The number sits firmly in the interesting rather than actionable category. My GCT falls with speed but reaches a floor of just over 200ms, which it will not drop below regardless of speed increases. Fatigue produces a clear signature in some runs over 60 minutes, where form changes, and a reading above 245ms often indicates fatigue has set in. Beyond getting fitter and running faster, I have found no way to improve the metric in isolation.
| Zone | Percentile | Ground Contact Time |
|---|---|---|
| Purple | Top 5% | Below 218 ms |
| Blue | 70–95th | 218–248 ms |
| Green | 30–69th | 249–277 ms |
| Orange | 5–29th | 278–308 ms |
| Red | Bottom 5% | Above 308 ms |
Frequently Asked Questions
What is a good ground contact time for running?
The answer depends on the pace. At an easy conversational pace, values of 260 to 290 ms are typical for recreational runners and are not indicative of poor form. Values below 250 ms are characteristic of faster efforts or experienced runners at pace — compare readings at consistent effort levels, not across sessions run at different speeds.
Why is my ground contact time always in the red zone?
Red zone readings at an easy or moderate pace are normal and do not indicate a form problem. Garmin’s colour zones represent percentile benchmarks across the running population and are not pace-adjusted — run the same route at a harder effort, and the reading will typically move into green or better.
How do I improve my ground contact time?
The most direct lever is to increase cadence by 5 to 10% above the natural preferred rate, which produces a proportional reduction in contact time at any fixed speed. Long-term plyometric and reactive strength work — single-leg hops, bounding drills, and depth jumps — develops the leg-spring stiffness that sustains shorter contact times across a range of paces.
What is the difference between ground contact time and ground contact time balance?
Ground contact time is the absolute duration in milliseconds that one foot spends on the ground per stride. Ground contact time balance compares left- and right-foot contact durations, expressed as a percentage, and requires a chest strap or Running Dynamics Pod — the wrist accelerometer cannot resolve left- and right-foot events independently.
Ground Contact Time — A Deep Dive
Is Ground Contact Time Useful?
- Box jumps, ankle hops, and other plyometric drills have made me faster, but at any given speed-cadence combination, my GCT has not noticeably changed.
- On a recent long run, my GCT rose above 240ms sooner than expected, after around 50 minutes, reflecting the fatigue I had brought into the run. It did little more than provide further evidence of how I felt. It was not actionable.
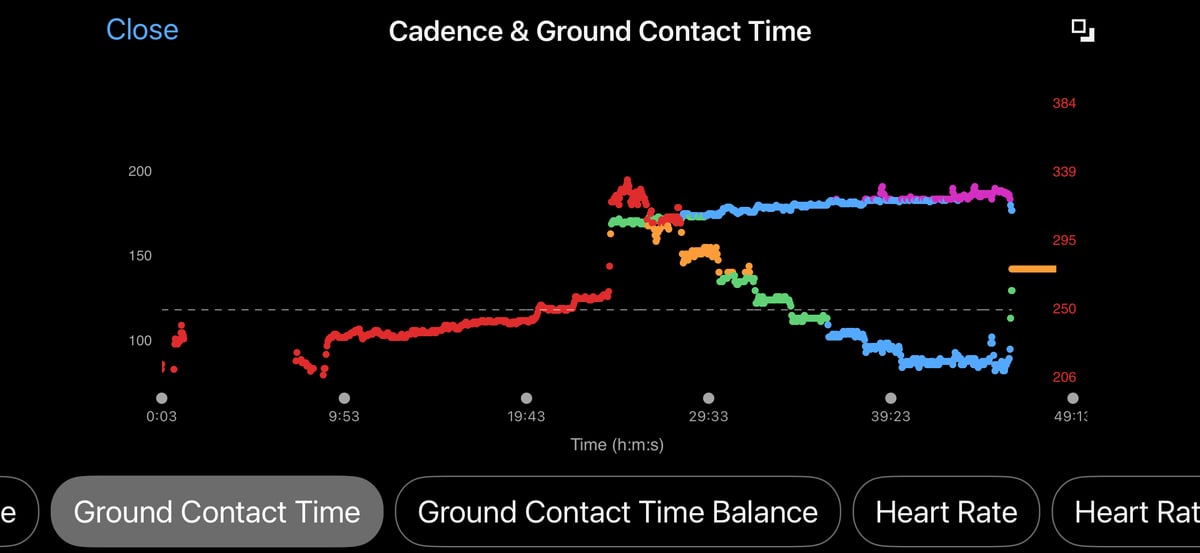
- The chart below shows a treadmill ramp test in which cadence progressively increases with speed. GCT falls throughout, but what I found interesting is that it reached a floor of 206ms before my cadence reached any apparent ceiling.
Introduction
Ground contact time is the duration, measured in milliseconds, that one foot remains in contact with the ground during each stride. Shorter ground contact time is associated with more efficient use of elastic energy and is characteristic of faster, more experienced runners.
Garmin introduced ground contact time as part of its Running Dynamics suite in 2014 alongside the Forerunner 620 and HRM-Run chest strap. The metric is one of six core running dynamics values and is mathematically related to cadence. At any fixed running speed, increasing cadence necessarily reduces ground contact time, because the foot must leave the ground sooner to accommodate the higher step rate. The principal caveat is that ground contact time is strongly pace-dependent — a runner recording values in Garmin’s red zone at easy pace will typically record green or better at threshold effort, and comparing readings across different paces without accounting for speed is a common source of misinterpretation.
How Garmin Calculates It
Ground contact time is derived from the timing of foot-strike and foot-off events detected by a triaxial accelerometer. When a compatible chest strap or Running Dynamics Pod is worn, the accelerometer in the sensor module captures the deceleration signature at foot-strike and the acceleration at toe-off; the interval between these two events is ground contact time for that stride. When wrist-based measurement is used, the watch’s own accelerometer derives the same timing from the arm-swing deceleration pattern associated with each foot-strike. Absolute values from the wrist are not directly comparable to those from a chest strap or pod — Garmin calibrates the colour zone thresholds separately for each sensor position to account for this offset.
The metric is calculated only while running. If the pace drops to walking speed during a session, the running dynamics display does not update until running resumes. No heart rate input is required for ground contact time calculation.
What Affects the Reading
Terrain and footwear both influence the reading independently of fitness or form. Soft surfaces — grass, sand, and trail — increase ground contact time relative to road running at identical effort because the foot extends the contact phase on a yielding surface. Highly cushioned shoes may marginally increase ground contact time at identical effort, though the effect varies with midsole properties and individual mechanics. i.e. supershoes and cheap cushioned shoes are both cushioned, but the former return more energy and will almost certainly have lower GCT.
Sensor position is a material hardware factor: values from a chest strap, from the Running Dynamics Pod at the waist, and from the wrist accelerometer are each calibrated independently and are not designed to produce identical absolute values. Switching sensor type mid-programme creates a discontinuity in trend data that resembles a form change but is an artefact of measurement position.
Pace is the dominant physiological variable: ground contact time decreases markedly as running speed increases, regardless of fitness level. Fatigue produces a characteristic pattern — ground contact time lengthens, cadence drops, and vertical oscillation increases — as neuromuscular output declines under sustained load. Both effects are expected and reversible with recovery.
Point 5 — Cushioned shoes. This is a fair critique. The research file notes the effect is “marginal” but does not cite a specific study. The suggested replacement is weaker than necessary — the current wording is defensible as a qualified claim. A middle path: “Highly cushioned shoes may marginally increase ground contact time at identical effort, though the effect varies with midsole properties and individual mechanics.” Accept the critique in principle, use tighter wording than ChatGPT’s suggestion.
How Accurate Is It
Validation studies using force plate and high-speed video analysis as reference standards find that chest-strap-based ground contact time measurements yield mean absolute errors of 5 to 15 ms, representing approximately 3 to 6% of typical values for recreational runners — sufficient for trend tracking but not for clinical bilateral assessment. Research by Morin et al. (2006) established quantitative relationships among ground contact time, leg spring stiffness, and running speed, confirming the metric’s validity as a group-level performance indicator. However, its use at the individual level requires caution.
Wrist-based measurement carries higher uncertainty because the accelerometer infers foot-contact timing from arm-swing kinematics rather than directly measuring the foot-ground event; the signal is also more susceptible to noise from arm-movement variation, cornering, and cross-body arm swing. No independent peer-reviewed validation of wrist-based ground-contact time against a force-plate reference has been published as of early 2026. Relative changes in a consistent runner at comparable paces, measured with the same sensor, are more reliable than any single absolute value.
Competitor Equivalents
- Stryd measures ground contact time from a foot sensor rather than the chest or wrist, making absolute values incomparable to Garmin’s, but it adds GCT capability to devices that lack native dynamics support.
- Polar (Vantage V3, Vantage M3) does not measure ground contact time natively; the metric is available only via a paired Stryd foot pod.
- Apple Watch (Series 6 and later, watchOS 9 and later) measures ground contact time natively using the wrist accelerometer. It displays it as a real-time workout metric and in the post-activity summary, but does not provide percentile colour zone benchmarks.
- Coros devices (PACE 3, PACE Pro, APEX 2, APEX 2 Pro, VERTIX 2, VERTIX 2S) gained native wrist ground contact time in Road Run and Track Run modes from September 2025, but do not offer a percentile colour gauge system, and absolute values have not been independently validated against Garmin’s.
- Suunto devices do not measure ground contact time natively; the metric is accessible only via a paired Stryd foot pod.
- Wahoo does not offer ground contact time measurement on any current device.
Which Garmin Devices Support It
Ground contact time is available on any Garmin watch capable of pairing with an ANT+ running dynamics accessory — including the HRM-Run, HRM-Tri, HRM-Pro Plus, HRM-600, HRM-Fit, and Running Dynamics Pod — and on all current Garmin OS devices via native wrist accelerometry introduced in March 2023. The HRM-Fit, HRM-Pro, and HRM-Pro Plus must be paired via ANT+ rather than Bluetooth; Bluetooth pairing only delivers heart rate data. The Forerunner 165, Venu 3, Venu 3S, and Vívoactive 6 support wrist dynamics but cannot pair external accessories, meaning Ground Contact Time Balance is unavailable on these devices. Verify current compatibility against the Garmin support FAQ before publishing, as firmware updates alter the supported device list.
Where to Find It
- Activity data field: configurable during any recorded run on all supported devices; displays the current value in milliseconds with the colour zone indicator.
- Widget glance: available as part of the running dynamics post-run summary widget glance on supported devices.
- Watch face complication: not available.
- Garmin Connect mobile: Activity detail → Running Dynamics → select ground contact time for a lap-by-lap and time-series breakdown with colour gauge overlay; historical cross-activity trend data is not aggregated into a standalone chart. No Connect Plus subscription required.
- Garmin Connect web: Activity detail → Running Dynamics; presentation is equivalent to the mobile app. No additional subscription required.
Common Problems and Misreadings
The most frequent source of confusion is a reading in the red or orange zone during an easy run, even though the runner feels they are moving efficiently. As explained in What Affects the Reading, pace is the dominant variable — longer ground contact time at an easy pace is expected and normal. The colour zones reflect population-wide percentile performance, not pace-adjusted benchmarks, so a reading of 290 ms at 6:00 per kilometre is unremarkable. See FAQ above for details.
A sudden apparent worsening late in a long run is similarly expected. The fatigue-driven pattern — lengthening ground contact time alongside cadence reduction — is described in What Affects the Reading. It resolves with recovery and is not evidence of a technique fault.
Values that differ substantially between outdoor and treadmill sessions do not indicate a sensor error. Treadmill running mechanics differ from overground running in measurable ways, and the belt surface affects foot contact timing differently than running on the road or trail. The difference reflects the environment, not a change in form.
How to Improve It
The most direct training lever is increasing cadence at a given pace. Research by Heiderscheit et al. (2011) found that raising step rate by 5 to 10% above a runner’s preferred rate reduces loading at the knee and hip without a meaningful increase in oxygen consumption; because cadence and ground contact time are mathematically coupled at fixed speed, that cadence increase produces a proportional reduction in contact time. Plyometric and reactive strength work — single-leg hops, bounding drills, and depth jumps at appropriate volumes — develops the leg-spring stiffness that sustains shorter ground contact times across a range of paces.
Progressive improvement in general fitness will lower ground contact time naturally as sustainable running speed increases. Monitor the metric at consistent effort levels across a training cycle and look for a downward trend over weeks and months. Session-to-session variation across differing paces carries no meaningful information.
Scientific Basis
Morin JB, Jeannin T, Chevallier B, Belli A. Spring-Mass Model Characteristics During Sprint Running. International Journal of Sports Medicine. 2006. Established that shorter ground contact time reflects greater leg-spring stiffness and more effective elastic energy return, providing the primary biomechanical rationale for the metric as a performance indicator. PMID 16475063.
Heiderscheit BC, Chumanov ES, Michalski MP, Wille CM, Ryan MB. Effects of Step Rate Manipulation on Joint Mechanics during Running. Medicine and Science in Sports and Exercise. 2011. Found that a 5 to 10% increase in step rate above preferred cadence reduces knee and hip loading without increasing oxygen consumption, establishing the principal training rationale for cadence-based ground contact time reduction. PMID 20581720.
Moore IS. Is There an Economical Running Technique? A Review of Modifiable Biomechanical Factors Affecting Running Economy. Sports Medicine. 2016. Identified cadence and ground contact time among the modifiable biomechanical variables most consistently associated with running economy, while noting that the scope for intervention differs between experienced and recreational runners. PMID 26816209.
Tartaruga MP et al. The Relationship between Running Economy and Biomechanical Variables in Distance Runners. Research Quarterly for Exercise and Sport. 2012. Reported significant negative associations between vertical oscillation and running economy at submaximal speeds, with ground contact time as a correlated variable in the biomechanical profile of economical runners. PMID 22978185.
How It Connects to Other Features
Ground contact time is one of the six Running Dynamics metrics and is mathematically coupled to cadence — at fixed speed, any increase in cadence reduces ground contact time proportionally. Its companion metric [LINK: ground-contact-time-balance] compares left and right foot contact durations from the same sensor event stream; balance requires a chest strap or Running Dynamics Pod, as the wrist accelerometer cannot independently resolve left and right foot events.
Garmin’s Running Economy feature requires the full output of the HRM-600 chest strap, which includes ground contact time alongside vertical oscillation, ground contact time balance, and Step Speed Loss; using a non-HRM-600 sensor reduces Running Economy accuracy or prevents calculation entirely. Ground contact time data is also recorded in the activity file that underlies Training Status and Training Load analysis, and the metric shares accelerometer hardware with Running Power, which uses a distinct calculation pipeline.
