Garmin Training Load
Directional 7-day trend is reliable; per-session figure carries uncertainty
Athletes building weekly volume who want a single number to confirm training is accumulating productively
Measures physiological stress only — does not capture muscular strain
Quick answers
What is a good Training Load number on Garmin?
There is no universally good number — Garmin calculates a personalised target range from each athlete’s training history, so the appropriate figure differs between a recreational runner and an experienced marathoner. The classification shown on the watch — Optimal, High, or Low — is the relevant signal, not the absolute figure itself.
Why did my Training Load drop when I did not rest?
The figure is a rolling seven-day sum, so when a hard session from the previous week exits the window, the total falls even if current training has continued normally. Check whether a demanding session from eight or more days ago has rolled off the window — this is the most common cause of an unexpected drop.
Does Garmin Training Load count strength training?
Recorded strength sessions contribute to Training Load if heart rate data were captured throughout, but typically generate less EPOC per minute than sustained aerobic effort. The contribution is therefore smaller than that of an equivalent-duration run or ride.
Why does Garmin show Training Load as unavailable?
Training Load requires a valid VO2 max estimate stored on the device. Complete several outdoor GPS runs or rides with continuous heart rate to allow the watch to establish one — indoor or treadmill sessions may not qualify for initial calibration.
Garmin Training Load — A Deep Dive
When Training Load Is Actually Useful
- Following a structured plan, Training Load is my sense check that progression is actually happening. Plans build load progressively over weeks, and the bar chart should show that accumulation clearly — if it is flattening or dropping during a build phase, something is wrong.
- After a heavy weekend of long rides and runs, I use it to confirm whether I have pushed too far. A big weekend in isolation is usually fine, but arriving at it off the back of an already hard week is where problems start — this metric tells me quickly whether I have crossed that line.
- After a holiday or extended rest, it is a useful wake-up call. That dial needs to be back in the green before I start chasing fitness again.
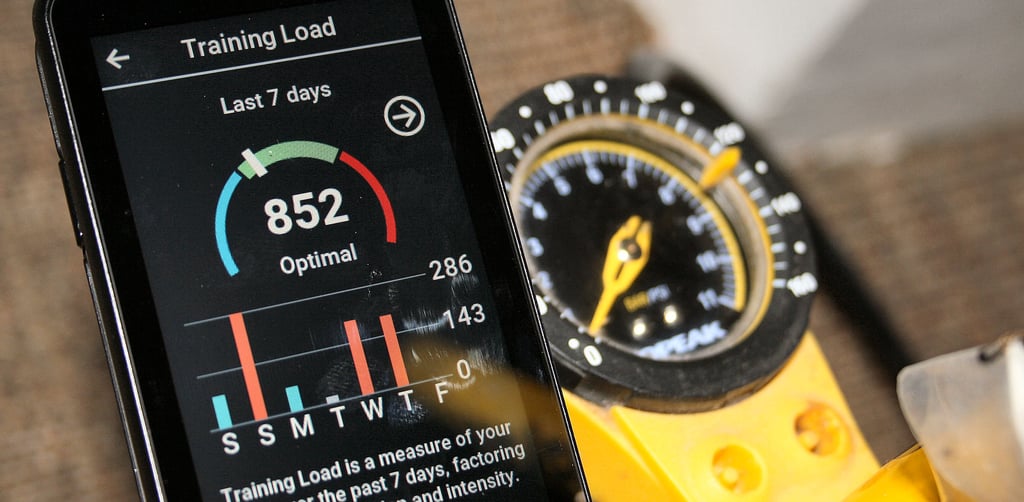
Training Load measures how much physiological stress an athlete has accumulated from exercise over the past seven days. Garmin Training Load is a rolling seven-day figure calculated from the excess post-exercise oxygen consumption (EPOC) generated by each recorded session. It rises as volume and intensity increase and falls during rest or easy periods. Garmin uses it as a primary input to Training Status, Recovery Time, and Daily Suggested Workouts. It does not measure cumulative fitness development, which accumulates over weeks and months rather than days.
What the Number Actually Means
Neither a high nor a low load is inherently desirable. Garmin presents the figure alongside a personalised target range derived from training history. A load within that range is classified as Optimal. A load above the upper bound is classified as High. A load below the lower bound is classified as Low. Athletes with higher aerobic fitness generate lower EPOC values for equivalent efforts, so the appropriate range shifts upward as fitness improves.
How Garmin Calculates It
Garmin calculates Training Load using the Firstbeat Analytics EPOC method. During a recorded activity, the algorithm models real-time oxygen consumption from heart rate data, quantifying the physiological disturbance caused by each effort as the volume of additional oxygen the body will require to return to its resting state. The seven-day figure is the total of EPOC values from all qualifying activities in the rolling window. Sessions recorded without heart rate, or where the signal drops for extended periods, contribute a reduced or zero load figure.
The calculation requires a valid VO2 max estimate stored on the device. Where none exists, Training Load displays as unavailable until sufficient qualifying activities have been recorded to establish one.
| Category | Definition | Fitness Impact |
| Low | Below personalised range | Risk of detraining; unlikely to improve fitness |
| Optimal | Within personalised range | Ideal for maintaining or improving fitness |
| High | Above personalised range | Potential for overreaching; may hinder results |
What Affects the Reading
Heart rate data quality is the single greatest source of variation. Optical wrist sensors are susceptible to movement artefacts during high-cadence running, cycling sprints, and strength training; a degraded signal causes the EPOC model to underestimate the physiological cost of that session. A chest strap consistently produces a more accurate input. Environmental heat elevates heart rate independently of mechanical effort. Hence, an easy run in high ambient temperatures generates a higher EPOC estimate than the same run in cool conditions — the algorithm treats cardiovascular drift from heat identically to drift from genuine exertion.
Activity type affects load contribution per unit of perceived effort. A one-hour swim and a one-hour run at equivalent heart-rate intensities produce different EPOC values because their physiological stress profiles differ. Strength and resistance sessions contribute to Training Load but typically generate lower EPOC values than cardiovascular sessions of equivalent duration, meaning athletes with substantial strength work in their programmes may find the load figure understates overall fatigue. The seven-day rolling window also creates step changes: as hard sessions age out, the figure drops in discrete steps rather than continuously.
How Accurate Is It
The EPOC method has been validated in laboratory settings. Firstbeat published internal accuracy data prior to the 2020 acquisition, showing correlation between modelled EPOC and laboratory-measured oxygen debt. A 2013 study by Plews et al. in Sports Medicine found that EPOC-based load models correlated meaningfully with performance adaptation over time in elite endurance athletes, while noting that individual variability in heart rate response limits the precision of any single-session estimate.
The key distinction is between absolute accuracy and directional reliability. The absolute EPOC figure for any session carries meaningful uncertainty, particularly from wrist optical heart rate. The trend in load over consecutive weeks is more reliably informative than any single week’s figure. Published evidence on Garmin’s specific implementation is limited; research typically examines EPOC-based methods in general rather than validating proprietary consumer products against laboratory standards.
Competitor Equivalents
- Polar’s Training Load Pro uses its own strain-scoring method derived from heart rate and HRV, segmented into cardiovascular, muscular, and perceived strain components — a more granular breakdown than Garmin’s single EPOC-derived figure.
- Apple Watch added a 7-day Training Load metric in watchOS 11, calculated from heart rate, pace, elevation, age, height, and weight, with a manual RPE-like override rather than an EPOC model.
- Coros presents a rolling training load figure alongside a base fitness metric; the calculation method is proprietary and undisclosed.
- Suunto’s training load implementation draws on a methodology influenced by its historical Firstbeat partnership; post-acquisition devices use Suunto’s own algorithms, with a load-balance view comparing recent to historical load.
- Wahoo head units rely on TrainingPeaks for multi-sport rolling load, using the Training Stress Score model derived from power or pace rather than EPOC.
Which Garmin Devices Support It
Garmin introduced Training Load in 2017 on the Forerunner 935. [EDITOR: verify before publishing] The feature is available across all current mid-tier and flagship watch and cycling computer families: Fenix, Enduro, Tactix, Quatix, D2, Forerunner (mid-tier and above), Venu (mid-tier and above), Epix, MARQ, and Edge 540, 840, and 1050. The Instinct series offers partial support — Training Status is available, but the full load-balancing features are absent. The Forerunner 55, Vivoactive series, and Lily series sit below the tier at which Training Load becomes available.
Where to Find It
- Watch widget: displays the current seven-day load figure, personalised target range, load classification, and a bar chart of daily contributions for the current window.
- Widget glance: load figure and classification visible at a glance on Fenix 8 and Forerunner 970 generation devices.
- Morning Report: Training Load summary included on Fenix 8 series, Forerunner 970, and Forerunner 570.
- Garmin Connect app: Performance Stats section under Health & Performance; current figure, target range, and approximately four weeks of historical trend data.
- Garmin Connect web: Performance section; current figure and classification presented with less interactive trend data than the mobile app.
Training Load is a post-activity aggregate metric with no real-time display during exercise.
Common Problems and Misreadings
A sharp drop in Training Load after a rest day or recovery week is expected behaviour, not a sign of fitness decline. As hard sessions age out of the seven-day window, the figure falls in discrete steps. Training Status should contextualise whether the reduction represents a productive taper or genuine detraining. See FAQ above for detail.
A hard effort that produces a smaller load contribution than expected usually means heart rate was suppressed during the session — through medication, fatigue-induced cardiac drift, or wrist sensor dropout. Confirm the quality of heart rate data in the activity file as the first diagnostic step.
Athletes training across multiple sports may find load rises more slowly during cycling- or swimming-heavy weeks. This reflects genuine differences in EPOC generation across modalities rather than a measurement error. A cycling-heavy week and a running-heavy week with identical load figures represent meaningfully different physiological stimuli.
How to Improve It
Raising Training Load requires increasing training volume, intensity, or both. A sustainable approach is to increase volume at predominantly aerobic intensities before escalating intensity — adding time to easy and moderate sessions produces a gradual upward shift with lower injury and overtraining risk. At least one session per week at threshold intensity or above is needed to generate meaningful EPOC; a single quality session lifts the load figure more than an equivalent duration of easy running.
Consistency across the full seven-day window is more productive than clustering training. Four evenly distributed sessions produce more stable load accumulation than two back-to-back hard days followed by five rest days, even with identical total training time, and reduce the step-change effect as sessions exit the window.
Other Points
Research on detraining indicates that cardiovascular fitness begins to decline measurably within two to three weeks of inactivity. Coyle et al. (1984), writing in the Journal of Applied Physiology, found that trained athletes lost a significant proportion of aerobic capacity within 21 days of stopping structured training, with the sharpest decline in the first two weeks. A sustained low Training Load figure over this period is consistent with the physiological conditions under which detraining occurs.
Scientific Basis
Firstbeat Technologies. Excess Post-Exercise Oxygen Consumption (EPOC) as an Indicator of Exercise Stress. Firstbeat White Paper, 2014. Establishes the methodological framework for using modelled EPOC as a quantitative load metric in consumer wearables.
Bangsbo, J., Krustrup, P., González-Alonso, J., and Saltin, B. (2001). ATP production and efficiency of human skeletal muscle during fatiguing exercise at different temperatures. Journal of Physiology, 532(3), 647–658. Provides physiological grounding for the EPOC construct underpinning load calculation.
Plews, D.J., Laursen, P.B., Stanley, J., Buchheit, M., and Kilding, A.E. (2013). Training adaptation and heart rate variability in elite endurance athletes. Sports Medicine, 43(9), 773–781. Validated physiological stress metrics derived from heart rate monitoring as markers of training adaptation.
Halson, S.L. (2014). Monitoring training load to understand fatigue in athletes. Sports Medicine, 44(Suppl 2), S139–S147. Examined the relationship between quantified training load and fatigue markers across endurance sports, finding rolling load metrics correlated with overreaching indicators when load rose sharply without adequate recovery.
How It Connects to Other Features
Training Load is the primary numerical input to Training Status, which interprets the current load figure in the context of the VO2 max trend to produce an actionable classification. The acute load figure is compared against the chronic baseline tracked by [LINK: chronic-load]; their ratio informs [LINK: training-load-ratio], which flags whether recent training stress falls within a range associated with productive adaptation or elevated injury risk.
Recovery Time is calculated partly from the EPOC contribution of the most recent activity, so high-load sessions lengthen recovery estimates directly. Training Readiness incorporates the current load as a suppressive factor in its daily composite score.
Daily Suggested Workouts uses Training Load as a scheduling input, shifting toward easy or recovery sessions when load is high or recovery time is elevated.
