Garmin Training Readiness
Garmin Training Readiness is a composite score, expressed as a number from 0 to 100, that indicates how prepared an athlete’s body is to handle a training load on a given day. It appears each morning on compatible watches and consolidates several physiological signals into a single actionable figure.
Garmin uses Training Readiness to help athletes decide whether to train hard, train moderately, or prioritise recovery. The score reflects yesterday and last night rather than the weeks ahead, meaning it captures short-term readiness rather than a long-term fitness trajectory.
What the Number Actually Means
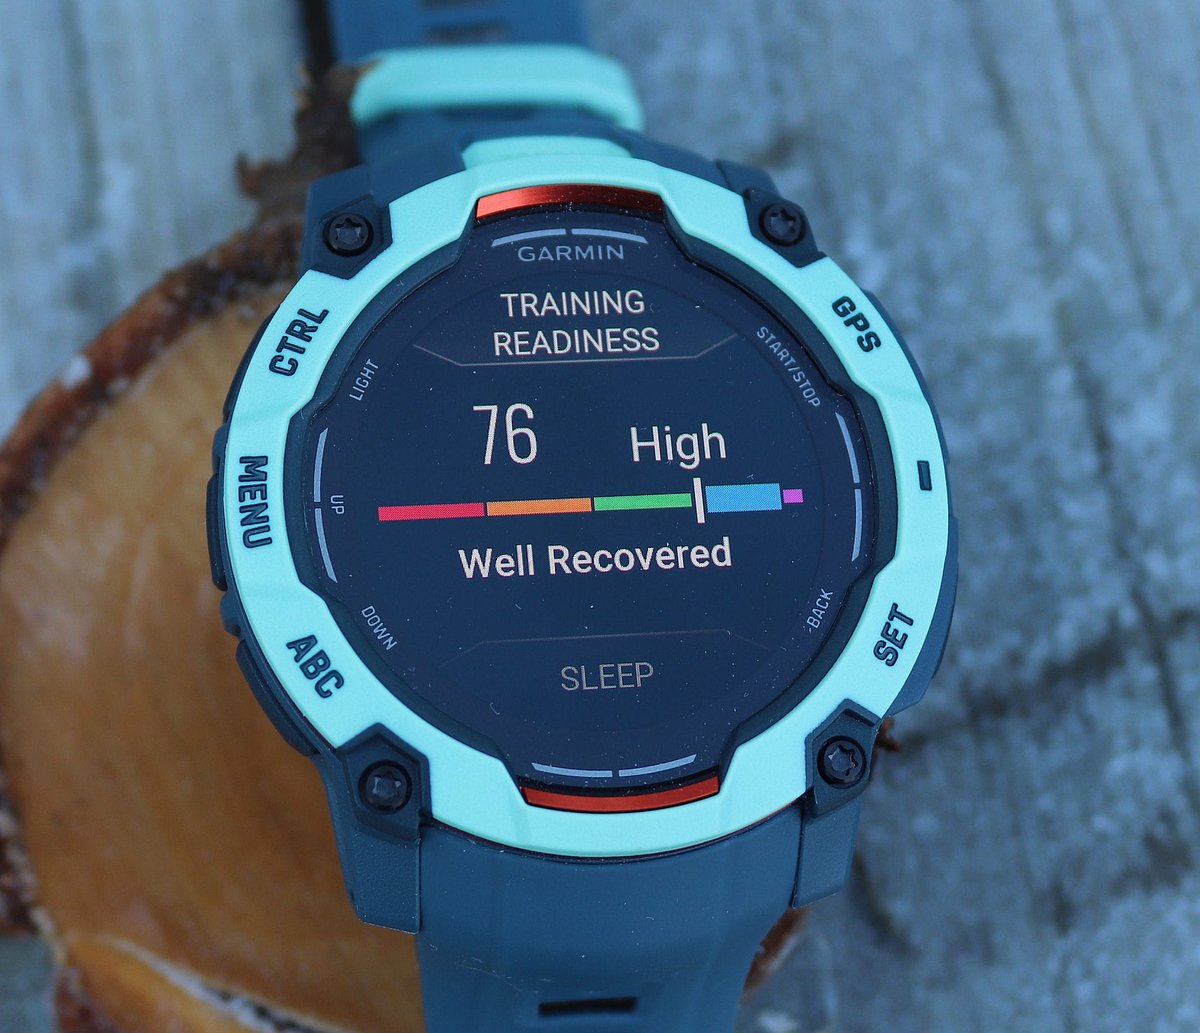
A score of 73 to 100 indicates the body is well-recovered and prepared for demanding effort. Garmin labels this range as Ready or Prime, and the watch may suggest a harder session within the Daily Suggested Workouts feature.
A score below 34 indicates accumulated fatigue or insufficient recovery. Garmin labels this range as Low or Poor. Training hard in this state does not produce the intended physiological adaptation; it compounds fatigue.
Mid-range scores, roughly 34 to 72, indicate moderate readiness. An athlete in this range can train, but at reduced intensity. The score does not prescribe exact effort — it sets context for the day’s decision.
How Garmin Calculates It
Garmin processes data from the optical heart rate sensor and, where available, a chest strap, to derive the physiological inputs the score requires.
The score combines six contributing factors: sleep score, HRV status, remaining recovery time, acute training load, stress history, and Body Battery level. Each factor is assigned an unknown weighting, and the combined result is normalised to the 0–100 scale.
A minimum of three weeks of consistent wear data is required before the score stabilises. In the first days of use, the watch may display a partial score or no score at all while baseline HRV and load data accumulate.
Training Readiness uses a 0-100 scale with plain English explanatory messages.
| Score Range | Status | Color | Recommendation |
|---|---|---|---|
| 80-100 | Prime | Blue | You are at your best today! |
| 60-79 | Primed | Green | Ready for challenges |
| 40-59 | Recovering | Orange | Good to go |
| 20-39 | Strained | Red | Time to slow down |
| 0-19 | Very Strained | Dark Red | Let your body recover |
What Affects the Reading
Poor sleep quality disproportionately lowers the score. A short night with fragmented sleep stages produces a low HRV reading and a reduced sleep score, both of which feed directly into the Training Readiness calculation. A single disrupted night can drop the score by 20 or more points, even when overall fitness is high.
Alcohol consumption depresses HRV during sleep. The watch measures this effect physiologically rather than directly tracking intake. The resulting HRV suppression feeds into both the HRV Status component and the sleep score component, compounding the impact on Training Readiness.
Illness elevates resting heart rate and disrupts HRV. The score responds to these signals by trending lower during the acute phase of illness, often before an athlete consciously registers fatigue. This behaviour is consistent with the underlying physiology rather than an artefact of the algorithm.
Heat and high humidity elevate heart rate and suppress HRV independently of training load. Athletes training in hot conditions during a heat acclimatisation block may see Training Readiness scores that understate functional readiness relative to perceived state.
Wrist-based heart rate measurement introduces variability into the HRV component. The optical sensor on the watch measures pulse interval rather than true R-R interval, and motion artefacts during sleep can corrupt short segments of the overnight HRV recording. A chest strap worn during sleep cannot address this; the optical sensor is the only available input during overnight monitoring.
A very high acute training load from a hard block suppresses Training Readiness even when sleep and HRV are strong. The load component applies a penalty that persists for several days after a heavy training period, reflecting the physiological reality that accumulated fatigue takes time to clear, regardless of the quality of one night’s sleep.
How Accurate Is It
Training Readiness is a proprietary composite score, and Garmin has published no independent validation study measuring its accuracy against a reference standard such as laboratory-measured recovery markers. Firstbeat Analytics publishes white papers on the individual components — HRV-based recovery assessment and sleep staging. Still, a published error figure for the composite score itself is absent from the primary literature as of March 2026.
The score’s practical utility lies in general guidance and trend reliability rather than absolute precision. An athlete who consistently sees low scores after poor sleep and high scores after structured recovery blocks is receiving accurate directional information, even when the precise number is uncertain. Research on HRV-guided training, including work by Kiviniemi et al. (2007), supports the principle that HRV-informed training decisions lead to better fitness outcomes than fixed-schedule training, providing indirect evidence for the approach underlying the score.
Competitor Equivalents
- Polar — Nightly Recharge and the Readiness Score in Polar Flow. Polar’s readiness calculation incorporates sleep quantity and quality, along with autonomic nervous system recovery measured overnight. The calculation draws on similar HRV inputs to Garmin’s approach but weights nightly ANS recharge as a distinct component rather than integrating it into a six-factor composite.
- Coros — Recovery Indicator. Coros derives its recovery indicator from HRV, resting heart rate, and recent training load. The metric is expressed as a percentage rather than a 0–100 index, and the Coros implementation weights recent training load more heavily than Garmin’s six-factor composite does.
- Suunto — Body Resources. Suunto uses overnight HRV and sleep data to generate a readiness figure. The Suunto implementation draws on Firstbeat algorithms licensed before Garmin’s acquisition of Firstbeat in June 2020.
- Apple — No direct Training Readiness equivalent as of March 2026. Apple Watch surfaces sleep stages and HRV trends in the Health app, but aggregates these into a Vitals summary rather than a single daily readiness score on the watch face.
- Whoop — Recovery Score. Whoop combines HRV, resting heart rate, respiratory rate, and sleep performance into a single daily readiness percentage. Whoop uses a dedicated band worn continuously, which removes the activity-wear versus sleep-wear compromise inherent in a watch charged during the day.
Which Garmin Devices Support It
Training Readiness is part of the Training Status suite, introduced in January 2017; the feature has been refined with each subsequent platform update, with the current six-factor composite score established on the Fenix 6 generation.
Training Readiness is available on mid-range and flagship devices within the current Garmin OS generation. The Fenix 8 series — including the Fenix E, Enduro 3, Tactix 8, and Quatix 8 — carries full support, as do the Forerunner 970 and Forerunner 570. The Venu 4, vivoactive 6 and Venu X1 also support Training Readiness under the unified Garmin OS codebase.
Prior-generation devices — including the Forerunner 965, Forerunner 265, Epix Pro Gen 2, and Fenix 7 Pro — carry the feature but receive only maintenance firmware. These devices will not receive the updated Training Readiness weighting or display changes introduced alongside the Forerunner 970 in May 2025.
Training Readiness is absent from Edge bike computers and entry-tier devices, including the Forerunner 165 and Forerunner 55. The Instinct 3 line carries partial training intelligence, but Training Readiness is outside its feature set; the Instinct series prioritises rugged durability over the full training analytics suite. Training Readiness is part of the Training Status suite, which Garmin first introduced in January 2017, and has been refined with each subsequent platform update.
Where to Find It
On the watch, Training Readiness appears as a widget in the glance loop, accessible by swiping from the watch face on AMOLED models or pressing the up or down button on MIP models. The widget displays the current score, the breakdown of contributing factors, and a colour-coded readiness band.
On compatible devices, the score also appears in the Morning Report, which surfaces automatically when the watch is first raised after waking.
In Garmin Connect mobile, Training Readiness is accessible under the Performance Stats section, where a 30-day trend graph is available alongside the six contributing factor scores for the current day. The metric is visible on Garmin Connect web, but the contributing factor breakdown and trend graph are presented with less detail than in the mobile app. A Garmin Connect Plus subscription is not required to access Training Readiness.
Common Problems and Misreadings
The score is lower than expected after what felt like a good night’s sleep. This typically reflects HRV suppression from a source the athlete may not have registered — late eating, alcohol consumed earlier in the evening, elevated baseline stress, or the tail end of a high training load. The HRV component responds to physiological state rather than subjective sleep quality, and the two frequently diverge.
The score fluctuates widely day to day, with no obvious changes in training or sleep. Wide fluctuations in the first weeks of use occur as it builds its baseline. An athlete who varies sleep schedule significantly between weekdays and weekends will also see greater day-to-day variance because the optimal sleep window component changes as the watch adapts to irregular patterns.
Training Readiness reads high, but the athlete feels tired. The score represents an average across the contributing factors. A high sleep score combined with a very high training load can produce a mid-to-high readiness figure even when accumulated muscular fatigue is present, because muscular fatigue from resistance training or eccentric loading is largely invisible to an optical heart rate monitor.
The score reads zero or shows no data on the first morning after purchase. Training Readiness requires several days of baseline data — particularly sleep data and HRV recordings — before the algorithm produces a stable output.
The score drops sharply after a race or long run, even when that night’s sleep was good. The acute training load and recovery time components respond to the session’s intensity and duration. A marathon or hard interval session incurs a recovery-time cost that the algorithm maintains for 24 to 72 hours, regardless of sleep quality during that window, consistent with the physiology of post-exercise recovery.
How to Improve It
Sleep is the primary lever. Consistent sleep duration of seven to nine hours, maintained at regular times, raises both the sleep score component and the overnight HRV component simultaneously. Irregular bedtimes suppress HRV even when total sleep duration is adequate, so timing matters.
Managing acute training load prevents the score from remaining chronically suppressed. An athlete who trains hard every day accumulates a load that the readiness algorithm registers as a persistent recovery debt. Building structured easy days into the training week — days where heart rate and duration remain low enough to clear the acute load balance — allows the score to recover toward the high range between hard sessions.
Reduce evening sympathetic activation — late caffeine, screen exposure near bedtime, emotionally activating content — to improve overnight HRV. This is the stress history component of the score. An athlete who consistently sees low stress scores despite adequate sleep duration should examine evening habits before attributing the pattern solely to training load.
Other Points
Heart rate variability, the primary physiological signal underlying Training Readiness, has been linked in peer-reviewed research to all-cause mortality risk independently of traditional cardiovascular risk factors. Tsuji et al. (1994), publishing in Circulation, found that reduced HRV was associated with significantly elevated risk of cardiac death in a large community cohort, establishing that the signal Garmin’s algorithm monitors carries clinical significance beyond athletic recovery.
HRV declines measurably during periods of inactivity and detraining. Pober et al. (2004), publishing in Medicine and Science in Sports and Exercise, reported that HRV indices began to deteriorate within two to four weeks of training cessation in previously active adults, with the rate of decline steeper in older athletes. An athlete returning from injury or a rest period may therefore see persistently suppressed Training Readiness scores during the early weeks of a return-to-training block, reflecting genuine physiological deconditioning rather than inadequate recovery from recent sessions.
Frequently Asked Questions
- Why does Training Readiness say I’m ready when I feel exhausted? The score reflects physiological markers captured by the optical sensor overnight. Muscular soreness, cumulative mental fatigue, and motivation fall outside the scope of what a wrist sensor can measure. Treat a high score as one data point alongside subjective feel, not as an override of it.
- Does Training Readiness work without wearing the watch to sleep? The score degrades significantly without overnight data. The sleep score, HRV status, and Body Battery components all require continuous overnight monitoring. An athlete who charges the watch overnight will receive a score based on the remaining components — recovery time, acute load, and stress history — but the watch will flag that sleep data is missing, and the result will carry reduced weight.
- How long does it take for the score to become reliable? Allow three to four weeks of consistent overnight wear before treating the score as fully calibrated. During this period,d the watch builds HRV baseline values and sleep pattern recognition. Scores in the first week are directionally useful but may reflect the algorithm’s initialisation phase rather than true readiness.
- Does a high Training Readiness score mean that training hard is always the right choice? A high score indicates physiological readiness but does not account for where an athlete sits within a planned training cycle. An athlete in a scheduled recovery week should follow the recovery plan regardless of a high readiness score. The score informs decisions; it does not replace periodisation logic.
- Why is my Training Readiness lower than a training partner’s on the same watch? Training Readiness is calculated relative to each individual’s personal baseline HRV, sleep patterns, and training history. The scores are personal to the wearer and are not comparable between individuals. A score of 65 carries a different meaning on different bodies with different baselines.
- Can illness raise Training Readiness? Illness suppresses Training Readiness by elevating resting heart rate and disrupting HRV. An athlete who sees a rising score during a symptomatic period should cross-check against resting heart rate trends in Garmin Connect before treating the readiness score as reliable during that period.
Scientific Basis
Kiviniemi, A.M., Hautala, A.J., Kinnunen, H., Tulppo, M.P. (2007). Endurance training is guided individually by daily heart rate variability measurements. European Journal of Applied Physiology, 101(6), 743–751. This study demonstrated that HRV-guided training produced greater improvements in maximal oxygen uptake than fixed-schedule training, establishing the empirical basis for using daily HRV as a readiness marker.
Plews, D.J., Laursen, P.B., Stanley, J., Buchheit, M., Kilding, A.E. (2013). Training adaptation and heart rate variability in elite endurance athletes. Sports Medicine, 43(9), 773–791. This review examined HRV monitoring in elite athletes and identified the conditions under which HRV-based readiness assessment is most reliable, including the importance of consistent measurement timing and baseline stabilisation periods.
Firstbeat Technologies (2014). Sleep Detection and Analysis with Accelerometer and Heart Rate Data. Firstbeat Technologies white paper. This technical document describes the sleep staging algorithm embedded in Garmin’s training intelligence platform, covering the inputs used to classify sleep stages and derive the sleep score that contributes to Training Readiness. [EDITOR: confirm URL at firstbeat.com before publishing]
Firstbeat Technologies (2019). Stress and Recovery Analysis Method Based on 24-Hour Heart Rate Variability. Firstbeat Technologies white paper. This document describes the HRV-based stress and recovery methodology that underpins the HRV Status and Body Battery components of Training Readiness. [EDITOR: confirm URL at firstbeat.com before publishing]
How It Connects to Other Features
Training Readiness draws its HRV component from [LINK: hrv-status], which tracks overnight heart rate variability relative to a personal 60-day baseline. A deteriorating HRV Status directly suppresses Training Readiness. The two features share the same overnight measurement window but report at different levels of abstraction: HRV Status tracks a single physiological signal over time, while Training Readiness aggregates multiple signals into a single daily output.
The sleep score component is sourced from [LINK: sleep-score] and [LINK: sleep-stages], which classify each night’s sleep into light, deep, and REM phases. A night with adequate duration but poor deep sleep staging produces a lower sleep score input than one with proportionate stage distribution, and that difference propagates into Training Readiness.
Recovery time feeds the recovery time component. This figure derives from [LINK: recovery-time], which is calculated from the most recent activity’s Training Effect data. A long recovery time window suppresses Training Readiness in proportion to the number of hours remaining in it.
[LINK: body-battery] contributes to Training Readiness as a measure of energy reserves. Body Battery tracks the balance between stress and recovery events across the full 24-hour period, not just overnight sleep. An athlete who accumulates significant daytime stress — travel, work demands, emotional load — will see a depleted Body Battery that, in turn, lowers Training Readiness the following morning.
Training Readiness feeds downstream into [LINK: daily-suggested-workouts]. When Training Readiness is high, the watch weights its workout suggestions toward higher-intensity sessions. When the score is low, suggestions shift toward easy or recovery-targeted efforts. The two features share data but operate independently: an athlete can consult Training Readiness without using Daily Suggested Workouts, and the readiness score updates regardless of whether suggested workouts are followed.
[LINK: training-load] provides the acute load input to Training Readiness. A spike in training load — from a race, a long run, or an unplanned hard session — raises the acute load component and suppresses the readiness score for the following one to three days. Monitoring the Training Load trend alongside Training Readiness helps an athlete understand whether a low score reflects yesterday’s session specifically or a multi-day accumulation.
