COROS EvoLab – Sports Science 2.0
COROS has announced a major update to their entire platform with EvoLab, this is a series of sports physiology insights that rival almost all the popular Firstbeat features that Garmin includes on its sports platform. I’ve been using it in beta for the last week, and it’s good!
Most of the underlying science is widely used and COROS has re-purposed it to underpin their own algorithms and given us some nice visualisations of our capabilities, often using ‘plain English’ to help us better understand what it all means.
On this site, I often write a post about one company’s new feature X…just because it’s interesting. This stuff from COROS today is on a whole new level and represents a very significant addition to their platform, which puts their running offering up there with Polar and, to an extent, with Garmin too.
Coros EvoLab – What’s New?
From past experience, most people are interested in their VO2max and predicted race times, almost to the extent where the inclusion or absence of those two metrics would influence the purchase of a sports watch. Well, COROS has included & fine-tuned those calculations and the numbers are reasonable. However, COROS has also included a whole raft of what I consider to be far more important metrics that help guide your training on a weekly or daily basis.
Here’s a quick overview of what is included for all heart rate-based training and then some run-specific metrics. Afterwards, I’ll expand on some points of interest.
| Key Metrics – General Fitness
(all activity types)
|
Key Metrics – Road Running
(Run+Track Run)
|

OK, let’s go through the individual measures. I’ve tended to use images from COROS as they display better.
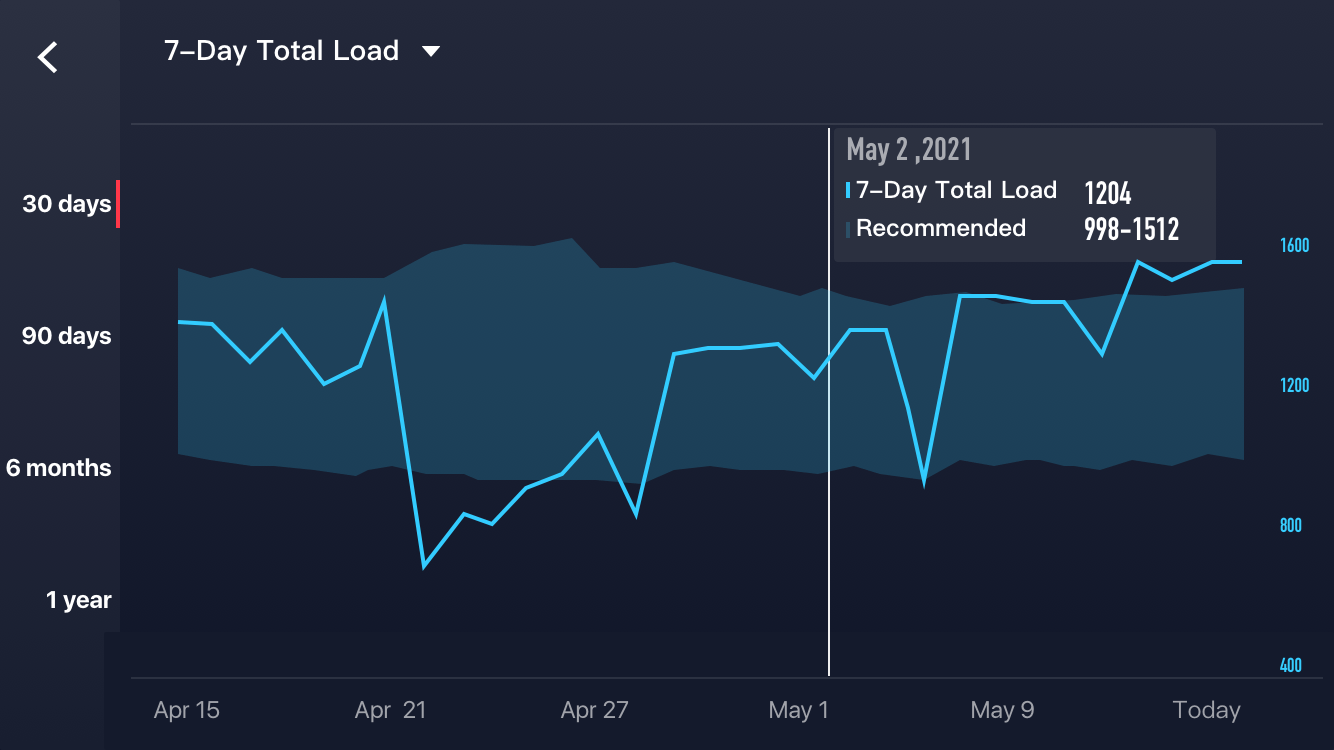
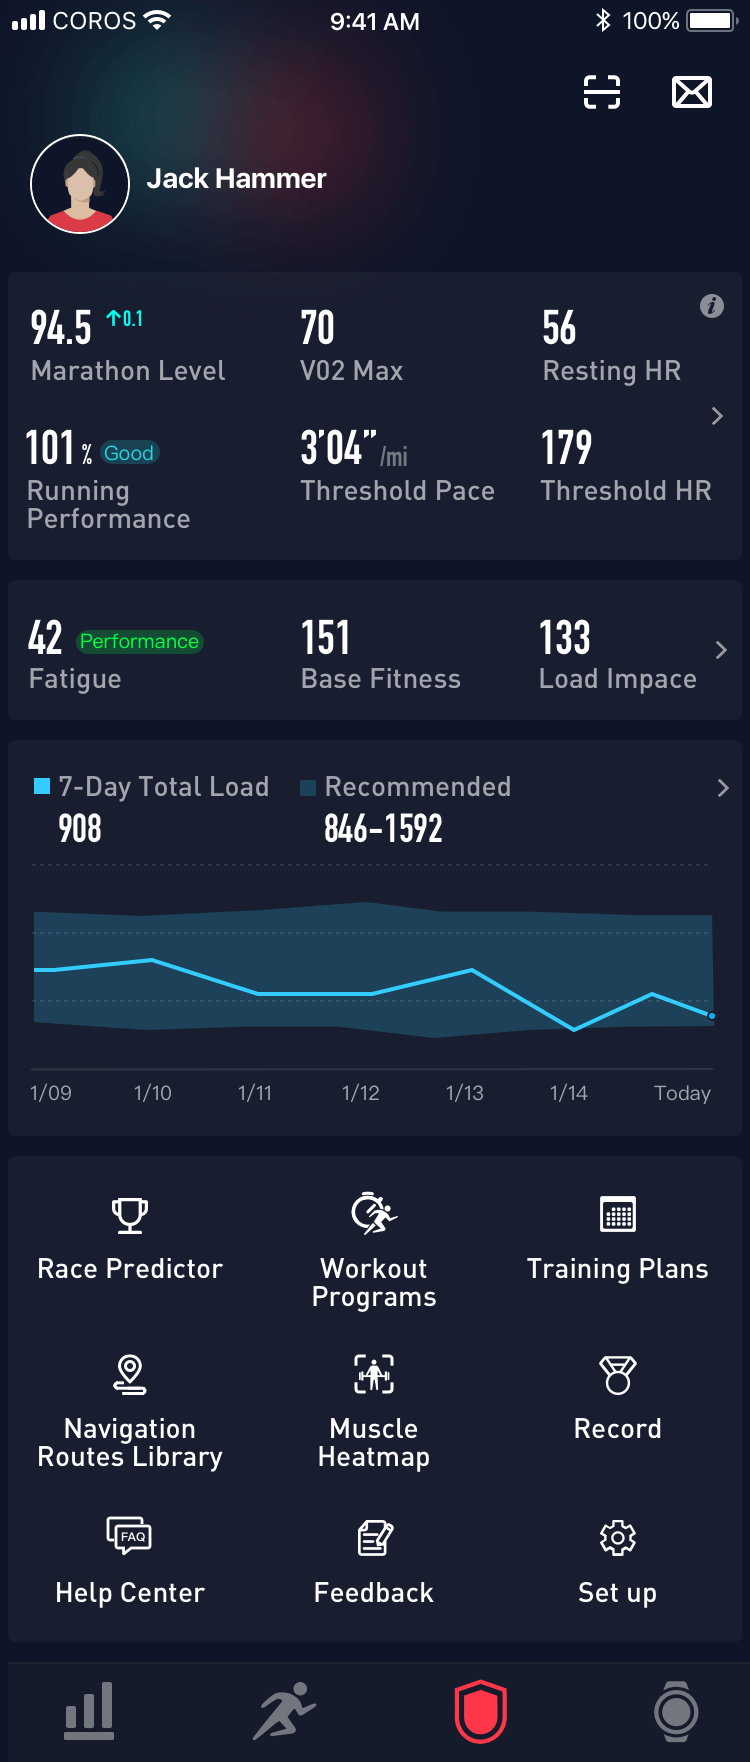
Training Load
All types of workouts are scored based on the amount of time you spend in each heart rate zone. If you spend more time in a higher heart rate zone, then you earn proportionately more training load points. Generally, your load wants to PROGRESSIVELY increase, and COROS handles the progression nicely by giving you a range within which to keep your training load. In this chart, the runner might consider easing off for a couple of days as they have broken out of the recommended range.
 Base Fitness
The accumulation of those points over 6 weeks will closely reflect your fitness or ability to train harder and longer. This chart reflects the reality of significant ups and downs in daily stresses but you will see the dark blue line is gradually increasing, as would your base fitness.
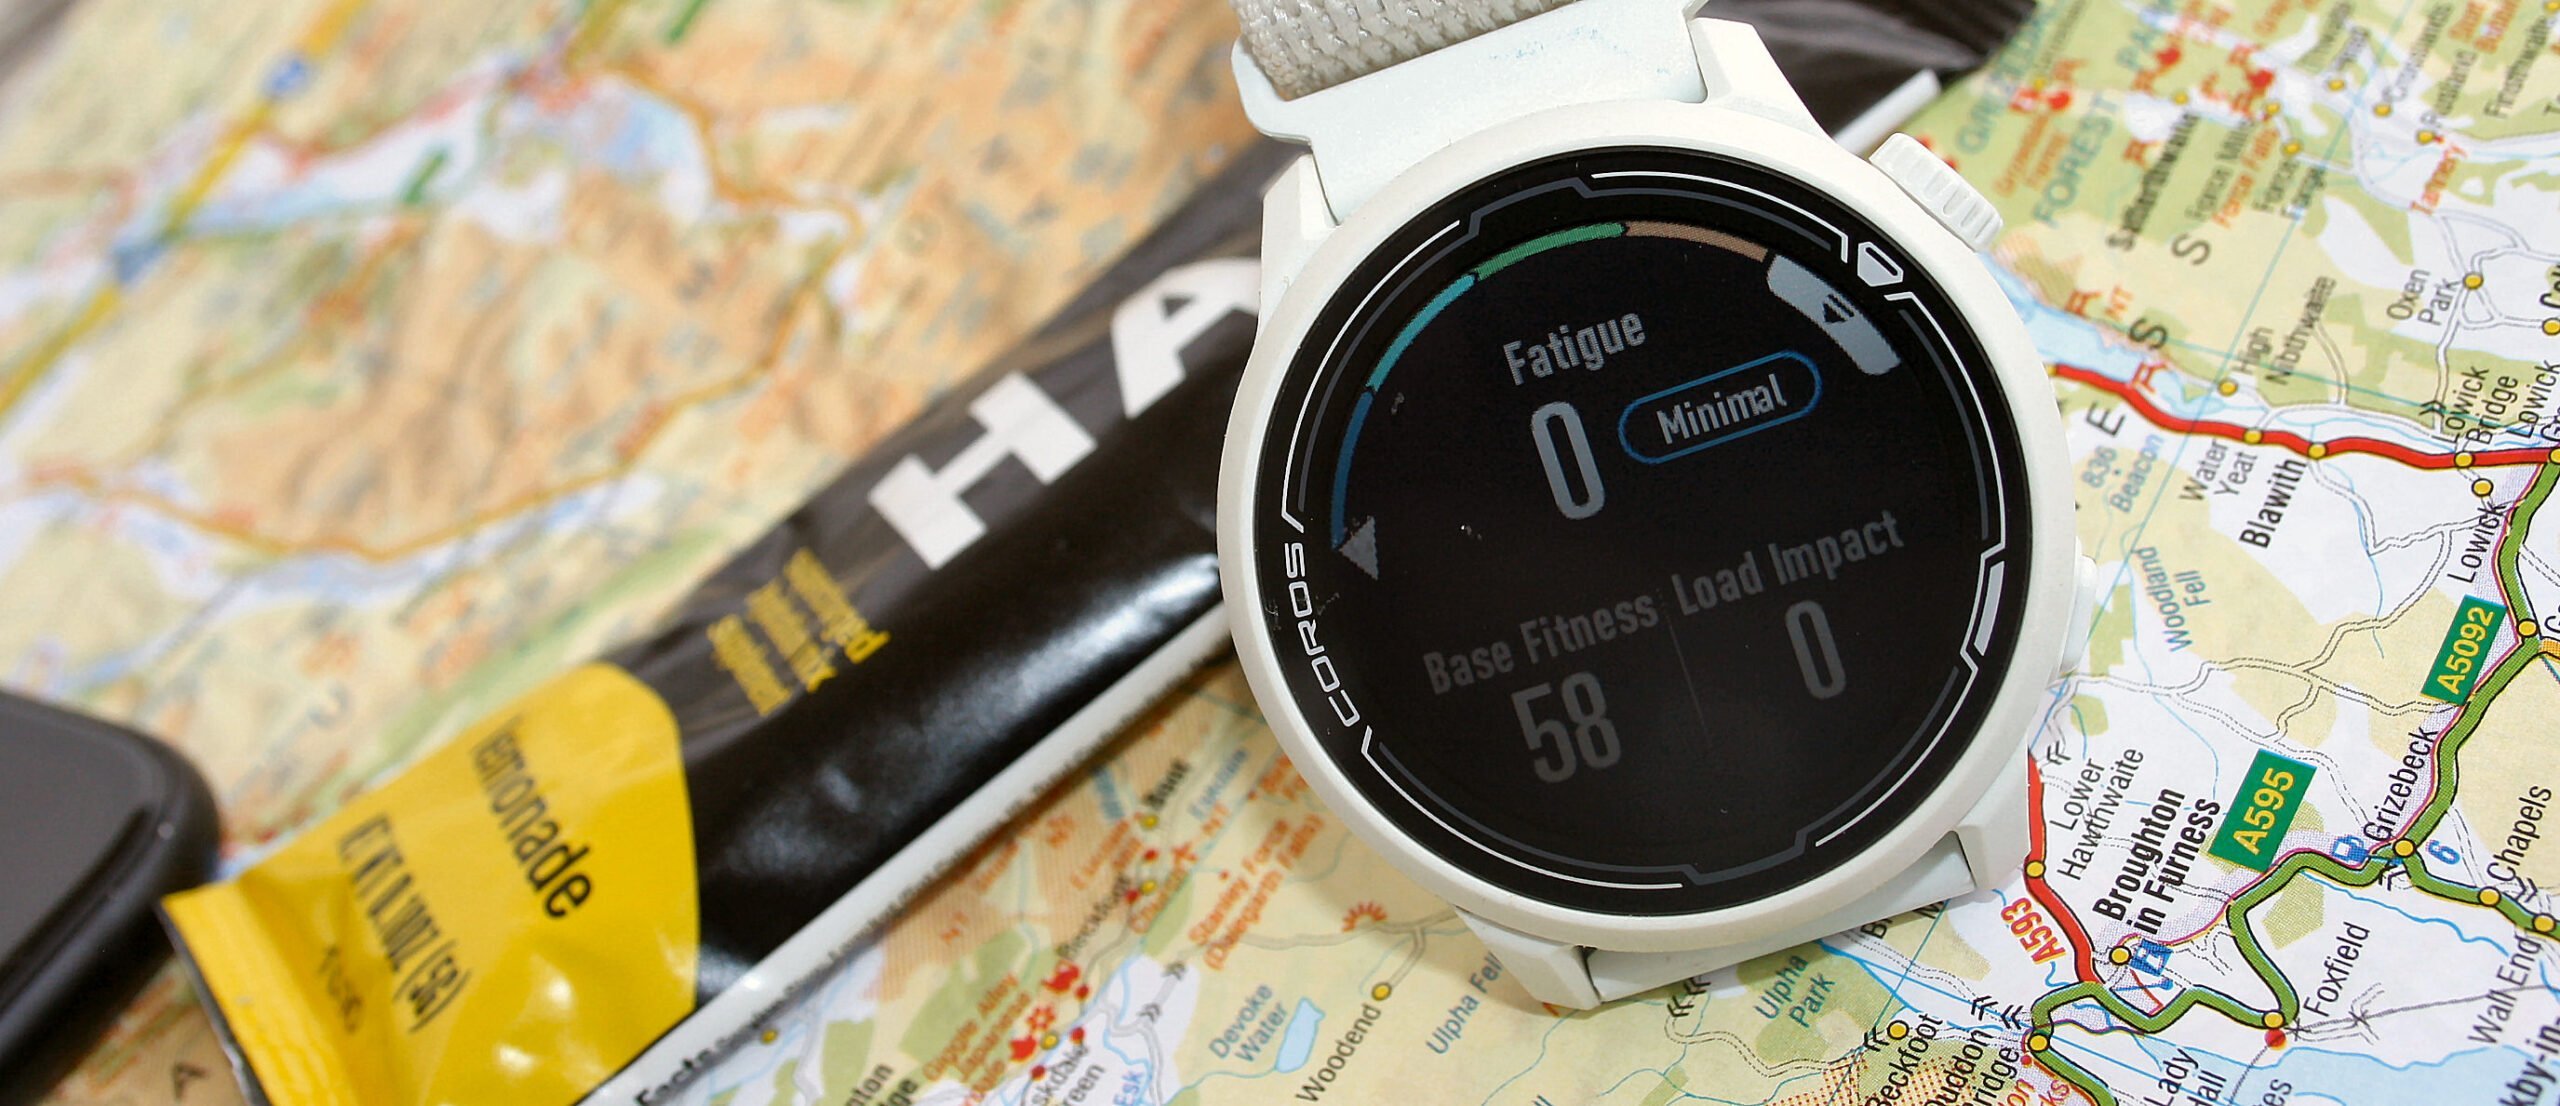
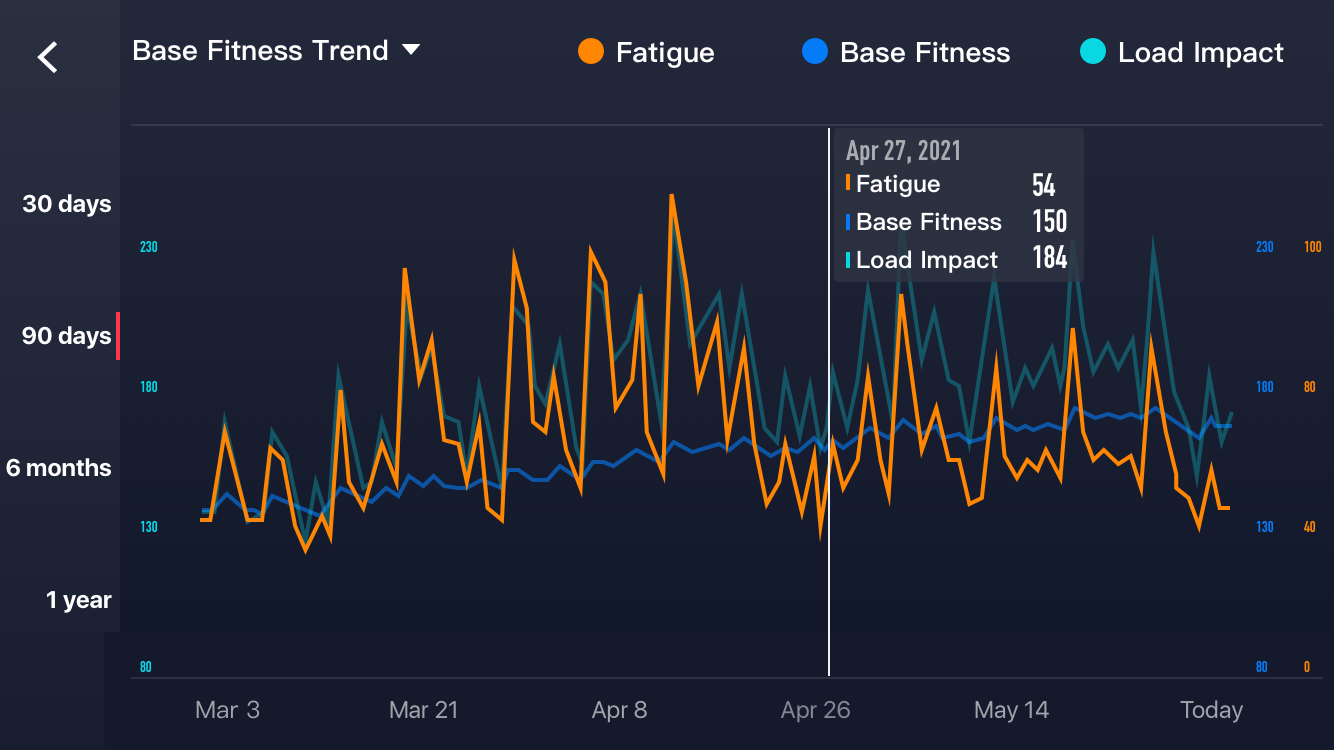 Load Impact
Your recent training scores over the last week will reflect your short-term tiredness. This limits your body’s ability to hit the performance levels theoretically possible based on your base fitness. You have probably already felt tired one or two days after a hard workout but there are a few obvious effects that last for longer and which will be accounted for in COROS’s Load Impact calculations.
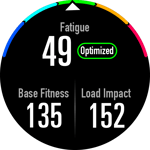 Fatigue
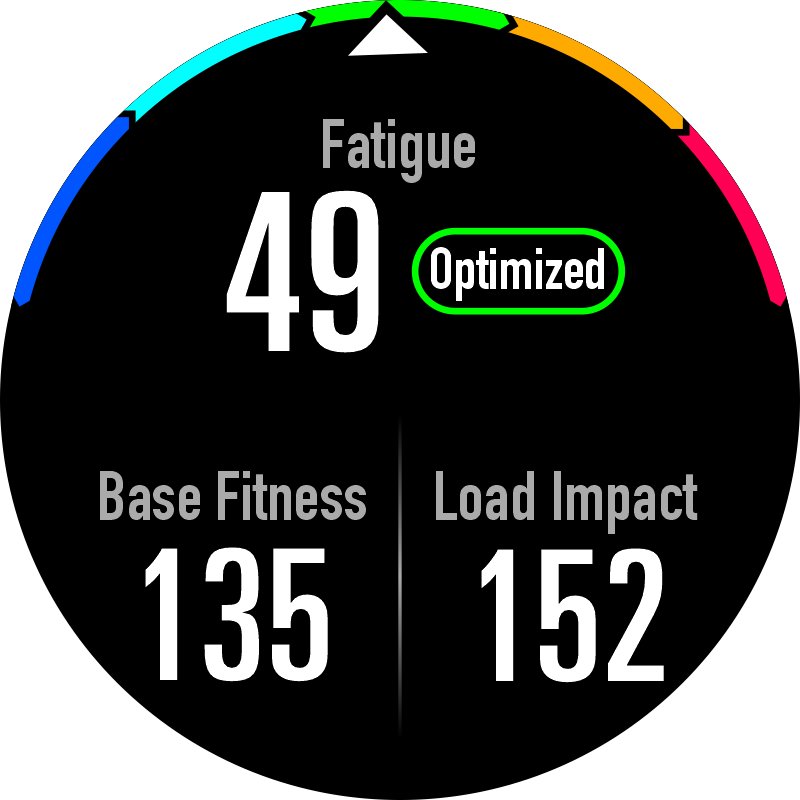
I’m not sure COROS has the terminology or interface right for this.
COROS assess and re-bases the difference between Load Impact & Base Fitness on a scale of 0-100, then inverts how the measure is typically presented. A low value is interpreted as the ability to take on more intensity.
This measure is usually called TSB, a measure of readiness to train/perform. By re-basing it this way, COROS might imply that a zero value is best. It isn’t. Super low fatigue can only be achieved by stopping training and that would impact your fitness.
The chart above shows this with the orange line ending at about ’40’, which may well be a sensible race-ready status, maybe a tad high. Who knows? If it were a TSB of 15-25, then most people who understand TSB would say that’s approximately a ready-to-race value.
Action: If it ain’t broke, don’t fix it. Coros fixed it when perhaps just a few better words were all it needed.
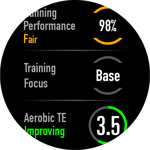 Training Effect
Training Effect allows you to manually evaluate how well you executed your workout compared to your intentions at the start. For example, your long Sunday run should maximise an aerobic score with a zero score for ANaerobic, whereas with intervals, you try to maximise the ANaerobic score.
The green semi-circle in the image to the right shows an aerobic TE of 3.5 which is a probably half-decent long run.
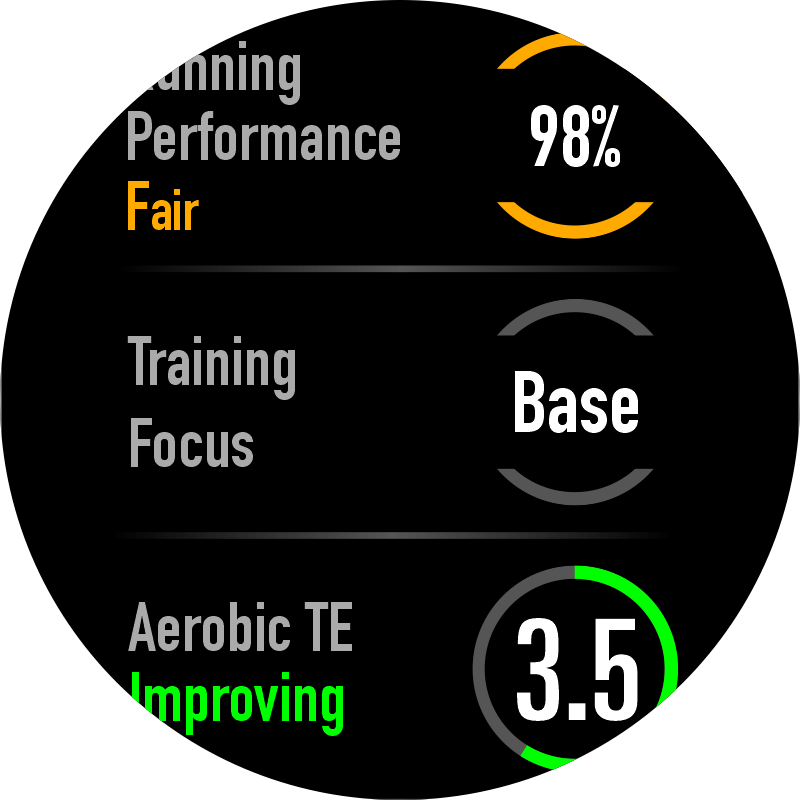
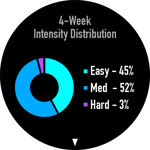 Intensity Distribution
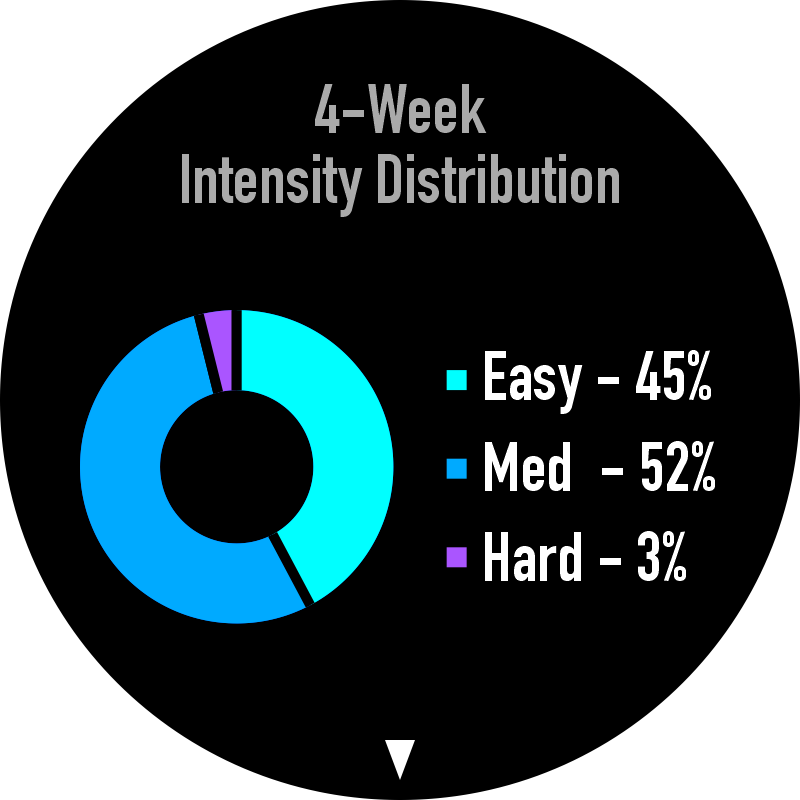
Low-intensity training slowly accumulates long-lasting fitness. Intense speedwork quickly delivers more race speed, but its benefits are quickly lost. Thus, your training plan will typically ramp up volume and intensity as you get closer to race day, peaking 1-3 weeks before your event.
COROS show trends in 4-weekly chunks on the app, which may coincide with a specific training block. It should help you get a general view of whether your training plan is pushing you in the right direction. I think this information is best shown to coincide with your training cycles, usually weekly.
However, the same data for the last month is shown as a doughnut/pie chart on the watch. This looks nice, but I’m not sure how actionable it is without trend information (that’s on the app)
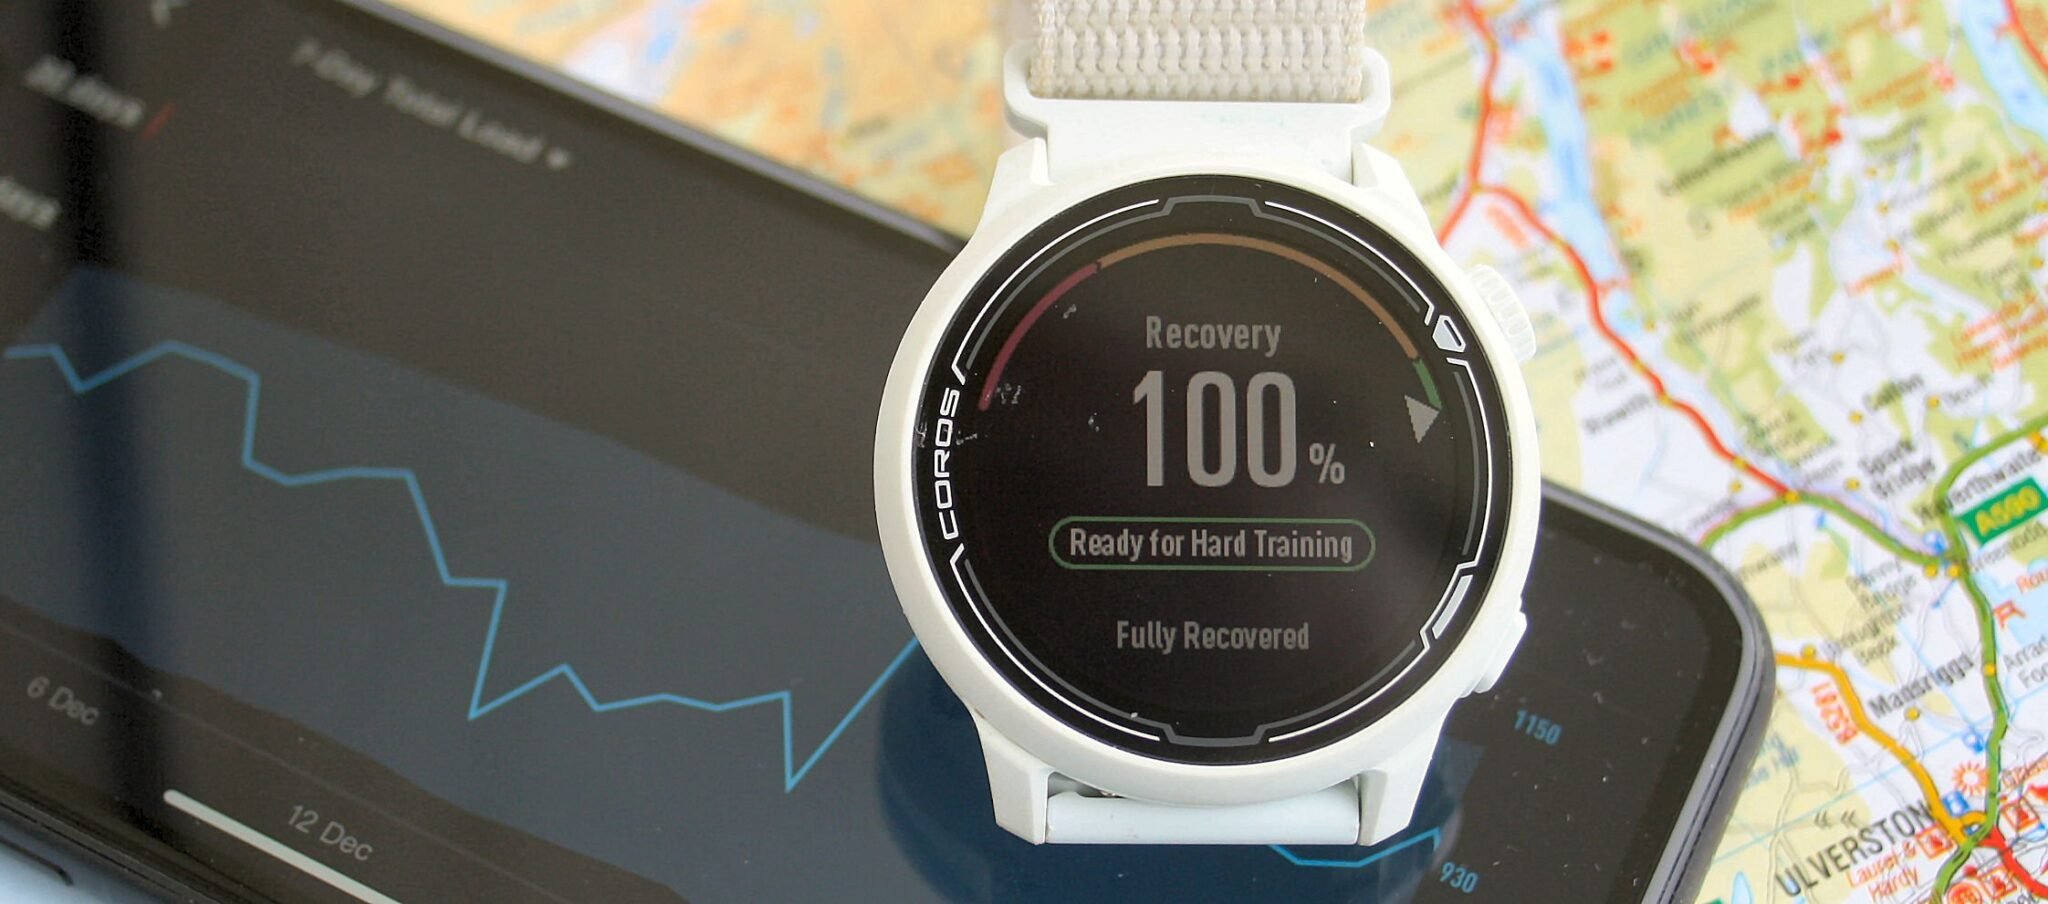
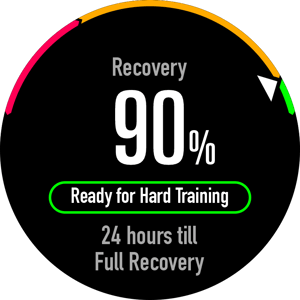
Recovery Timer
The intensity and duration of your training over the last 3 days will all impact your ability to train hard as of this second. The recovery timer is a great way to check whether or not you are likely to have sufficiently recovered from recent hard workouts to properly execute another hard session right now. Garmin has this as an hourly countdown, whereas COROS gives your recovery status as a red/amber or green zone, indicating the %age of your recovery and a short textual message to explain what to do.
In some ways, I prefer how Garmin tells me, ‘recovery time = 6 hours‘. That’s much more definitive. However, I suspect that your physiological reality ties in more closely with how COROS place you on a spectrum.

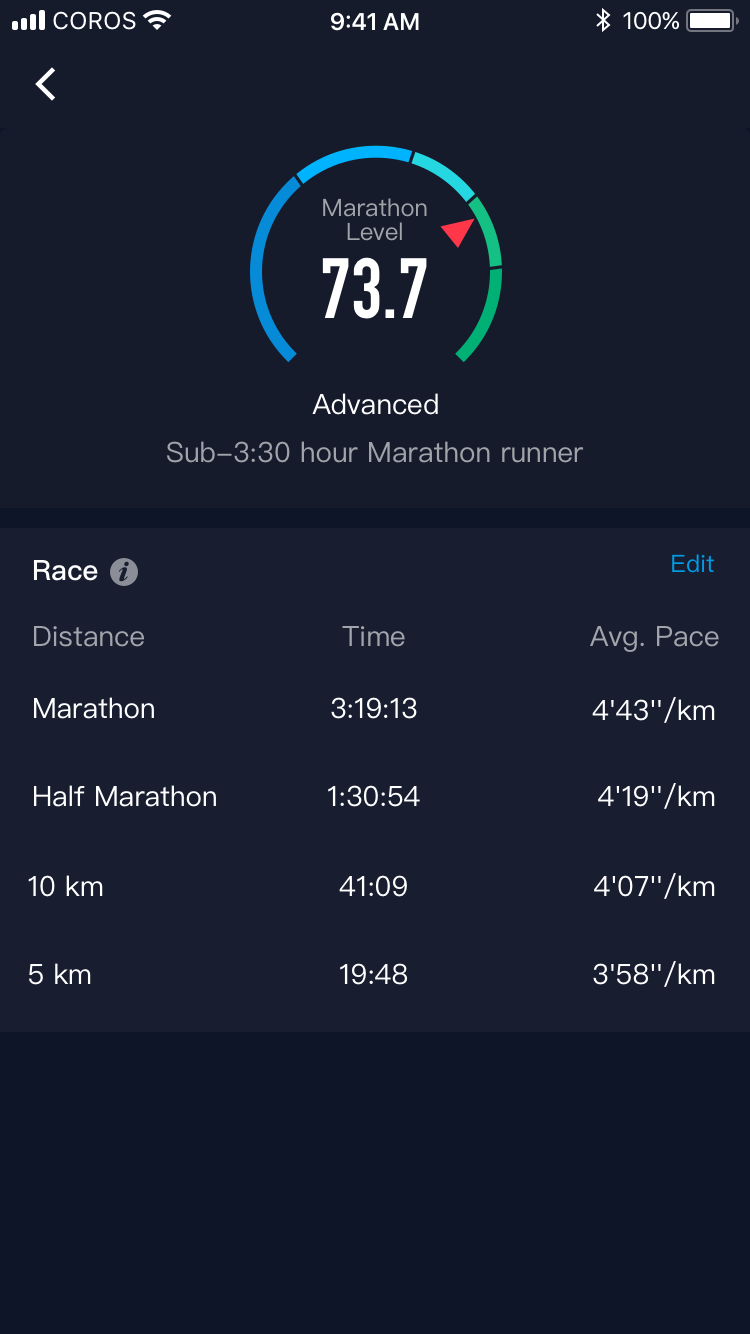
Marathon Level – hard surface running
This is a simple score based on your likely ability to execute a fast marathon. The higher the score, the faster the marathon. The calculations consider workout history, VO2 Max, threshold zones and running efficiency. This is a potentially more useful metric than VO2max for predicting long-distance performances…try running a marathon at your VO2max intensity and see what happens 😉
So your ‘Marathon Level’ is just another metric that will mark your progression towards a longer race distance objective over time. It’s not that useful, but like VO2max, the number is used in other calculations.
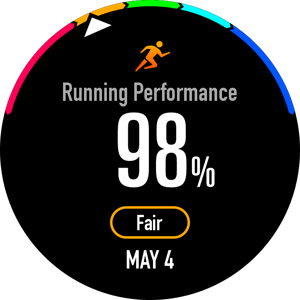
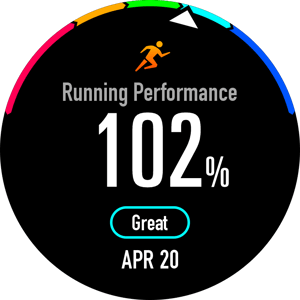
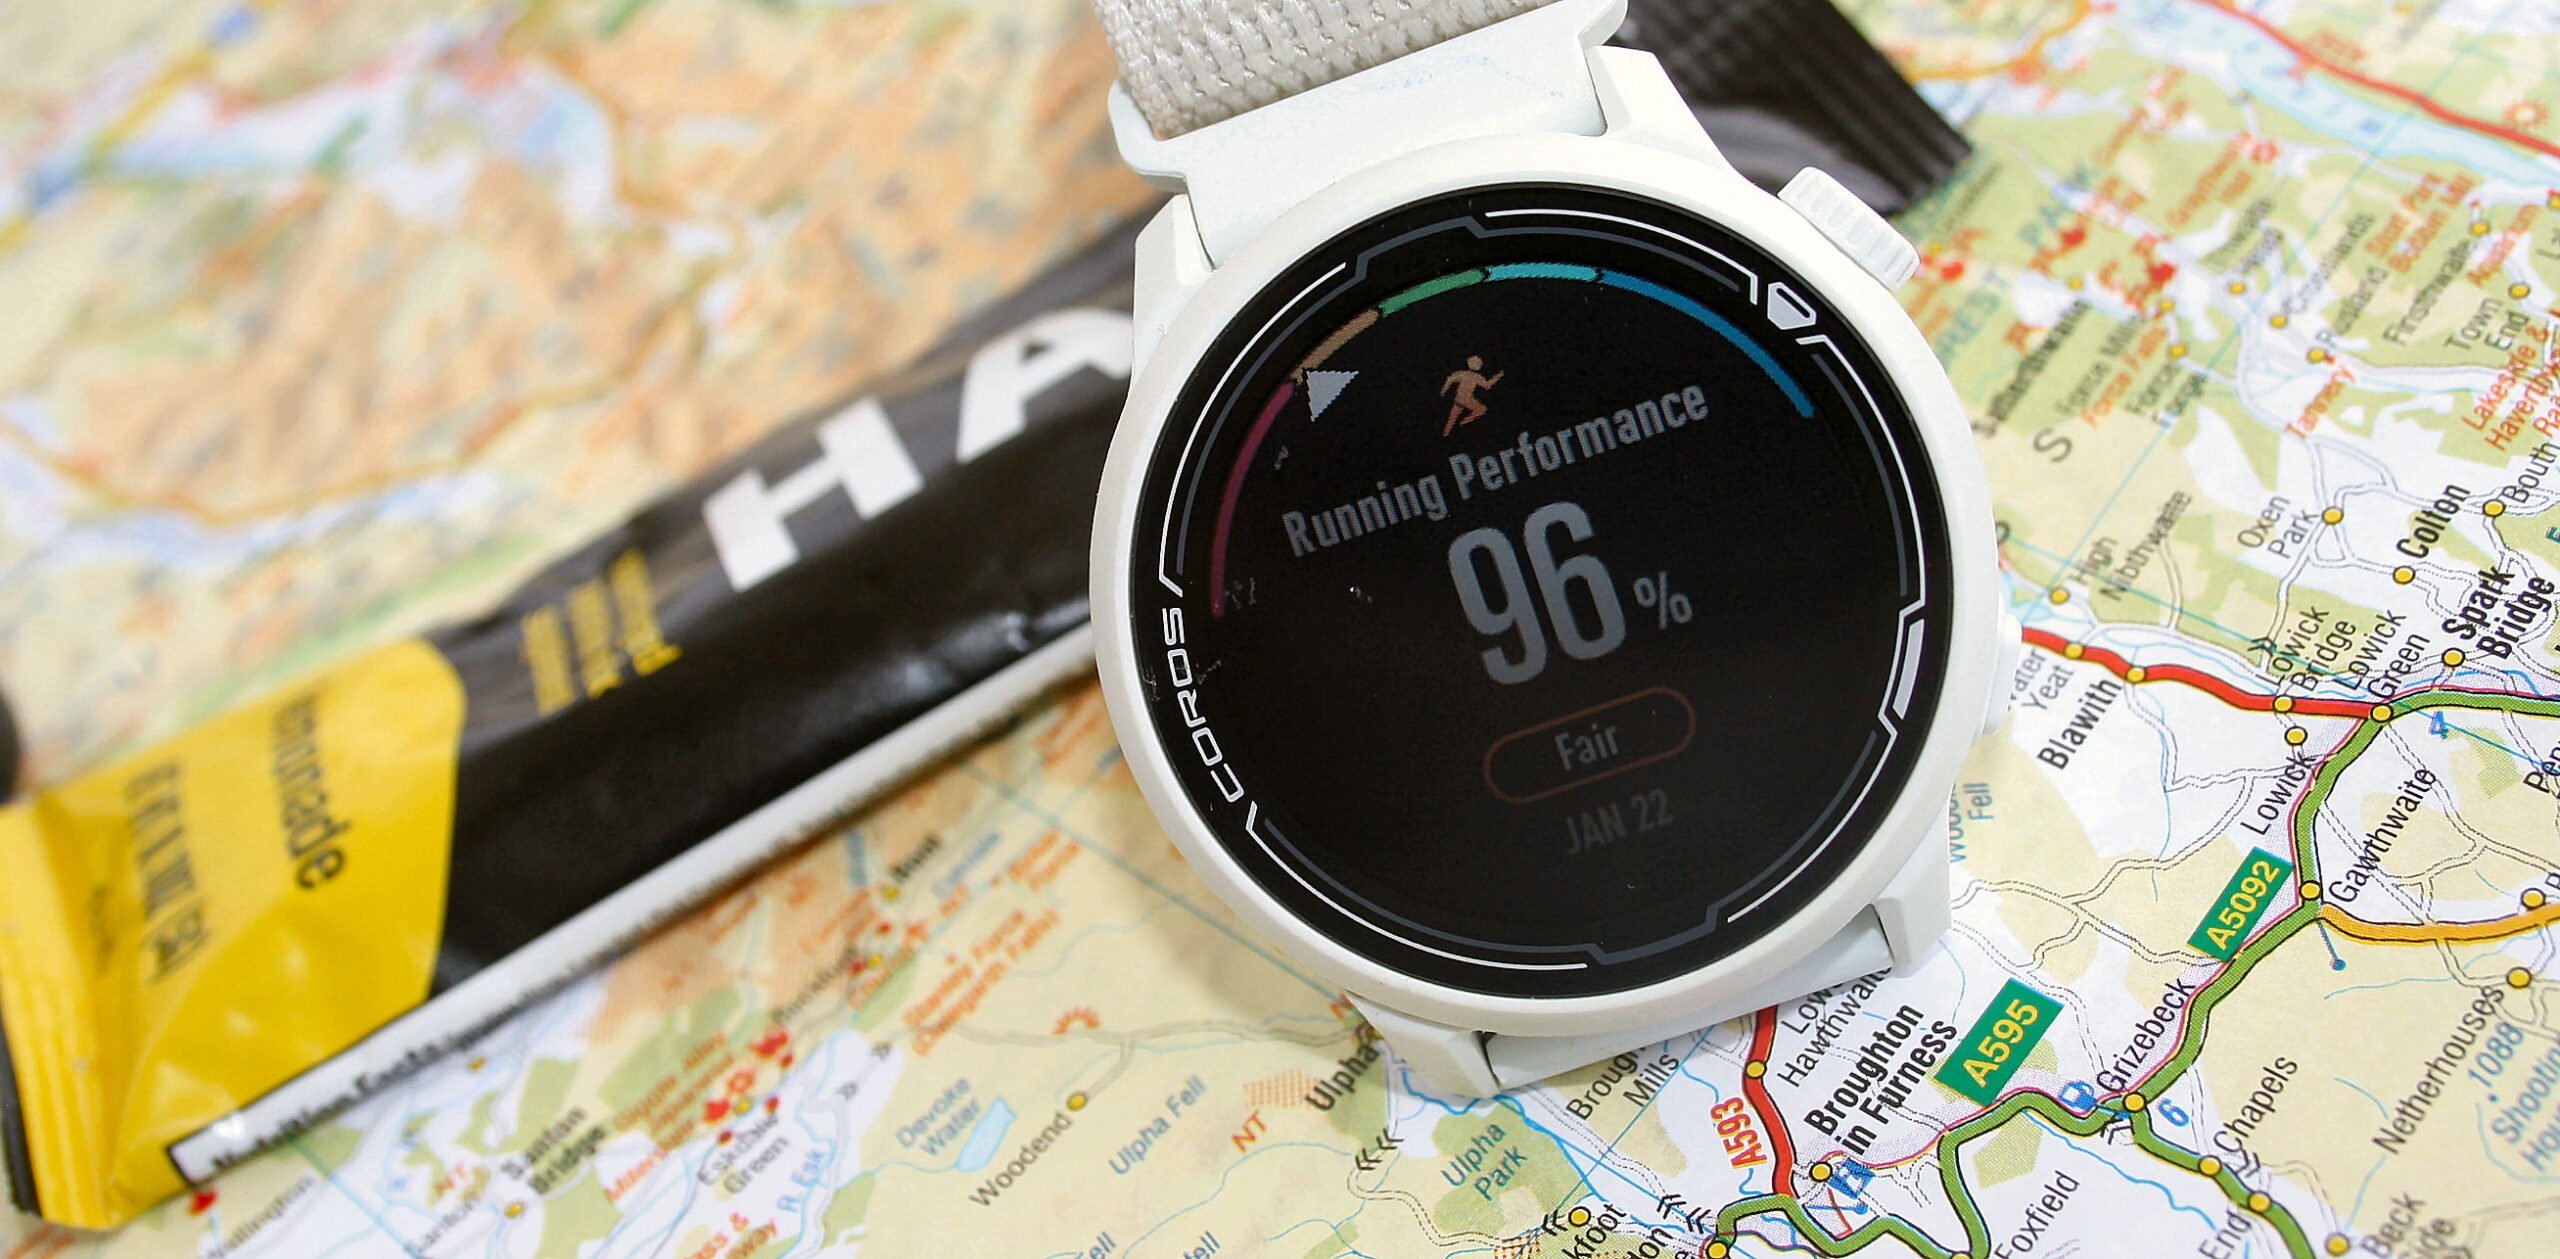
Running Performance – hard surface running
This scores your last workout against your Marathon Level. Approximately 100% is expected, and scoring over 105% indicates good performance.
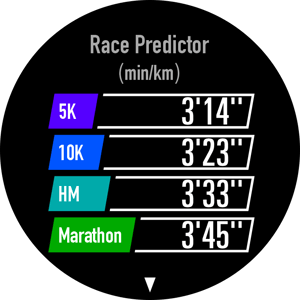
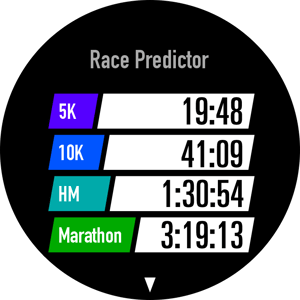
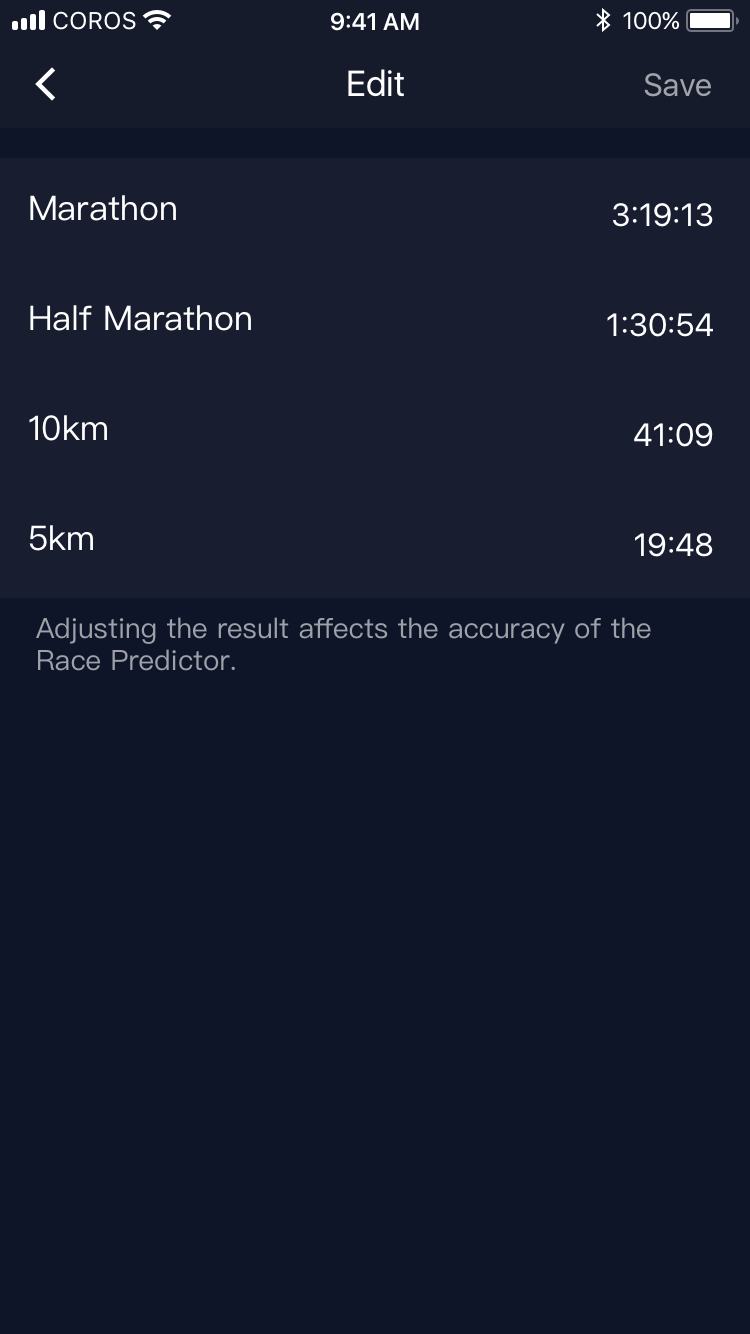
Race Predictor – hard surface running
Historically race predictors tended to work well for high-level athletes or only if you had correctly focussed training for your target race. That EXCLUDED most people! More recent race predictors, including this one by COROS, seem to reflect the reality of most runners better. I assume the newer models look at performance points over many different durations, plus your competence at executing at those levels.
VO2max – hard surface running
It uses standard calculations ultimately based on the HR and PACE levels you achieve. However, the COROS algorithm is tweaked to reflect the reality that our real VO2max abilities change slowly, and thus, the algorithm has safeguards to avoid sudden changes to the reported VO2max.
Again, the number is not so useful to you, the runner, but it is used in several algorithms. Of course, we all know that a high VO2max infers bragging rights to the owner 😉
Training Focus – hard surface running
Your run is labelled as Easy, Base, Tempo, Threshold, VO2 Max or Anaerobic based on the intensity accumulated in the run.
This is one of the metrics I find most useful in the Garmin ecosystem after a workout. It just gives me the comfort to know that what I achieved was probably the same as I intended at the start of the workout…or not!
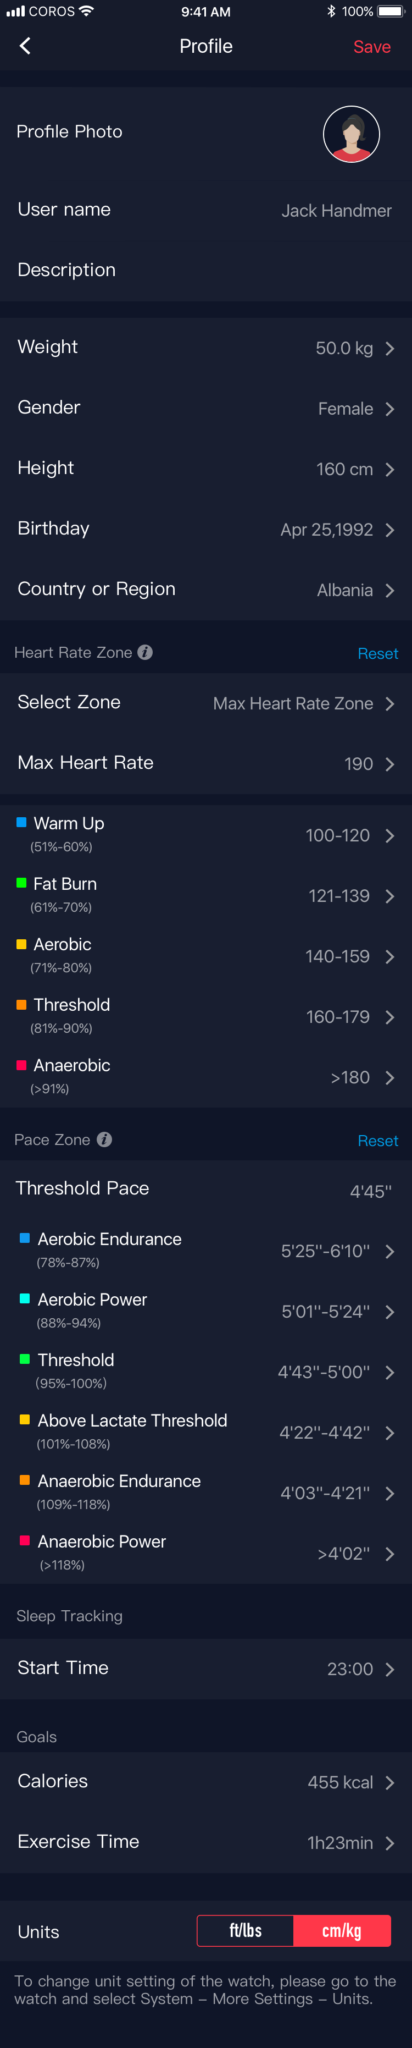
Threshold Pace Zones – hard surface running
These are essentially equivalent speed/pace zones to the heart rate zones you might be more familiar with. The two sets of zones are used to moderate the scoring & classification of your workouts, ensuring outlier performances are excluded.
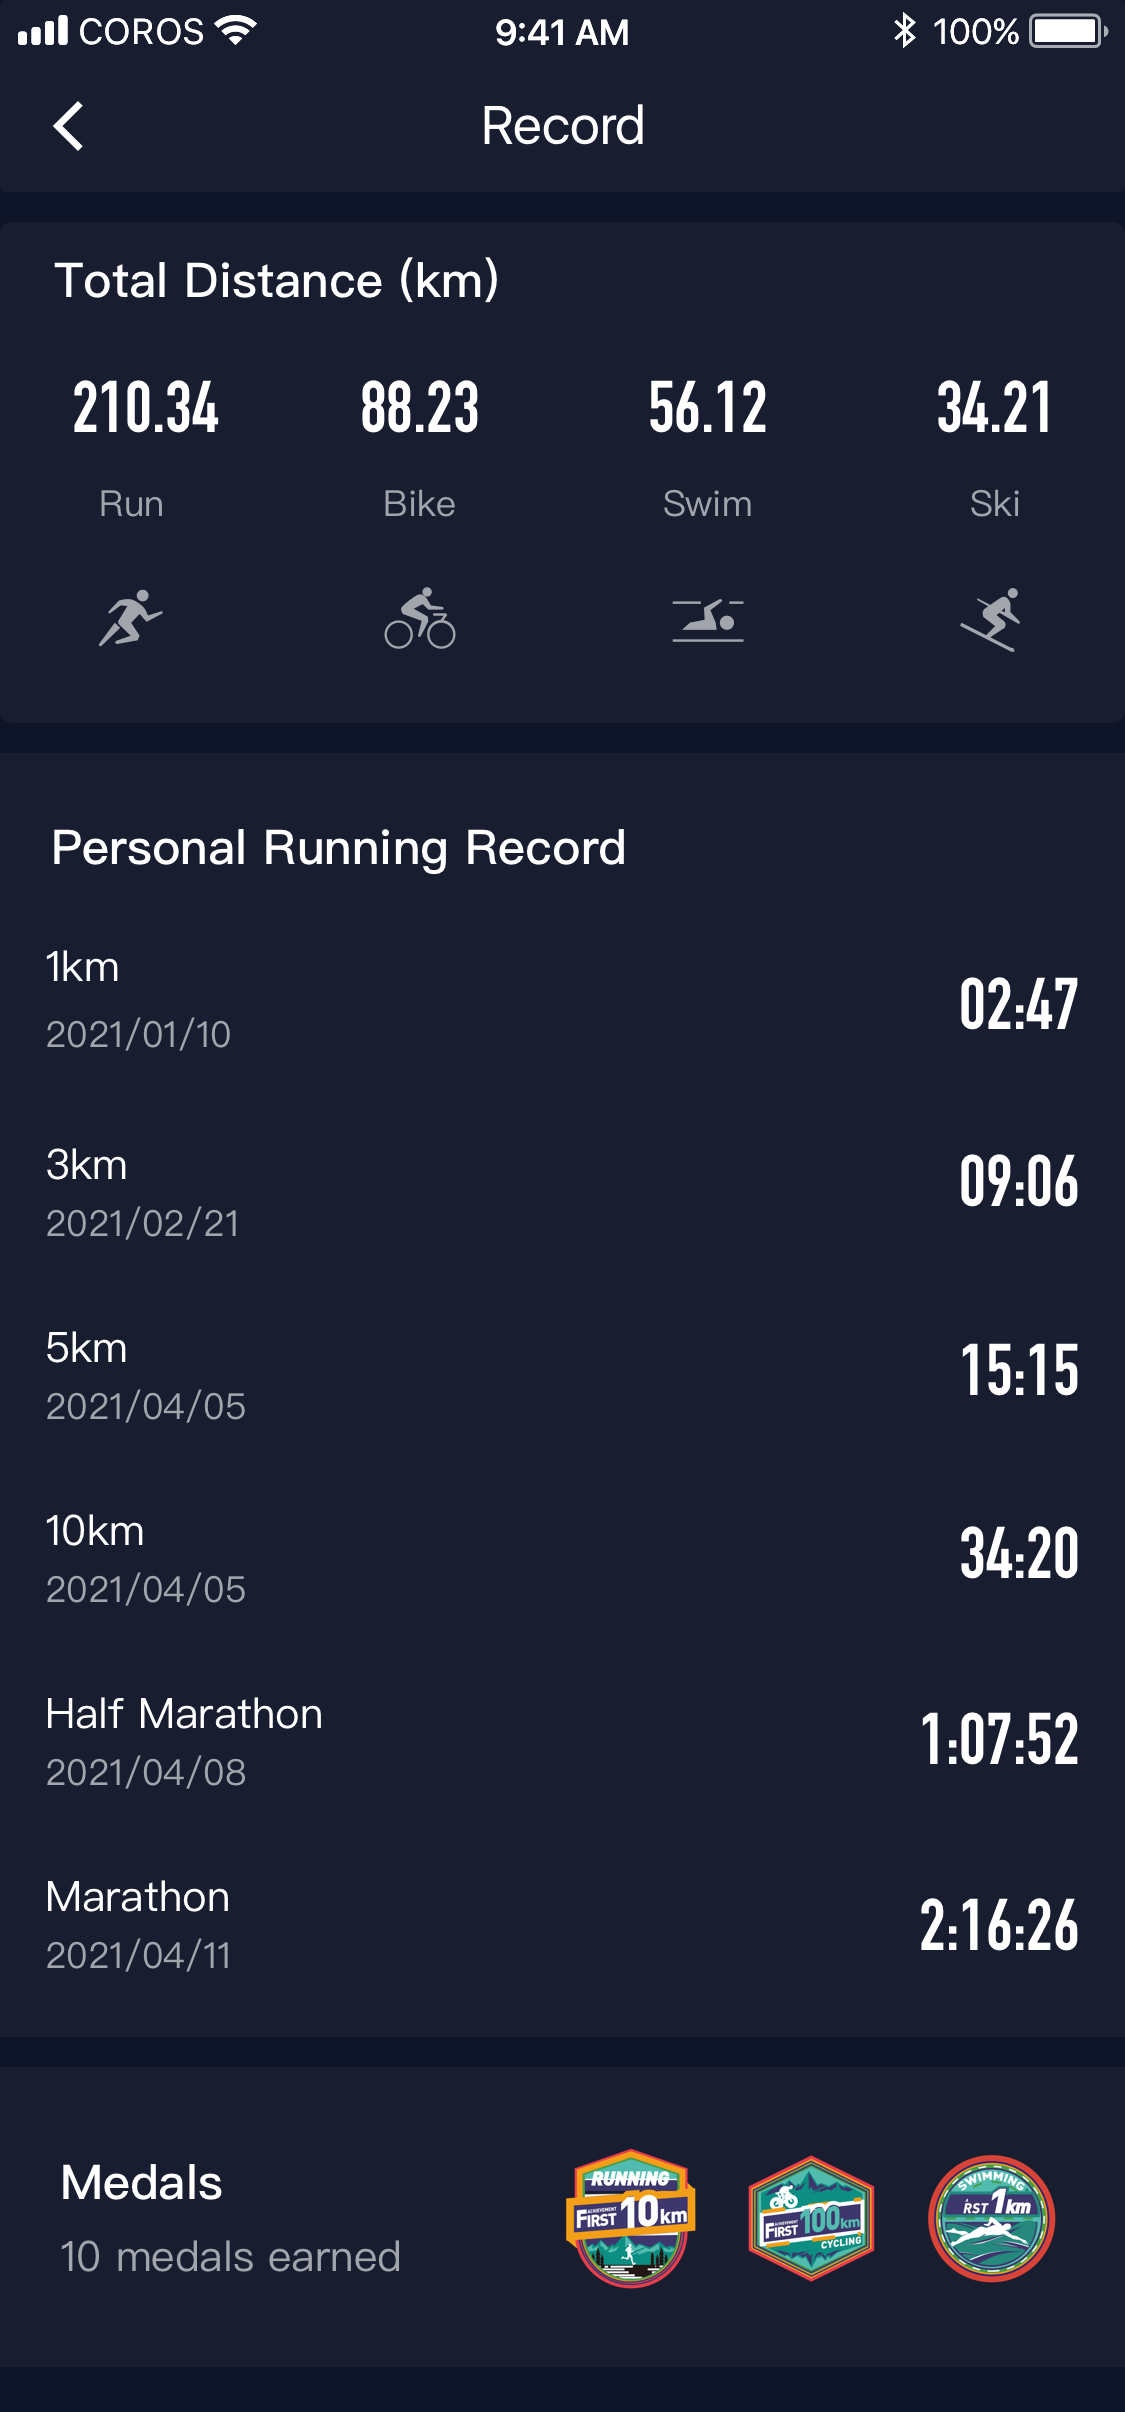
Miscellaneous Points
I wanted to include these rather cool images. These show the wealth of insights that are stored and calculated about you. I especially like the second one which shows you an example of the post-workout data you can scroll through to get a feel for your achievements.

Then, these 4 give you views of how other parts of the COROS app bring together the EvoLab data.
What Needs to Change?
This seems like a pretty good beta, and COROS has covered many bases here. They need to fine-tune and tidy up what they have, as most of the sensible training principles are already covered here for runners.
Does COROS want to be a trail runner watch? (YES), does COROS wish to be a cyclists’ watch? (MAYBE). Either way, they need to tweak these metrics further and add a few more without going crazy.
The main omission is the cross-over of HRV data from sports to sleep and health. So we’re talking about moving towards what WHOOP does; something like HRV4Training‘s morning readiness and Garmin’s Body Battery morphed together to get a hybrid readiness-to-train score (fatigue score in the COROS terminology)…things like that.
Take Out
COROS EvoLab is a superior implementation of sports physiology for the masses. It’s highly Impressive but needs a bit of tweaking before leaving its current Beta state.
If you are a committed road runner looking for some running insights then COROS EvoLab could easily sway you away from Garmin and Polar and into the hands of the excellent COROS Pace 2.
Q: Is EvoLab better than Garmin-Firstbeat?
A: Maybe not, but it’s at a similar level.
Q: Is EvoLab a copy of Garmin?
A: As I said at the outset, many of the calculations are widely known, although some used by Garmin/Firstbeat are less widely known and some are ‘secret’. Garmin/Firstbeat use EPOC-based measurements and it’s very unlikely that COROS will produce their sports stats in that way. So, no, the calculations are probably nowhere near copies.
Q: Is the interface/terminology/feel a copy of Garmin?
A: Ha! Well, some of it does seem very similar. Just because Garmin does X, it doesn’t mean it was the original inventor. I’m involved in some app developments at the moment and the logic of the names of these metrics and where some of these types of measurements sit in the user interface means that, for example, workout scoring just naturally goes in the workout summary data. So perhaps COROS is as logical as Garmin 😉 That said, some of the details of what COROS has done are different.
Q: Is EvoLab data more accurate than Garmin-Firstbeat?
A: Well, Garmin certainly isn’t accurate in some cases and I’m sure there will be glitches and nuances to what COROS has delivered here. I have VERY significant differences between VO2max on Apple, Garmin and Coros watches, heck my VO2max even varies depending on which Garmin watch I use (go figure). That said, the COROS data seems plausible to me. Once again I could bemoan the accuracy of GPS and optical heart rate as those are two of the key inputs to this whole sub-industry. Once again I’d recommend a chest strap and STRYD, both of which COROS support, but very many people want all their tech inside one single watch and they probably don’t really care too much about accuracy. The reality is that most people don’t care about accuracy (I DO and I know many readers here do too)
If I had to pick a fault EvoLab, it would be with some of the phrases used yet they can obviously be very easily changed. So, my main criticism remains as the overall look and feel of the app, which knocks the COROS experience down a peg or two more than is deserved. Rather than remedy that, COROS has dug deeper with the strategy of more features and more watches. Garmin did that…it kinda worked, right?
These features are released in mid-June, sign up now for beta access: coros
p>EvoLab now runs on every watch. See how it shapes the range in our COROS hub.
Last Updated on 31 May 2026 by the5krunner
My favourite kit and nutrition
- Injinji – Runners protect your toes. Avoid discomfort and minor injury. Run more. Run faster. I use them.
- Garmin 90-degree charging adapter — The small adapter that keeps your charging cables tidy. Essential for race day. I use one.
- Garmin charging puck — the fastest and most reliable way to top up your Garmin before a session. I use one.
- Ravemen FR300 — Front light that mounts directly under your Garmin or Wahoo head unit. Keeps your bars clean and your beam pointed where it matters. I use one.
- Body Glide – The blue anti-chafe stick that all swimmers and many runners use. I use it.
- Maurten — The race nutrition trusted by elite athletes. Gels and drink mixes engineered to be easy on the stomach. I use them.
- Garmin Varia RTL515 — A radar rear light that alerts you to vehicles approaching from behind. Pairs with your Edge or Garmin watch. I use this model.
- Favero Assioma Pro RS2 — The power-meter pedals most serious cyclists choose. Accurate, easy to move between bikes. I use this model.
- Garmin Forerunner 970 — A serious choice for a pro-grade triathlon watch. I use this.
- Polar H10 — My daily driver for accurate, waking HRV readings.
- Wahoo ELEMNT Roam 3 — The bike computer that has the feature Garmin lacks: usability. I use mine on most rides.
Reader-Powered Content

This content is not sponsored. It’s mostly me behind the labour of love, which is this site, and I appreciate everyone who supports it.
Support the site: Follow (free, fewer ads) · Subscribe (paid, ad-free) · Buy Me A Coffee ❤️
All articles are written by real people, fact-checked, and verified for originality. See the Editorial Policy. FTC: Affiliate Disclosure — some links pay commission. As an Amazon Associate, I earn from qualifying purchases.

tfk is the founder and author of the5krunner, an independent endurance sports technology publication. With 20 years of hands-on testing of GPS watches and wearables, and competing in triathlons at an international age-group level, tfk provides in-depth expert analysis of fitness technology for serious athletes and endurance sport competitors. ID

Unless COROS fixes how rest HR is captured (better still, lets people edit it in settings for those who don’t wear a COROS watch 24/7 due to… too many reasons), the training load and all the derived stats will be off. DCR has a formula for their TRIMP, and RHR is a prominent number there. I’m sure it’s used in a few other places too. Garbage in, garbage out!
Otherwise, this is close but not quite Garmin/Firstbeat level yet by a significant margin. I’m not sure it would persuade me to leave Garmin, but it certainly may prevent somebody from leaving COROS, or make Suunto/Polar users reconsider.
or…if you are starting out…jump straight into Coros 2 vice Garmin 745 at twice the price and less features overall…better to compare to triple the price Garmin 945. I started on best value watch of 2018 Suunto Spartan Trainer…ironically at higher price before getting consumed (in a good way) by the Garmin ecosystem – it’s pretty good and getting better. But for new to fitness tracking or specifically triathlon – Coros 2 all-day-long!
How does it all compare to Polar Flow for tracking/analysis/recovery/etc? Lots of comparisons to Garmin, but Flow is the analysis platform to beat for this type of news release, IMO, even though their market share is obviously a lot smaller than Garmin, this is where they trump everyone still today.
Not seeing anything that would sway a Polar user over the fence, since Polar includes all this AND a massive amount more (including all activities tracking metrics, VO2 for years now with proper sensors, etc. And Polar’s training programs now incorporate Power fully as well as always having Speed/Pace and Cadence-based training, support for cycling of pretty much any type, for decades, etc, treadmill running training, trail running, mountain biking (and however many other (60? 80? more?) profiles.
I REALLY want Coros to sway me to their “dark side” LOL, because their hardware (other than the lack of proper buttonology) is so excellent, but until they can replace Flow, it’s not going to sway anyone who uses the features Coros is “promoting” today.
In other words, someone with training history in Polar, or Garmin, already have “more than, by far” Coros is offering, and if the user wants/uses/needs those levels of detail, they are 100% not leaving based on this.
But this does make Coros a bit more competitive on a first time “step-up” user, or that just needs ultimate battery life in a reasonably priced watch.
Again, I WANT Coros to get to that next level, and it seems they are maybe trying, but just really still way too far behind the curve at this point, they are playing a serious case of catch-up, to established, veteran orgs with so much more to offer right now, and Coros still doesn’t have (as of today at least) a web portal worth mentioning that can be used to easily setup/review things. Changing the pigment on an injection molding system, and tweaking a few metrics that only cover LITERALLY a handful of conditions, is still just way too limiting today. IMO.
Well, their training load is the same TRIMP-based number as you’d get from Polar, scaled slightly differently perhaps. Training Focus is what Polar calls Training Benefit. Actual running performance based VO2 Max maps to Polar’s Running Index (or Polar’s VO2 Max if you happen to get V2).
Unlike Polar that does tolerance/strain over 28/7 days window, COROS uses a more conventional 42/7 split. The fatigue is represented differently though. COROS takes a page from the likes of Training Peaks, Stryd, and others and makes it simply a difference between tolerance and strain, not a ratio like Polar. Polar’s training load status roughly gives you same info as 7-day training load guidelines in COROS.
Running predictions are well… running predictions. Time will tell if they are better or worse.
Running performance is interesting and has no alternative in Polar world (I don’t think Running Index is granular enough). Intensity distribution you can get in Polar Flow reports, at least close enough.
I don’t think Polar has recovery time now (they used to, but not anymore). Nor does Polar have “marathon level” as measure of your long distance running performance. Last but not least, even though Polar has a running test, it doesn’t try to compute LTH threshold, hence no paces based on thresholds, and no threshold history tracking.
I think that’s pretty much all that was announced today. For now COROS isn’t leveraging sleep, recovery, or any other physio tests like Polar and Garmin do.
And honestly… I don’t think COROS is that far behind Polar. Just look at the amount of stuff they added in the past 18 months, from gym/strength training that’s second only to Garmin and well above anything Polar, to being the only complete native running power/Stryd implementation to training integration with TP, and now this, a fairly comprehensive first stab at training load metrics.
If I were Polar, I’d begin to worry. Not only COROS builds out their platform at astonishing pace, it makes the features available to almost all older watches. Yeah… Grit X and Vantage V, I’m looking at you! It’s a serious argument for both existing and especially new customers.
yep, i’d agree with your 3 comments.
although the answer nuances between the technical reality and customer perceptions
I’ll come back to saying that the Coros app lets it down and personally I’m not so keen on the watch interface but actually it’s just me on that front. both are fine to get somebody onboard with a new coros watch
Polar are ahead in the technical sense and people like you know that…but you are by far the minority (said in a nice and complimentary way!!)
the big market is one that impressed by headlines and features. garmin has them and coros knows the market wants them. Polar has most of them but are the feature correctly marketed, named and labelled?? maybe not.
ultimately it’s going to be the number of watches on wrists that decides all of this. I suspect Polar, Garmin and Coros are all happy on that after 2020 and H1.2021, the immediate future may well have quite different prospects especially once we start looking at the size and growth of asian markets – think on that point for a few more weeks.
My bet COROS will rule Asian markets. Am I right or am I right?
Polar doesn’t strike me like somebody that has much of a presence anywhere outside Europe. They are in trace quantities even here, this side of the big wet. Can’t imagine a situation being better for them in Africa or Asia. Not after COROS signed up the King of Kenya.
it’s a bigger pond with more fish.
Coros could be important but they are still small.
Wear OS has just formalised the eventual death knell for some companies. remember I’ve always said that future is Apple vs Google plus some weird regional Chinese pseudo-monopolies. not sure where coros, polar and garmin fit into that sentence…and yes I know garmin has a billion dollars of cash in the bank
I said so too, have a certain Suunto 7 post to show for that. But so far said future seems to be very removed. Apple might be within a striking distance of making serious inroads into this space. But Wear OS? Fitbit and Samsung announcements aside, I don’t think we gonna see anything remotely Apple Watch like in the next 2-3 years. The ecosystem is simply not there.
I also have said this, if you remember. The first company to put a smartwatch/sportwatch with all the positives and none of the negatives, will rule the market.
Wear OS working with Samsung and eventually weaving Fitbit into the mix can mean exactly what I said above. If they find a way to weave accurate fitness metrics like a Garmin or Polar, while supporting external sensors AND have a robust app store with sport watch levels of battery life; game over for the competition.
I’ve been using Samsung products for years, if they bring a Wear OS, Tizen inspired watch to me that doubles as a fitness tracker/sport watch, sign me up.
We’re getting closer and closer to this becoming a reality.
yes the jigsaw pieces are joining up. i still think hardware tech is not yet good enough (for anyone) but maybe now the trend will emerge…or not. let’s see…
In South Africa, based on what I see on wrists:
we now need someone to chip in from China or India with the same observations. I suspect a different list would be forthcoming from them.
the times they are a’changing.
(could be a song there)
True, but what I see probably does not reflect sales. I know of some who simply have stopped using their Apple/Samsung devices due to bad battery life or the device simply not offering anything unique (out of the box) that their phones does not offer.
Out of the box step challenges, sleep tracking, body battery, v02max and even automatic strava uploads (oh yes and parkrun when it was around) seem to provide great motivation for some people to make constant use of devices like Fitbit and Garmin.
yes. providing you understand the kind of person you are looking at, these kinds of observations are VERY valid for understanding athletes that are different to you. if you can understand 10 different kinds of athlete then you’ve got a pretty good grasp of the whole market. (not perfect…just good)
for those who think the athletic world is a mirror of their own experience…enlightenment will take a long time to come and they just won’t get it.
Excellent responses/feedback, thank you!
I’m one of those Polar users that Polar should be worried about, LOL (my wife just ordered her Coros the other day, so I can start seeing it in person as soon as it’s delivered).
She’s leaving Garmin after a short stint due to device issues regularly happening, and no need for all the “fluff” they have (FR245 in her case). So soon we’ll be a 3-vendor family (unless we sell the Garmin (again, LOL, they come and go over the years for her).
I agree Coros is very rapidly moving forward in some important actionable areas (although still lacking in some as well). Since they are a lot like Polar in the “stripped down sports-watch-only design” basically, it’s a good comparison to make.
Recovery time does still exist in Polar-verse for previous generation devices (pre-Vantage, still perfectly valid in my v800/m430/Flow settings,) which device-wise, is another reason why Polar should worry, nothing has interested me to update in spite of my wife wanting to buy me a Vantage <new model> for 2 years now as a “new watch present” LOL, frankly I simply/literally prefer what the v800 offers over any of their new models. Interesting that a feature that still works in “Flow/legacy devices” is now “new” in Coros, and NOT available in Polar for new devices… another example of the concerns they really should have (they’d probably argue the “new-style” methods incorporate it, etc… but the fact you mention it in your response, is evidence right there that, maybe Polar isn’t being clear/consistent enough with their market targets…
Although some of the new metrics/methods in Polar-verse related to the new watches are “pretty, colorful, somewhat interesting” on the surface, they don’t seem any deeper or more useful than what was offered pre-Vantage era, just “different” (more digestible at a simpler level, making it easier to drum up business from less experienced users from lower end device ranges, but not particularly more useful, IMO).
Thus, my interest in Coros has been growing over the past year, as Polar has orphaned some of the things that kept me with them for new systems, they’ve gone into the “same as everyone else, if not actually falling a bit behind” in a broad sense bucket especially in the devices themselves, which means, if someone like Coros is more aggressively developing a product, and in some ways already are surpassing them, it makes “staying put” a hard decision.
If (wishlist items) I could work on all Coros platform features and data on my 4k display off my PC (via a web portal like Flow or Connect)… that’d make it so much more compelling… and from the chat reply I received during the announcement, I do think it’s getting closer to happening was still vague of course, but rhe response from Coros of “not yet” sounds promising of “it’s coming…”
Again, thanks for the excellent feedback!
I’m happy that Coros has finally moved onto features and metrics others have offered forever, but there’s a bunch of things left out I’m honestly mad about.
Sleep metrics have been minimal on Coros, that’s not changing. There’s still no where near enough 3rd party support, how does data flowing from Stryd factor in to the new system, still no on board HRV tracking and as you said above the unifying user data is not here. It’s just a series of independent metrical platforms working, but not working together, at least that’s how it seems.
And as a side personal gripe; Coros refuses to give users a choice between 12h time and 24h time. It’s been years, just give us the option!
what sells watches? features? …or features working together? same as Will’s point below
A nice first step. I’d like to see more trail running analysis added. It was also quite telling they never mentioned their wrist based power meter – with all the data being HR based.
yes power bike and power run loads would be different algorithms, trail run would also be a tweak.
Coros now starts to approach the point of diminishing returns. In a way they have almost ticked all the big boxes. The two boxes you mention aren’t ticked but require a fair bit of effort to tick them and perhaps not so many people care if they’re ticked or not.
time to release a new watch instead! 😉
I beg to differ! They might surprise us and go all out on hiking, trail running and ultra metrics, for example. Not only it’s their focus audience, but this is where Garmin/Firstbeat are arguably at their thinnest.
Also, since all are so excited suddenly about Wear OS… How about COROS doing Suunto and Polar and offering their goodies on Wear OS? Perhaps, their flat street running pivot signifies more than a beginning of building out Firstbeat replacement? Maybe they want to play in consumer market now?
Coros is a small company. I think they’ve sold boatloads of Pace 2 but before that they were a peripheral player. I don’t know their strategy going forward but if it’s too wide-reaching or scattergun in its approach they’re asking for trouble. I would assume they have a focus or two…I would bet Wear OS isn’t one of them, especially as they are playing for the more serious runner…Wear OS isn’t for that on the whole.
The main feature I would like in my next running watch is threshold(s) calculations by week or live.
Training load is useful but I’m often following a plan. I prefer race /TT benchmarks to vo2max but I think I would find threshold useful in training. My Garmin 245 doesn’t have the feature.
you get live threshold calculations with FTP on power modelling sites. that’s pretty advanced stuff that few people will use (FWIW I do)
maybe the length of your tt/tri determine which specific CPn you are interested in?
if that’s the sort of thing for you then Coros isn’t the place to go, neither is garmin conenct.
Nice review as always. Let’s not forget that Polar’s and Firstbeat’s (Suunto and Garmin) metrics are based on decades of research. One can read white papers and research articles by both Polar and Firstbeat and study models and validations. While algorithms might be kept secret and protected, the underlying models are available. Now here is the question: does Coros provide any info about the underlying models of their metrics?
Point well made and completely taken. I guess Coros could say…well, we use the publically avaialble science and models (tsb/trimp…they’ve simply renamed them and re-indexed them) and we have our confidential algorithms like everyone else