 SuperSapiens Review – Glucose Monitoring for athletes or diabetics
TL;DR: The takeaway for athletes from this SuperSapiens review is that it is a good but relatively closed platform to analyse and control glucose levels. It’s expensive but could be a game-changer to your performance if used correctly.
If you’ve come here in search of a discount code for Supersapiens, the best you will get will be a free biosensor here when you buy directly, if you’ve come for the detailed Supersapiens review, please scroll down below this summary. Enjoy!
Verdict: ⭐⭐⭐⭐ - In knowledgeale hands, SuperSapiens is an excellent pro-level performance-boosting tool.
-
Price - 60%
60%
-
Apparent Accuracy - 100%
100%
-
Build Quality & Design - 80%
80%
-
Features, Including App - 85%
85%
-
Openness & Compatability - 30%
30%
Supersapiens, a summary review
Understanding and putting into practice effective, personalised fuelling strategies can make a significant difference. Supersapiens allows you to easily gather evidence to show improved performance with properly fuelled workouts.
There are essentially two types of insights: understanding how your body responds to different foods and the timing of consumption, and preparing your body for optimal performance during a workout. Supersapiens help visualize these effects with glucose indicators, trends, and zones.

Pros
- Realtime data feels correct
- Excellent app, good dashboard all giving clear insights
- Good knowledgebase on the app
- Visualise your response to different energy sources
- Check your glucose performance zone and trends on your Garmin as you race
Cons
- Insights take time & effort to understand
- Garmin integration is hit-and-miss
- Wahoo integration is a tad better
- Supersapiens Band (watch) is not great
- No data export.
- Only one attempt at sensor application
- Expensive

SuperSapiens Background
A company called Abbot first sold the Freestyle Libre Biosensor in 2014 with the initial intention of helping diabetics. Supersapiens use the same sensor and repackage their sports solution around it.

Attach The SuperSapiens Biosensor to your arm
Supersapiens is simple and painless to attach to your body, although the process initially appears daunting as you open the sterile packaging to reveal the sensor and applicator.
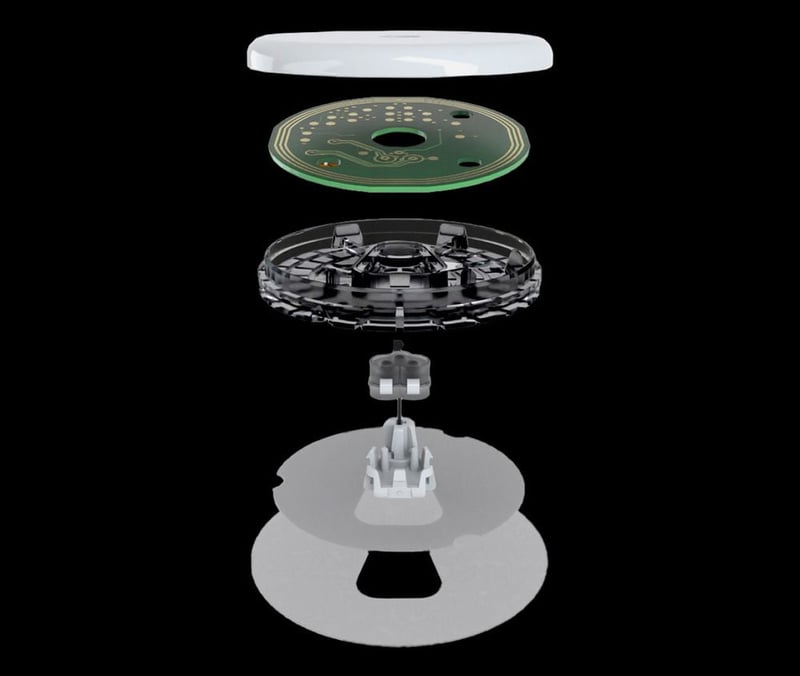
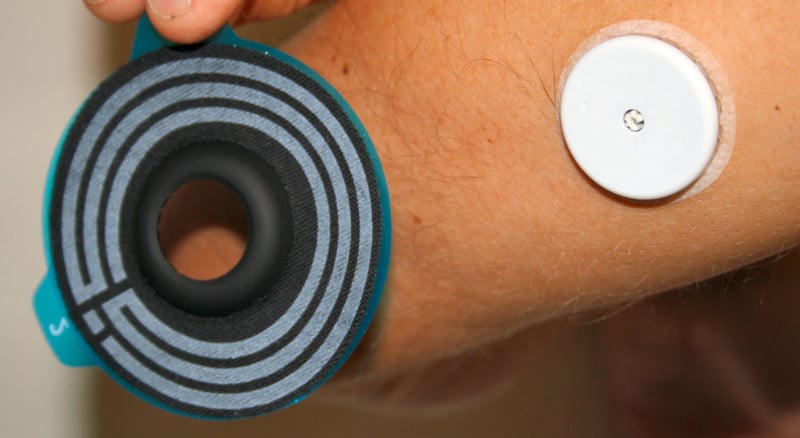
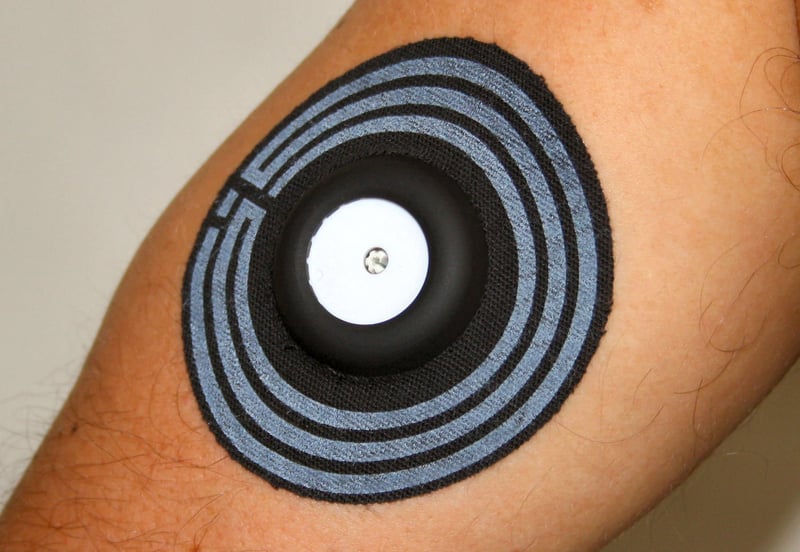
The sensor comprises a flat, thin plastic disc with a tiny filament that is just over 5mm long and which the applicator presses into place. The disc sticks to your skin and then a black cover can optionally be placed over the disc and surrounding skin for protection. I’d recommend using the covers.
I attached mine to my tricep. The first time I did it I asked my partner to attach it but once I understood where it was attached I was able to do it myself from scratch in a few tens of seconds. It is vital that you thoroughly clean your skin and I would strongly recommend using an alcohol swab to remove any body oils. Once Supersapiens comes off it can’t be reattached.
Method: Place the cylinder on your tricep and press the plunger. It clicks and a tiny filament is inserted into your skin with the other end fastened to an adhesive disk full of electronics that sticks to your skin. Optionally a performance patch can be attached to cover the sensor to reduce the chance of accidentally knocking the sensor off.
I did detach one sensor after a few days of wear because I only used soap to clean my skin. I caught the Supersapiens sensor with a sports top I was taking off and the Biosensor came off too.
SuperSapiens – Collecting and syncing the data
The Supersapiens sensor must be paired with the smartphone app. It takes a few tens of minutes to self-calibrate before storing the glucose data in the sensor’s cache.
If the sensor is close by, data is automatically & continuously uploaded to the app by Bluetooth. Alternatively, tap the Biosensor using your phone’s NFC to manually sync the data.
Q: Does Supersapiens measure blood glucose?
A: No. It measures the glucose in interstitial fluids in the skin. It amounts to the same thing.
Q: Where is the glucose data stored?
A: The latest 8 hours are in the sensor and your full history is synced to the phone app and web platform.
Removal and Re-Use
At the end of the two weeks, simply and painlessly pull the Biosensor off and dispose of it. There are no recycling or reuse options I know of.
Navigating The SuperSapiens App
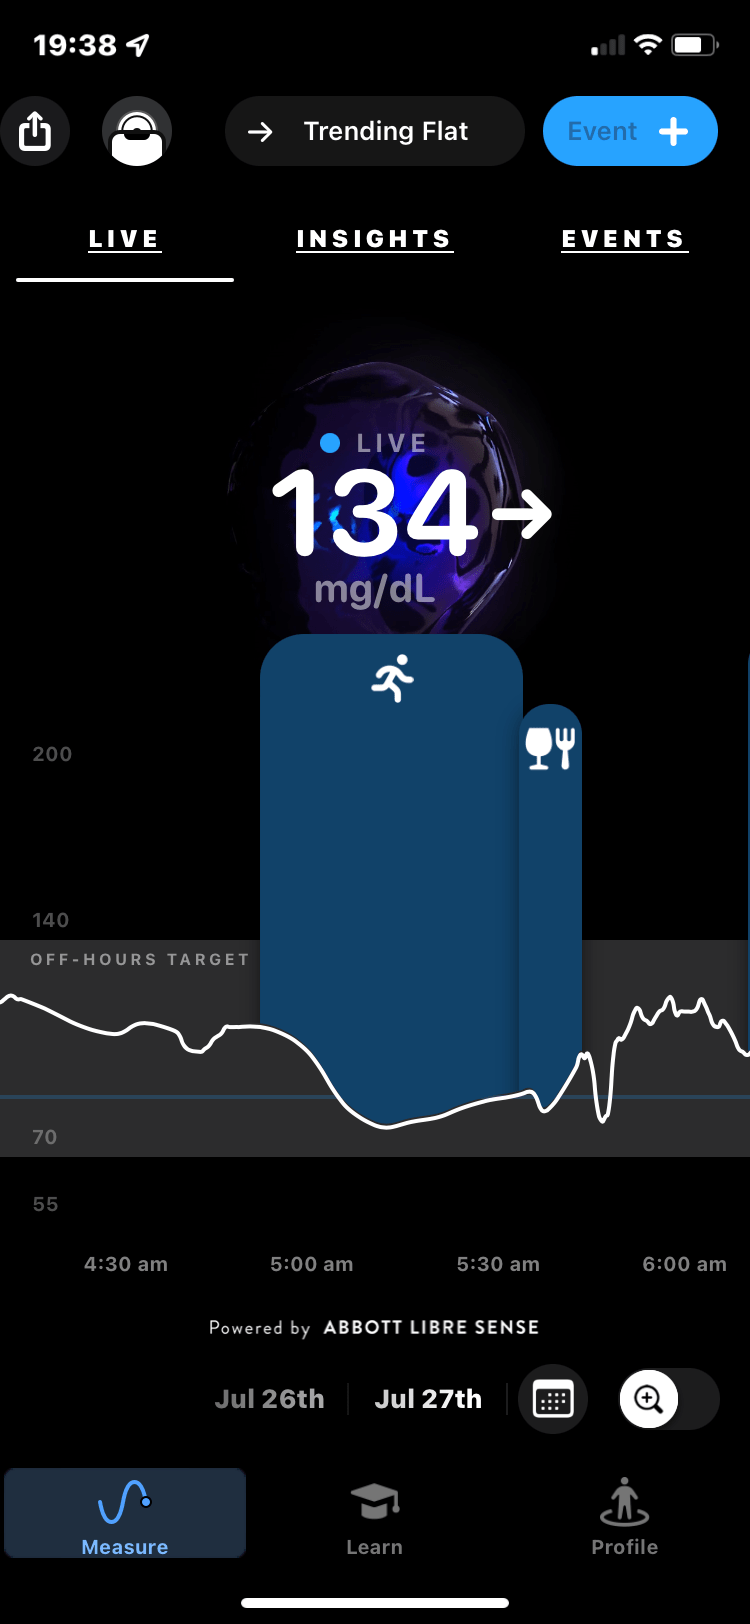
The Supersapiens app has changed a lot over the last year but the key data is still a continuous chart of your glucose levels. You can view the same glucose levels on two tabs to reflect the ideal level when exercising and when not exercising. We’ll come onto that in more detail in a minute.
Workouts from Garmin, Apple and Wahoo can be synced into the Supersapiens app and the start and end times are overlain onto the glucose chart to give the curve context. Further context comes by manually adding tags or events like meals, sleep and mood to the curve.
There’s another tab to quickly navigate to older events but if you want to go much further back in time, Glucose data older than 3 months might only be visible on the web dashboard.
Other than that, the app has a good knowledge base with succinct and helpful content. There are the usual admin features where you can add details to your account, pair devices and link to other sports data platforms.
That’s it!
Connectivity – SuperSapiens Energy Band and Working With Garmin/Wahoo.
Important: A Supersapiens sensor can only link to the SuperSapiens app on your phone or to a SuperSapiens Energy Band on your wrist. That’s it. One of those devices MUST be present to relay the information onwards to your Garmin so that you can view it during exercise.
There is no direct connection to a Garmin or Wahoo sports device and the company has no plans to support Abbot’s newer sensors. So only the Libre Sense sensor works with Supersapiens.
I have found the NFC taps and pairing from the Biosensor to the iOS app to be generally reliable but the links to the Supersapiens Energy Band are flakey at best.
Thus really consider how you plan to use Supersapiens data. If you want to use live data, and many of you will, then you’ll need to carry a phone or wear the band. That’s plausible for cyclists, but less so for runners.
Edit: Now pairs directly to ROAM 2 and BOLT 2 as a BLE sensor
Fuelling – A quick recap
Let’s move on to the sporty stuff.
Endurance athletes use a combination of fat and carbs as their fuel source. The harder you go, the more your body will use carbs. Simplistically we might say that above Z2 you start to use carbs and above Zone 4 your use of carbs is considerable.
You have enough carbs in your body for a hard, hour-long workout – but maybe not to perform at your optimal levels. At some point beyond an hour, depending on your level of fat adaptation, you will run out of fuel as fat is too slow to metabolise. However, if you consume between 90 ~& 120mg/hour of glucose & fructose in a 2:1 or 5:4 ratio then you can extend hard efforts for longer periods.
Glucose Zones
Consider two discrete sets of glucose zones, one for workouts and the other for the rest of the time (off-hours).
Your glucose levels will NOT respond similarly to your heart rate in the context of zones. IE if you slow down then your heart rate will fall to a lower zone but your glucose levels, like muscle oxygen levels, behave in a more complex way and could rise, fall or stay the same. Your goal is to understand the complexity of your supply, demand and lag of glucose and their impact on your performance. #ItsComplicated
Supersapiens Review of Workout Zones
Typically the minimum level of glucose for high performance is 110mg/dl (milligrams per decilitre), maxing out at 180mg/dl but you should be OK to perform easy workouts at 80-110mg/dl
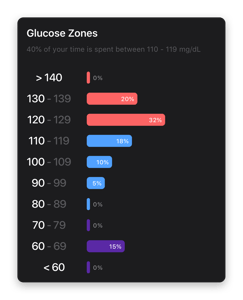
- Blue Zones – Maybe low-level endurance-type workouts
- Red Zones – higher intensity and threshold workouts
SuperSapiens has tests you can perform to validate and personalise your glucose zones.
Off-Hours Zones
When not exercising, a range of 70-140mg/dl is expected and the zone you are in will be determined by what and how you consume your food.
- Inflammation (>140 mg/dL)
- Glucose Loading (90-140 mg/dL)
- Adaptive State (70-90 mg/dL)
- Impaired Recovery (<70 mg/dL)
Thus off-hours glucose zones are valid for loading and recovery, plus you will want to be mindful to avoid prolonged, high levels of glucose.
Q: Why Supersapiens – Benefits Found Throughout The Review Process
You already know you need fuel to perform. Supersapiens measure the availability of fuel (glucose).
Digging deeper, many issues affect the rate of supply of fuel, your ability and speed to burn it (demand) and what happens if there is an excess or deficit of glucose. You will discover what foods affect your glucose levels, how quickly they act, whether there is a spike in delivery or a more gradual release and the difference caused by the order in which you consume food types. You will see how your body’s glucose levels respond to aerobic or anaerobic activity and may even want to revisit your training and racing HR/Power zones as a result.
So there are a LOT of potential benefits to consider, perhaps too many. Looking at your Supersapiens data can become daunting and confusing as a result. So it’s best to approach using Supersapiens to understand or solve a few specific issues.
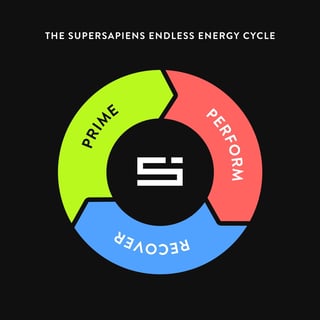
You might consider these broad areas
- Lifestyle usage – away from exercise you will want a lower, relatively stable level of glucose.
- Pre-workout (Prepare) – as you approach exercise you will want to ensure you are fuelled from the get-go but also that the initial pre-fuelling lasts until your next fuel intake
- Workout (Perform) – you will want to maintain a higher-than-normal, relatively stable level of glucose regardless of your exercise intensity
- Post-workout (Recover) – you will want sufficient levels of glucose to aid glycogen replacement but not so much as to exacerbate inflammation.
My Supersapiens Tests
I’ve used SuperSpaiens on and off for a year now. I’ve had some good tests and some bad ones, some interesting ones and some inconclusive ones. Here is a flavour of a few of them, starting at easier intensities.
Aerobic Threshold Run validation (sense-check LT1 determined by dfa a1)
A dfa 1 analysis of my HRV data determines my LT1 to be MUCH lower than I would be predicted based on zones derived from threshold tests at LT2 and based on ‘feel’. I am not alone in this observation and I know others who find the same. So I thought I would explore my glucose levels at those kinds of efforts to see what happens.
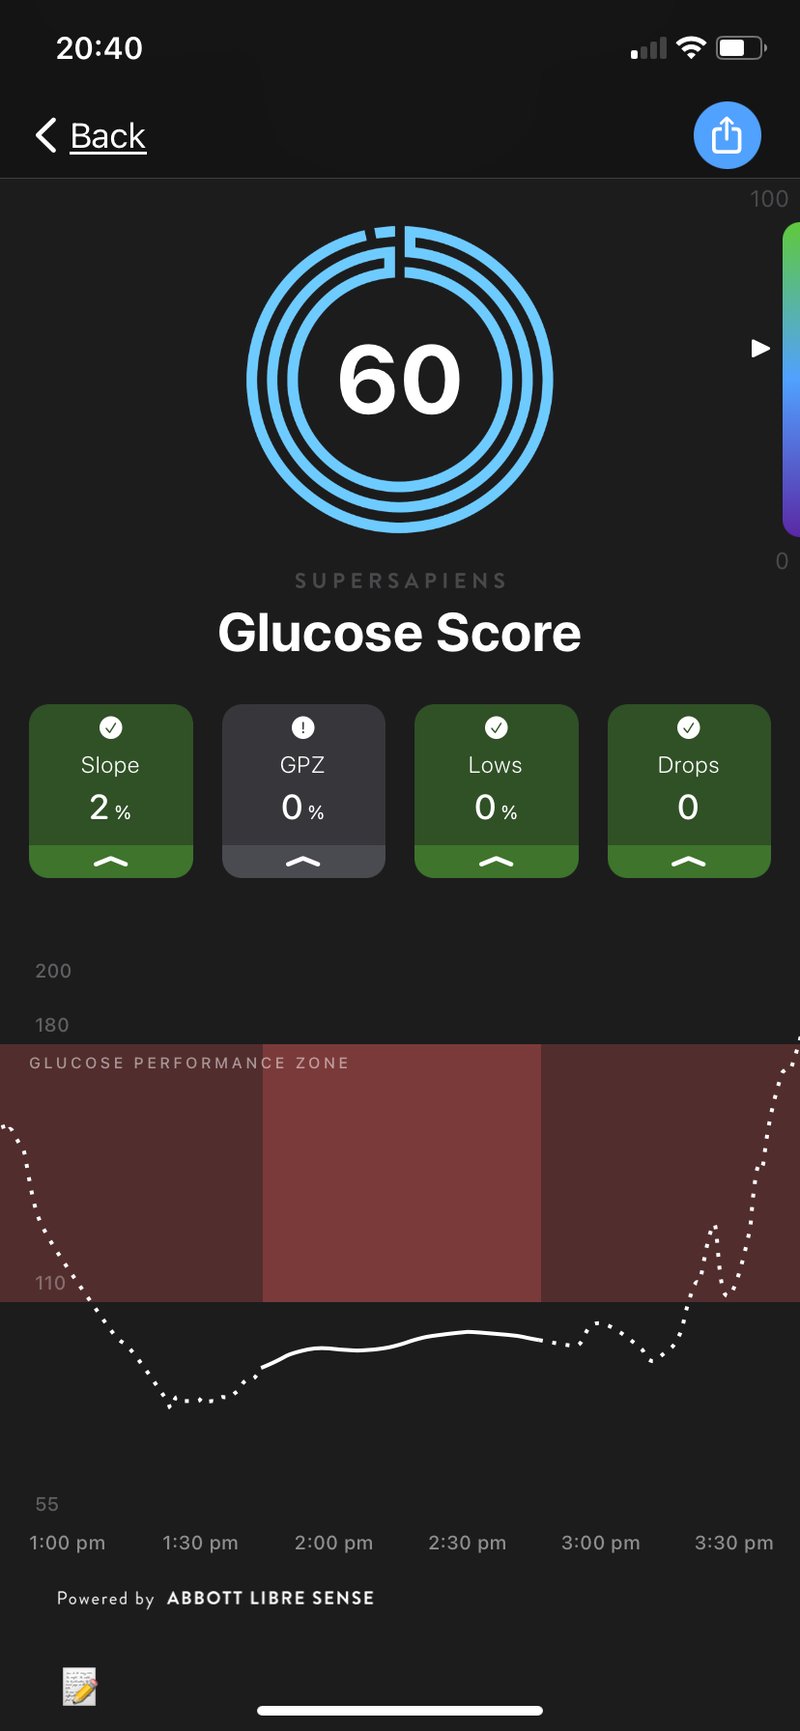
Running at a dfa 1 derived LT1 should be fully fat-burning. As the following chart shows, that could be the case as I spent zero time in the Glucose Performance Zones.
That’s a plausible result.
Next, I tried the same test at my z2/z3 boundary (LT1) as derived from an LTHR-type threshold test (LT2) and see what happened.
A Non-Fuelled, Low-Intensity Workout
My understanding is that endurance workouts should be mostly fuelled by fat-burning and that a relatively stable and low glucose reading should be expected. Indeed that’s what I found again in this easy run of 70 minutes even though it was at a slightly higher exertion than the previous test.
Clearly, the glucose level is lower here and I don’t know why. I was better fuelled going into the workout so maybe that was a factor.
The slope for this test was negative (-4%) whereas for the dfa a1 level test was positive (2%).
So I’m not entirely sure what to make of this test as I was running harder than in the slower DFA a1 level test. The effort level I was using to represent my aerobic threshold seems more correct here than the lower level suggested by dfa a1. But had I continued for longer in each case perhaps the effects of pre-workout fuelling would have been removed.
Take Out: From these kinds of tests, I am fairly happy that they probably are the fat-burning workouts I intended them to be. If there was more variability or if the glucose dropped low then I might have something to look closer at but these seem cool to me. There may well be an argument that I could still have kept the glucose levels higher with some fuelling and that might have aided recovery(instead I ate afterwards)
One way to use Supersapiens is to iterate tests, varying the conditions on each one to learn something new. That’s great if you have the time and resources.
A Fasted, Non-Fuelled 150-minute Ride With Hard Efforts
The night before this test, I had yoghurt/fruit (carbs) and not much else for an evening meal. At 8:30 in the morning, I had 4 slices of granary bread toast (carbs) and a less-than-liberal splattering of jam (carbs), coffee too…obviously.
Four and a half hours later, I started a two-and-a-half-hour ride to the Surrey Hills starting at 1 PM. I took water as it was hot plus an emergency gel in case I bonked. To fuel the ride, I hoped to use the carbs in my liver, my muscles, and anything still in my intestines from the morning and the previous day.
The plan was to exhaust my carbs and simulate the phenomena of blurred vision and disorientation that I sometimes get and which opticians say can be caused by blood sugar levels. Thus my starting assumption was that this effect was due to running out of carbs but there could be a dehydration effect too. Anyway, this test could shed light on the cause.
The first Supersapiens chart, above, is interesting. You can see my glucose levels fell below the performance zone halfway through the ride and that was soon after the second hard hill effort. The 64% GPZ reflects the amount of time spent above the line ie when I was in an optimally fuelled zone.
During the workout, I was continuously under/over LT1 (aerobic threshold) and mostly in my comfort zone except for two very hard 7-minute efforts (Z4/Z5).
Despite all of this, I did NOT replicate the dizziness feeling. However, I perhaps felt the onset of it as I arrived home.
Take Out: Maybe I am better fat-adapted than I thought. That said, I certainly would have performed better if I fuelled this workout. Considering I performed fairly well, I was surprised that I was able to do that with low levels of fuelling and that my glucose levels for the first half of the ride were OK.
I would expect glucose levels to rise during my Tempo efforts but for the VO2max efforts, I would expect Glucose supply to fall behind consumption and for the curve to fall, which it looks like it did.
The whole Glucose chart could have been shifted upwards by pre-fuelling and mid-ride fuelling. That would probably have helped me during the VO2 efforts and probably also helped me make the ride home easier than it was.
Fuelled vs unFuelled near Maximal Workout
This is an excellent 3rd party test by Josh Coxton at Cycling News, used with permission. It’s a hard way to prove what you already know to be true.

Takeout: Even at sub-hour durations, harder efforts are better when fuelled!
A Fuelled 40-minute effort
This bike workout was a hard, 40-minute tempo/threshold effort on an undulating route finishing with a recovery ride home. There was fuelling 40-50 minutes before the hard effort started and also just after the hard effort started.
The first image shows the approximate timing of 2 fuelling events before and during the ride and then the same glucose curve from the first image is given context in the second image where the Glucose Performance Zone is shown in red.
I did a reasonably good job fuelling this ride. I had the first gel slightly too early and the second gel only just got me to the end of the 40-minute effort that followed it. Had I needed to go 20-minutes longer I would have dropped below the Glucose Performance zone for sure. As it was, the low point of the glucose levels marked the subsequent recovery in glucose levels as I headed home at an easy pace. That said, if I had planned a further 20 minutes I would have fuelled a third time.
The third and fourth images show my glucose sub-zones during the workout and also in the context of average and pre-event levels.
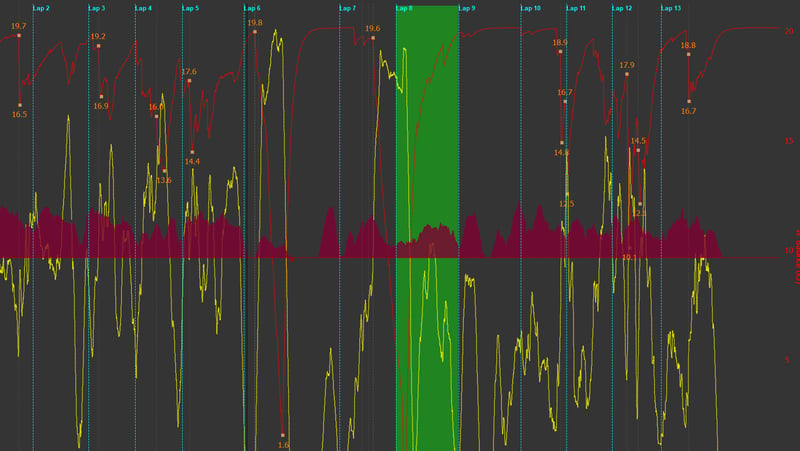
The following image from Golden Cheetah shows my HR hovering in Z3/Z4 and it also shows W’ bal which is the depletion of my anaerobic reserve, indicating likely periods of higher fuel usage from carbs.
Take Out: The positive effect of fuelling is clear when this workout is compared to unfuelled ones. Glucose levels are notably higher here and always in the performance zone when it matters.
We all know that we need to fuel ourselves to perform and to recover, yet perhaps some of us might be more guilty than others at sometimes taking fuelling less seriously over shorter rides. Having this data gives clarity to your fuelling status and performance. There is simply no avoiding the broad reality of the data.
Pre-fuelled 4x Short, Hard Hill reps – not the profile you might expect.
Here we have one gel taken 30 minutes before the start of the first hill. Whilst the HR profile shown further below is what you will expect, the glucose profile is not. Like this…
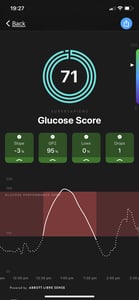
This wasn’t a maximal effort but not too far off. I found it interesting that such relatively short efforts could completely deplete my glucose to the bottom of the performance zone (above). And the image below validates that W’bal is eaten into quite significantly. I’m almost certain that readers who have read this far have completed significantly more intense workouts than this. How did you fuel them? You would need quite a bit more fuel than I used here.

Take Out: In future, I will be super-mindful of the fuelling needs of relatively intense efforts. In the context of longer rides, short hills or sprints like these will make for an uncomfortable time for hours riding afterwards.
Fuelled, 2-Hour Windsor Loop (one hour Z3/Z4, one hour easier)
A 2-hour Windsor loop with pre-fuelling and fuelling halfway through was enough to be properly fuelled for the entire duration.
Take Out Glucose levels rose at the halfway point because of fuelling AND an easing off in effort.
Supersapiens Review & Gel Test
I thought this was interesting.
3 hours before the ‘Gel Test’, a coffee +cake marked the end of a 2+ hour workout. So I assume my blood sugar levels are ‘normal’ at the start of the test.

I decided to take a sports gel and see what happened. I was interested to see how long it took to get into my bloodstream. Take a look.
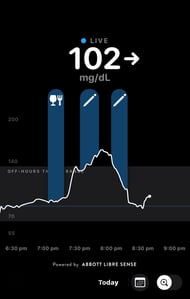
The chart is hard to annotate so I created some events on it to highlight points on the curve at certain times of the day.
- I took the gel at exactly 7 PM, the start of the first vertical blue line. And then not much happens for a short while.
- The second blue vertical bar starts at 7:30 pm. So you can very clearly see that the gel is already working its magic and the mini-peak is about 20 minutes after taking the gel
- The true peak effect is at about 7:50 ie nearly an hour after ingestion
- The effect seems to end at 8:15 pm.
Obviously, if I was doing anything other than sitting down or had a full stomach, the energy-usage impact on the glucose curve would be very different.
Take Out: Gels starts to work on me after 20 minutes. How long do they take to become available in your bloodstream? Are you sure? Kinda important.
Tests In General
You probably have valid ‘what if’ points or criticisms about every one of these tests. Fair enough.
You can test and test and test again. My time is limited and even the more affluent readers here who can afford a continuous supply of SuperSapiens only have limited time. So unless you have a coach who can analyse this kind of data you have to think carefully about what you want to get from using SuperSapiens and how you plan to do that. You could apply a similar argument to finding an optimal aero position or many other tweaks to your training…the more you iterate the closer you get to the right answer. #Time
When I first heard about Supersapiens well over a year ago I just thought it would be enough for me to learn how long gels took to work and then to constantly monitor glucose levels live as I run/ride and react/plan accordingly. Even though I do slow twitch endurance training I now suspect that my fast twitch abilities are better than they should be, thus I can turn on the gas when I need to and the unexpected learning for me is the rather savage hit on glucose that has.
It’s all kinda obvious in hindsight but when you understand ‘things’, they tend to fall into the obvious category!
SuperSapiens Suitability for Endurance Distances
SuperSapiens is certainly useful for managing any level of effort that might involve carbs as a fuel source whether you are a pro or novice.
It’s hard to generalise and say if it’s right for you over a specific race distance. TdF riders use Supersapiens on 4-hour hill stages but maybe it isn’t going to be useful for your leisurely 5-hour Sunday ride. Kristian Blummenfelt used SuperSapiens in his recent demolition of the 7-hour IronMan barrier but it will be of much less use to a 14-hour Ironman finisher who knows how to stay aerobic…but more useful to a 14-hour finisher who tries too hard.
Over shorter distances like an HM or standard/Sprint triathlon then I suspect many of us could benefit from understanding rapidly depleting glucose levels.
That said, most endurance athletes can also improve their lifestyle, training and race-prep with SuperSapiens. So there are many benefits to be had if you want to stump up the cash and devote some time to using the insights you gain.

Let’s come back to some of the finer points of the tech
SuperSapiens Metrics
The basic raw metric is glucose levels expressed in mg/dL, refreshed every minute. That’s it. It’s shown as a curve on the app and as a live value on the CIQ data field.
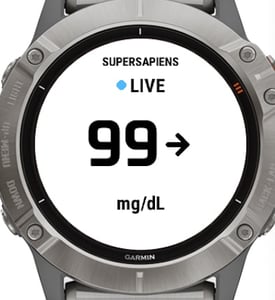 We’ve already covered the on-hours and off-hours zones when exercising and recovering/prepping in this Supersapiens review. However, Supersapiens also provide various averages and trend indications to help you with your training and with the understanding of your training.
Live Trend: Either the Supersapiens Energy Band or the Supersapiens CIQ Data Field on Garmin show the raw metric plus its recent trend. Thus the arrow next to the number indicates whether the level is rising, falling or stable. This is very important information to know when training hard or racing simply because of the lag effect of consumption and expenditure of glucose.
Trailing Stats – 4-hour and 24-hour averages are shown for the build-up to your workout, these indicate your levels of pre-fuelling. There are also indications of variability/stability over the same time frames and you want to aim for stable levels.
Workout Stats – Workout average and variability are again covered and added to those metrics are max and min levels. Again, you want to aim for stable levels of glucose in the correct performance zones.
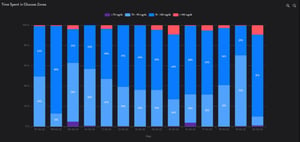
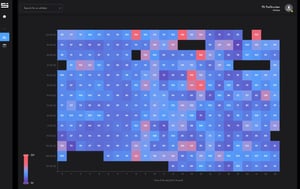
Longer Term stats – are found on the web dashboard where you can see more information on the times spent in each zone and heatmaps of your glucose states over different times of the day and days of the week.
Login to your Supersapiens dashboard here.
Supersapiens Data Integrations Review
Apple Health, Garmin Connect, Training Peaks, and Nolio can be linked to Supersapiens to import completed workouts into your Supersapiens app and dashboard. You definitely want to enable this so that Supersapiens understand when your workouts start and finish.
Q: What are the Garmin devices that support SuperSapiens?
A: These Garmin devices and newer are supported: Forerunner 245, Fenix 5 Plus, Venu, Vivoactive 4 and Edge 130. (Full List Here). Thus Epix 2, Edge 1040 and Fenix 7 are all good but at the time of writing, FR255, Enduro 2 and FR955 do not work.
None of the integrations sends glucose readings from Supersapiens. Furthermore, the CIQ data field does not yet write glucose levels into the FIT file at the end of your workout. Thus you can only the glucose data out of Supersapiens from the online dashboard in a simple CSV table.

In October 2023 the Apple Watch became available to show live readings although, in this case, the Apple Watch merely acts as a VIEW to what is shown on the iPhone at the time.
SuperSapiens Biosensor Alternatives – Review
Various strip-based sensors give one-off readings with hand-held sensors. These don’t give you continuous readings and the insights that can come from them.
Other sensors like Medtronic, Dexcom G6, Eversense and other Abbot Libresense sensors do offer continuous monitoring but are geared toward diabetes management.
The unique angle for the SuperSapiens Biosensor is their sports-focused app and integrations with sports platforms.
Essentially there is no sports-based alternative!
An interesting alternative metric to measure is muscle oxygen using products like Train.Red, NNOXX and Moxy Monitor. NNOXX also has the advantage of measuring Nitric Oxide (the regulator of muscular blood flow). Whilst Supersapiens addresses acute under-fuelling, the consideration of muscle oxygen can help you acutely adapt your physiology to the energy demands of your sport.
Supersapiens Review – Accuracy
Abbot says it’s “Not for medical use. Not for use in diagnosis, treatment or management of diabetes or any other disease.”
Bailey et al conclude this
Interstitial glucose measurements with the FreeStyle Libre system were found to be accurate
compared with capillary BG reference values, with accuracy remaining stable over 14 days of wear and
unaffected by patient characteristics.
Source: freestylediabetes.co.uk
Abbot’s own data using EGA/MARD suggest reasonable levels of accuracy.
I haven’t tested the accuracy of the Libre Sense sensor. You could probably test it against strips but there will be variability between blood glucose and interstitial fluid glucose (Supersapiens measures the latter). If you google some results you will see that some people have experienced strange results in the first 24 hours and others question some of the higher readings that Supersapiens reports. You might also find that high-level athletes with low-fat levels experience greater levels of inaccuracy.
Replacing Faulty SuperSapiens Sensors
SuperSapiens do replace the sensors for free in some circumstances such as faulty units that stop working before the two-week period is up.
I suspect the company is here to make friends rather than alienate lifelong customers, however, if the sensor is not working because of something that is your fault then I wouldn’t necessarily expect them to be super-accommodating. You can always ask.

Supersapiens Review – What I Learned
We might know generic estimates of the amount of fuel required for our workouts and races. Supersapiens gave me much more of an understanding of how my body processes and uses carbs, both in sports and throughout the day.
- I fuel races correctly but tend to borderline under fuel higher-intensity workouts
- I under fuel longer, mixed-intensity rides
- My diet could be improved from both a macro/micro level but my glucose spikes are generally well-controlled
If I had to answer the question, “So what have you changed as a result of testing Supersapines?“. The most profound change would be to how I consume my calories, I tend to avoid eating late in the evening, snack but snack less and I tend to eat the carb portion of my meals last. All of that seems to boost the stability of my off-hours glucose levels.
I now fuel more for every kind of workout both before and during. I probably should also have more after the workout but I found there was a danger of overeating when I do that.
I’ve even set fuel and hydration reminders on my Wahoo bike computers to force myself to eat and drink more regularly.
For a hard workout of 30-120 minutes, I would typically now try to have at least 3x SiS Beta 40g CHO/hour and one of those before I set off.
For longer workouts of 2-5 hours, I still haven’t quite sorted myself out there. First I have eggs (!) for breakfast which seem to blunt glucose spikes, and then I pre-fuel well with carbs including porridge, some fruit and other things. I tend to have a dual source energy drink (SiS 80g CHO) to cover the first 2 hours plus a gel after an hour. I then repeat that after a mid-ride coffee + cake stop.
What I need to do more of is to micro-manage my levels more frequently during the longer rides with live readings but as I prefer to use Wahoo, that’s a bit more difficult as it involves also using the right watch and my 955 is currently unsupported and not paired to my bike-phone in any case. grrr. (I do have the SuperSapiens Band)
Thought & Review Of The Cost Benefit of Supersapiens
One advantage of Supersapiens is that you can buy a few sensors and then use them when you want to, so you’re not tied to a regular monthly commitment.
However, using two sensors a month can become expensive very quickly over years of use. But if you were planning to use them for one season as a build-up to the A Race of your life then the cost of Supersapiens falls in line with many other bits of performance-enhancing kit you might choose to buy.
Suggestion: Check your Garmin supports the data field. Buy 2 sensors (get one free with the offer below) before your A race and use them for the 6 weeks up to and including race day. That will cover your race and will also cover the peak period of your training which involves the most high-intensity work. Fuel all of that properly and diligently. Read up some more on carb loading and glucose levels when tapering and do that. If you like them…buy some more. If not. Don’t!
Buy SuperSapiens, Cost, Discounts, Price & EU, USA, UK Availability
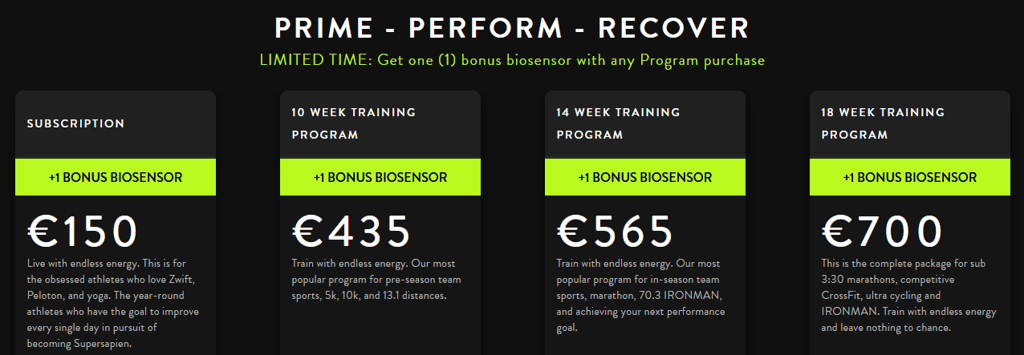 The Supersapiens Performance Patches have an expiry date so buy with caution from trusted sources like SuperSapiens or athletes you know.
The smartphone app and Garmin CIQ app are free and there is no subscription cost. Sensors vary in price depending on how many you buy. A pretty good deal is shown above and on the right where you can buy two sensors and get one free for Eu150 making the price of a Supersapiens sensor Eu50 each. This is a lower-cost offer compared to any of the larger bulk-buy packs eg The buy 9 sensors and get one free for Eu700 deal works out at Eu70 each… ie Eu20 is more expensive.
More Info: supersapiens.com









Does the Energy Band sync the data to your phone after workouts? Or is it just a realtime display that doesn’t store data? Seems like that’s essential for runners.
Incidentally, I agree that 6 weeks prior to a big race seems like a good use case, and not just because of price. I think having the patch on all the time would get old pretty quick, but having it on for a shorter stretch could also serve the psychological purpose of reminding you to stay focused on the task.
Also, like a lot of monitoring technology (heart rate, power, muscle oxygen, lactate, etc.), it seems like there’s a natural time horizon to getting the most out of it. You start off taking a ton of measurements and not really knowing what to do with them. Over time, you start to get a better sense of what they mean, how they correlate with perceived exertion and performance, etc. Then you get to the point where you start really getting some new insights out of the measurements. But eventually, you’ve seen enough data that you pretty much know what the it’s going to show before you even look at it. After that, you end up collecting the data that’s easy to collect, or you make the effort only when you think it’s really important.
Thanks for the review!
yes the energy band syncs back to the phone when the workout is complete. from memory the workout must be at least 15 minutes long.
yep there is definitely a case of data overload for many of us. And if you are starting out then supersapiens glucose data shouldn’t be first on the list.