Is Whoop 5 / MG Accurate? – A Definitive Answer
Almost all reviews of Whoop will consider its heart rate accuracy during sporting exertion levels; the better ones will overlay multiple tracks from different devices and consider different sporting scenarios. I’ve done that as well, as shown below.
So what?
Does that mean strain is accurately assessed by Whoop or not? The answer might surprise you.
Does it mean recovery and readiness are accurate? Those are key aspects of Whoop’s app.
Finally, especially if you have opted for Whoop MG, what about the accuracy of sleep and wellness metrics such as blood pressure trend and ECG? There’s a lot more to accuracy than a HR track when running.
I’ve performed many tests on Whoop MG over the last few months, and the key results are shown below. The results almost certainly equally apply to Whoop 5.0, as I have detailed in this link. Whoop 5.0 and Whoop MG share the same sensor, and the difference in the models is that Whoop MG has an additional ECG module activated.
In Brief: Whoop is accurate at determining Strain when worn on the biceps during endurance sport, much less on the wrist. When worn on the wrist outside of sport, it is sufficiently accurate to be an input for a readiness score. Whoop’s other raw metrics are generally fine to use for guidance.

Adverse Impacts on Accuracy – factors affecting Whoop
All wearables rely on the accuracy of their raw data for the many insights they provide.
You should understand that if you continually use, for example, bad heart rate workout data, then pretty much every single insight will be wrong.
With that in mind, understand and avoid these issues as appropriate. These are food for thought.
- Wearing an optical heart rate sensor on the wrist during sport is prone to error in many circumstances. Your mate might say their Garmin watch is accurate. They mean that they trust it to be accurate – it isn’t. Sports watches are not inherently accurate devices (HR).
- Using heart rate data to determine muscular strain or calories when engaging in strength training is wrong. It just doesn’t work. If you follow a strength workout in Whoop, the company’s algorithms can give significantly more accurate muscular strain than all other everyday wearables because it tracks aspects of your motion, applying non-HR algorithms. Reviews keep looking at heart rate accuracy during strength training – it’s largely pointless.
- Strain is determined from time-in-HR-zone; if your HRmax or zones are wrong, then your strain is wrong. When you see people get a 21 Strain score on Whoop, this is why.
- Slightly inaccurate heart rate may still be linked to the correct zone, and thus it can calculate ‘sufficiently accurate’ strain. What are you trying to measure, precise heart rate or an actionable strain estimate?
- Two methods are scientifically validated to determine what is commonly called ‘readiness’. One compares a nightly average of passively recorded HRV to your baseline, and the other compares actively recorded waking HRV over 1-3 minutes against your baseline. There are numerous issues here.
- The measures of ‘readiness’ merely consider your resting physiology. Not your readiness to exert yourself. Maybe it’s sometimes a good proxy, maybe not.
- The morning method can be improved if the reading is always taken when standing. This requires an actively taken reading, so no wearable usually relies on the standing method (Orthostatic test).
- The average nightly HRV will be impacted by unusual events performed close to bedtime, such as alcohol, eating or late exercise. The morning reading could well eliminate such influences in its calculation.
- Whoop takes selective HRV readings throughout the night, most likely focusing on periods when data quality is higher. All wearables will likely omit specific periods during the night simply because the HRV data can’t be calculated. The Apple Watch is even worse, taking periodic readings approximately 15 minutes apart – your Apple Watch readiness app isn’t accurate.
- Whoop can broadcast heart rate. It can also directly save a workout to the app. In the typical latter case, you will notice that the workout is processed on the Whoop cloud upon completion. The processing cleans the data, and the result could differ from data captured by a 3rd party device using live broadcast data. Whoop’s strain metrics always use this cleaned data, not the broadcast data. Ask which Whoop data a reviewer used.
- Some things just can’t be determined by wearables. I’ve noted on this site for years that sleep stage data cannot be correct for technical reasons. Other reviewers now acknowledge this, but it’s also worth understanding that some sleep stages are easier to detect more accurately than others. To look at the accuracy of sleep stages, it might be more useful to ignore N1 REM entirely, as that is hard to get right. As shown below, wearables might usefully try to measure deep sleep. From the sporting context, this is important as physical adaptation to exercise is believed to skew towards happening in Deep Sleep.
| Sleep Stage | PSG Inter-scorer
Agreement (κ) |
Wearable Detection
Accuracy |
Why |
|---|---|---|---|
| Wake | ~0.76 | 93–95% | Clear EEG and movement patterns;
wearables detect wake well via actigraphy and heart rate. |
| N1 (Lightest NREM) | ~0.40–0.41 | 40–60% | Subtle EEG changes;
wearables lack direct metrics, relying on heart rate and movement. |
| N2 (Light NREM) | ~0.67 | 60–75% | EEG spindles and K-complexes are detectable in PSG;
wearables infer via heart rate and actigraphy. |
| N3 (Deep Sleep) | ~0.67 | 60–85% | Dominant delta waves in PSG;
wearables use indirect signs like low heart rate and minimal movement. |
| REM | ~0.86 | 50–75% | PSG uses EEG, EOG, and EMG for clear REM detection;
wearables infer from heart rate variability, missing eye movement and muscle tone data. |
- Consider how a 30-second active ECG reading can detect a heart rate anomaly. It probably can if the anomaly happens in those 30 seconds, but the chances of you catching it could be extremely low. Only a passive, continuous ECG is useful for most people. I can’t test the accuracy of Whoop’s ECG as I don’t have a heart rate anomaly.
Whoop 5 / Whoop MG Sports HR Accuracy – biceps
There were some minor accuracy issues when I first started using Whoop MG. Talking with another reviewer, we agreed that this problem seemed to disappear, perhaps due to a firmware update, although Whoop lists no accuracy-improving firmware on its support page.
TL;DR – Whoop is generally excellent, sometimes even better than the HRM Pro Plus chest strap I used, later replaced with Garmin HRM 600.
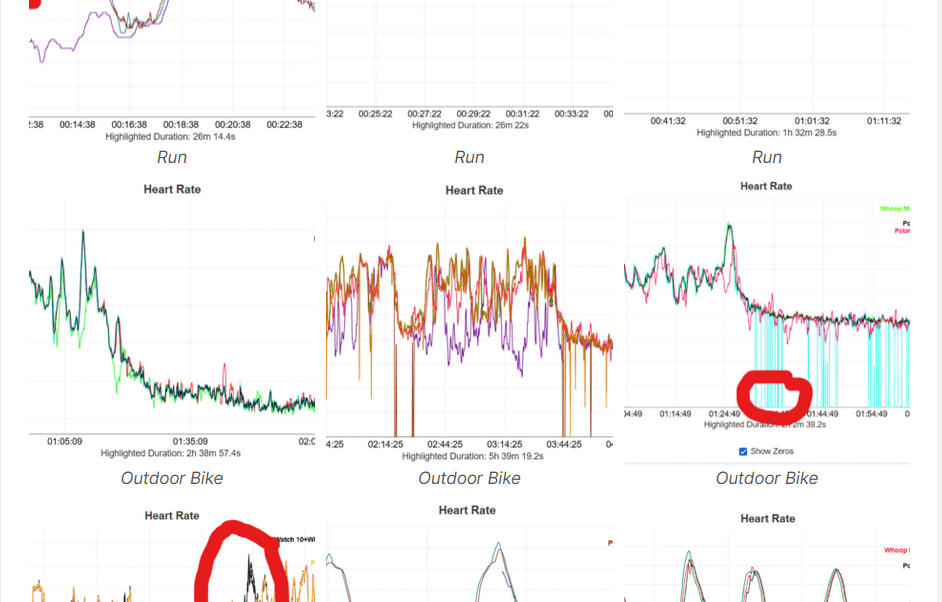
The following charts cover a variety of sports and activities, almost all falling under HYROX Simulation or Triathlon – indoor bike, indoor run, treadmill, gym stations, outdoor run, open water swim, outdoor road bike, and outdoor gravel bike. Generally, these are recorded directly to another device (Garmin/Apple) and are raw, broadcast HR captured by either a Garmin or Apple watch.
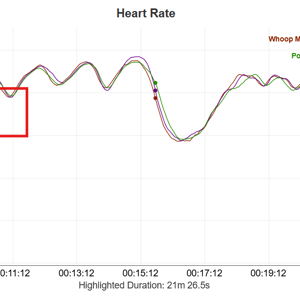
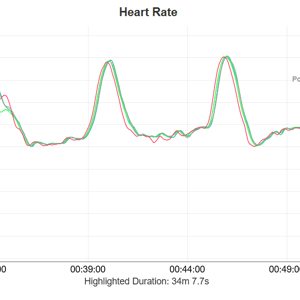
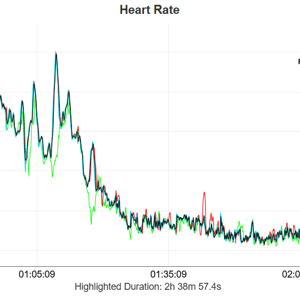
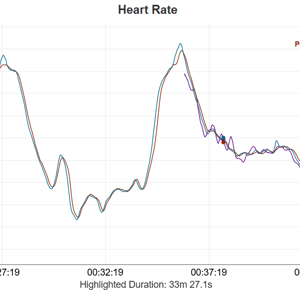
Occasionally, there are minor issues at the start of a workout, and at other times, there can be slight variations from the actual HR.
Interpretation of results: When worn on the biceps across various sports, Whoop is undoubtedly accurate as a source of live broadcast HR and for calculating strain for endurance activities. It’s more accurate than a Garmin ELEVATE 5, more accurate than a slightly faulty HRM Pro Plus, but not quite as accurate as Polar SENSE.
Whoop 5 / Whoop MG Sports HR Accuracy – wrist
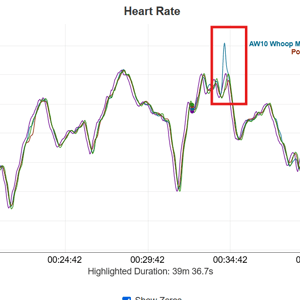
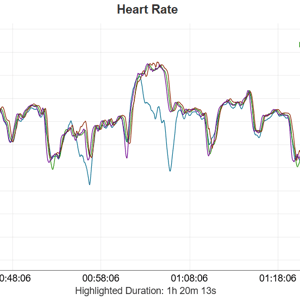
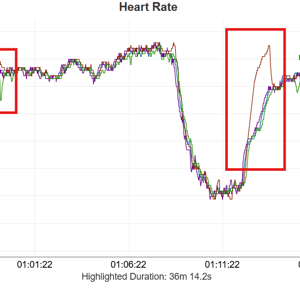
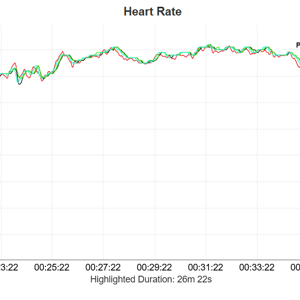
Moving Whoop to the wrist, I was particularly interested in how its performance at HYROX changed. HYROX is not a million miles from being physiologically similar to sprint duathlon/triathlon (threshold), albeit with a more significant strength component. More importantly, there are more wrist movements when pulling, carrying weights, doing burpees and wall balls – but ski erg, and row erg are normal endurance activities. CrossFit would introduce further wrist movements than HYROX.
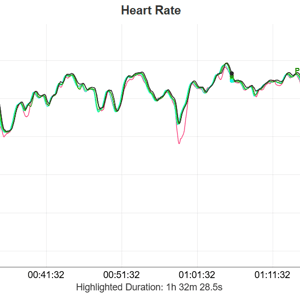
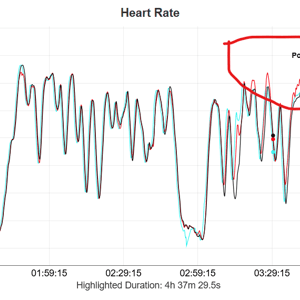
Interpretation of results: There is an evident deterioration of accuracy when Whoop is worn on the wrist. Hopefully, these six workouts are enough to convince you of that! HYROX Sims and the Road Ride-Image 4 show marked differences from the real HR. While the other three charts show values that will probably create accurate strain results, these three will not.
Why?
Both HYROX Sims have incorrect heart rates with recorded values in HR Zone 5; the higher the heart rate, the disproportionately higher the overall strain. Significant and extended peaks quickly create an incorrect workout strain.
I manually calculated strain/TRIMP with the original Whoop several years ago and compared it to a reference source. There were apparent differences in the two sets of HR data, but the resulting strain calculations were similar. Ie for Whoop’s strain calculation, you do not require pinpoint accuracy with the heart rate track. If you want to use heart rate from the wrist for pacing an endurance effort, my comment would be different! (Use a chest strap.)
Remember also that all these six charts, as well as being on the wrist, are post-processed in the Whoop app, so this data may have been changed by Whoop (that’s Ok, it’s a valid thing to do) and be different from what would have been broadcast to a bike head unit or gym display.
Whoop HRV Test Data Correlations
Each morning (n=31), I took a 2-minute rMSSD reading with HRV4Training using a Polar H10 while lying down. I also recorded the average nightly HRV (rMSSD) from Eight Sleep, Oura Ring and Whoop MG into that software. After a few weeks, the software performs two correlations between the values each day and how the trends correlate.
As different HRV protocols are used, I would expect the day-to-day correlation to be different (it was). Still, the baseline correlation/trend from each tool should match HRV4Training as these three tools all use similar calculations to estimate the same thing, ie the recovered state of your resting physiology.
Results: There are over 30 data points, and no correlation to the waking reading taken with a Polar H10, as this table shows.
| Tags | Day-to-Day Correlation | Baseline Correlation |
| Oura |
r=0.43
|
0.30
|
| Whoop MG |
0.30
|
-0.28
|
| Eight Sleep |
0.24
|
0.12
|
Interpretation of results. In the past, I have had similarly bad correlations with Whoop and with other tools. I have also had periods when I got r>0.9 with Whoop 4, ie periods when there can be an excellent correlation.
Further RMSSD Correlations
However, if we correlated only those tools that take overnight readings with each other, then there should be greater similarities.
- Oura vs. Whoop MG: r≈0.841, n=30 : Strong positive correlation, indicating that Oura and Whoop MG RMSSD measurements tend to move closely together.
- Oura vs. Eight Sleep: r≈0.609, n=30: Moderate positive correlation, suggesting some consistency but less agreement than Oura vs. Whoop MG.
- Whoop MG vs. Eight Sleep: r≈0.775, n=30: Strong positive correlation, but slightly weaker than Oura vs. Whoop MG.
Whoop MG is likely the best tool for measuring nightly RMSSD when considering variability. It shows strong correlations with both Oura (0.841) and Eight Sleep (0.775), indicating good agreement with other devices, and has the lowest variability (SD ≈ 4.32), suggesting stable measurements. While Oura and Eight Sleep also appear reliable, Oura’s weaker correlation with Eight Sleep (0.609), higher variability, and Eight Sleep’s intermediate metrics make Whoop MG the most consistent across the dataset.
Sleep Accuracy
For fun, I compared the accuracy of the number of minutes recorded by each tool for REM and DEEP sleep.
Deep Sleep
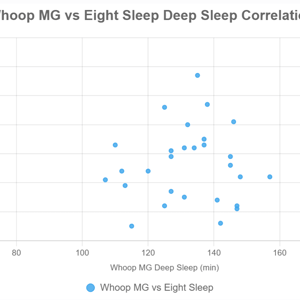
Correlation Summary:
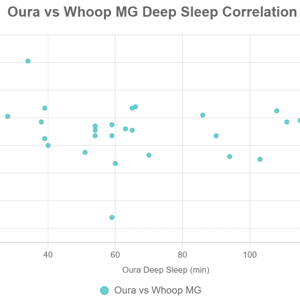
- Oura vs. Whoop MG: r≈−0.161, n=30 (weak negative)
- Oura vs. Eight Sleep: r≈0.145 r, n=30 (weak positive)
- Whoop MG vs. Eight Sleep: r≈−0.810 r, n=30 (strong negative)
Evaluation of the Best Tool to Measure Deep Sleep
- Oura: Weak correlations with Whoop MG and Eight Sleep, high variability (SD ≈ 34.66), and a plausible but low mean (63.90 min) suggest inconsistency. Outliers (e.g., 15 min) may indicate underestimation or sensitivity issues.
- Whoop MG: Strong negative correlation with Eight Sleep (-0.810) and high mean (131.83 min) suggest potential overestimation, as values often exceed typical deep sleep ranges (60–120 min). Moderate variability (SD ≈ 13.46) indicates reasonable consistency, but the negative correlation raises concerns about measurement alignment.
- Eight Sleep: Weak correlations with Oura but strong negative correlation with Whoop MG. Its mean (77.87 min) and range (55–107 min) align well with expected deep sleep durations, and the lowest variability (SD ≈ 10.03) suggests high consistency.
Best Tool: Eight Sleep is likely the best tool for measuring nightly deep sleep. Its measurements are within the expected range for adults, it has the lowest variability, and its consistency suggests reliability (30 nights, one person). Whoop MG’s high values and strong negative correlation with Eight Sleep suggest potential overestimation or methodological differences. Oura’s high variability and weak correlations indicate less reliability. Without a clinical standard, Eight Sleep’s alignment with expected deep sleep durations and stable measurements makes it the most trustworthy.
REM Sleep
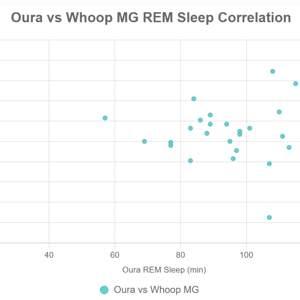
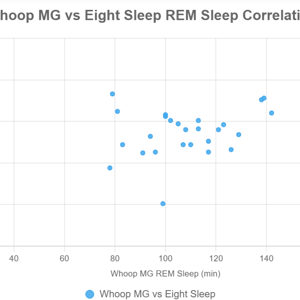
Correlation Summary:
- Oura vs. Whoop MG: r≈0.873, n=30 (strong positive)
- Oura vs. Eight Sleep: r≈−0.401, n=30 (moderate negative)
- Whoop MG vs. Eight Sleep: r≈−0.858, n=30 (strong negative)
Additional Metrics:
- Reasonableness: Typical REM sleep for adults is 90–120 min per night, about 20–25% of a 7–8 hour sleep cycle. Oura’s mean (98.57 min) aligns best with this range, Whoop MG’s (115.00 min) is slightly high but plausible, and Eight Sleep’s (136.20 min) is high with extreme outliers (6 and 217 min), suggesting potential inaccuracies.
- Consistency: Whoop MG has the lowest variability (SD ≈ 23.03), followed by Oura (25.87). Eight Sleep’s higher variability (28.46) and outliers (e.g., 6 min on 31/05/25, 217 min on 01/06/25) indicate less reliability.
- Whoop MG’s lower variability suggests more stable measurements, but Oura’s mean is closer to the expected REM sleep range, making it a strong candidate.
Best Tool: Oura is likely the best tool for measuring nightly REM sleep. Its mean (98.57 min) aligns closely with the typical REM sleep range (90–120 min), it has a strong positive correlation with Whoop MG (0.873), and its variability (SD ≈ 25.87) is reasonable. Whoop MG is a close second due to its lower variability and strong correlation with Oura, but its slightly higher mean (115.00 min) is less typical. Eight Sleep’s high mean, extreme outliers, and negative correlations with other tools suggest unreliable REM sleep measurement.
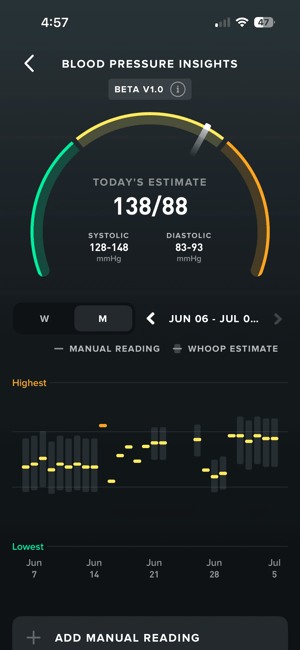
Whoop MG Blood Pressure Accuracy
Whoop estimates blood pressure once a day, usually overnight. It requires periodic, manual calibration against a legacy blood pressure monitor (c$30). For a calibration, I took three readings separated by a minute and did this whilst sitting on my bed before getting out. I performed a weekly calibration to test the accuracy, but you should recalibrate once a month.
When I performed the manual calibration, it seemed that Whoop was in the right ballpark but slightly overestimated by a few points. The daily trend over a month looks plausible, as I have high-normal blood pressure.
Whoop MG ECG Accuracy Test Results
I performed four ECG tests with Whoop, using both wrists. Whoop correctly did not detect an Afib event; it said I had a normal rhythm.
For proper testing, I would need a volunteer who could have an AFib event while I take the reading. hmmmm. Whoop only takes manual ECG readings and does not work passively in the background.
Whoop Readiness Test Accuracy
Sporting readiness is a non-unitary latent construct that reflects an athlete’s momentary capacity to train or perform, which is inferred through a composite of physiological, neuromuscular, psychological, and behavioral indicators.
Put more simply, the readiness indicators all vendors use have been invented. There is no accepted standard of an individual’s capacity to ‘train or perform’ – what is its unit of measurement?
Whoop 5.0 Whoop MG Accuracy
Once again, the tests show that you should not use a wrist-worn device if you want accurate HR data during sport.
When appropriately used, Whoop is an accurate device in the context of the accuracy levels that can be achieved by similar tools in similar scenarios. It’s a competent but unexceptional sensor – I can’t think of any exceptional wrist-based optical sensor. Whoop’s app is its point of difference and is market-leading. For context on how Whoop compares to Polar Loop, Amazfit Helio, Fitbit Air and the smart ring alternatives across the full recovery tracker and lifestyle band category, see our complete guide.
Quick fix: Wear Whoop on your biceps during sport. It really is that simple. If you regularly do strength training, follow a pre-defined workout on the app to get more accurate muscular strain. If you don’t have a Whoop and need accurate HR data, use a chest strap or an arm-worn monitor while playing sports.
Resources
Last Updated on 10 June 2026 by the5krunner
My favourite kit and nutrition
- Injinji – Runners protect your toes. Avoid discomfort and minor injury. Run more. run faster. I use them.
- Garmin 90-degree charging adapter — the small adapter that keeps your charging cables tidy. Essential for race day. I use one.
- Garmin charging puck — the fastest and most reliable way to top up your Garmin before a session. I use one.
- Ravemen FR300 — front light that mounts directly under your Garmin or Wahoo head unit. Keeps your bars clean and your beam pointed where it matters. I use one.
- Body Glide – The Blue anti-chafe stick that all swimmers and many runners use. I use it.
- Maurten — the race nutrition trusted by elite athletes. Gels and drink mix engineered to be easy on the stomach. I use them.
- Garmin Varia RTL515 — radar rear light that alerts you to vehicles approaching from behind. Pairs with your Edge or Garmin watch. I use this model.
- Favero Assioma Pro RS2 — the power meter pedals most serious cyclists end up choosing. Accurate, easy to move between bikes. I use this model.
Reader-Powered Content

This content is not sponsored. It’s mostly me behind the labour of love, which is this site, and I appreciate everyone who supports it.
Support the site: Follow (free, fewer ads) · Subscribe (paid, ad-free) · Buy Me A Coffee ❤️
All articles are written by real people, fact-checked, and verified for originality. See the Editorial Policy. FTC: Affiliate Disclosure — some links pay commission. As an Amazon Associate, I earn from qualifying purchases.

tfk is the founder and author of the5krunner, an independent endurance sports technology publication. With 20 years of hands-on testing of GPS watches and wearables, and competing in triathlons at an international age-group level, tfk provides in-depth expert analysis of fitness technology for serious athletes and endurance sport competitors. ID

I am not impressed with hrv on my whoop 4. It has to be wrong. The last few days have been anywhere from 170 to 347. Part of the problem is I have an irregular heart beat. However, ring conn, aw (through Bevel), and Garmin don’t jump around like this. Do you think Whoop 5 would be any better?
Great job. Very thorough report.
iI seem to partly recall earlier conversations ?
if you have an irregular heart beat then i just dont know which of the tools are going to be meaningful. even if the figures look right to you, they might not be.
I would guess that you need a tool that identifies teh irregular beat and then ignores that period for its hrv calculation. I can’t think of any that specifically do that. perhaps appel watch would be most likely
I know quite a bit about this topic. however you are asking questions that need precise, pseudo-scientific responses from one of the global experts like Altini @ hrv4training.
I know the bevel developer and marco altini and could ask them, maybe you could ping them first and i can chase if they dont get back to you
My heart rate has been straightened out in the last year so hrv with whoop is similar to what garmin ans helio show. Same for resting heart rate.
A question I have now is whether the accuracy of whoop on bicep is similar to coros arm band. Have you tried the coros band.
I also wonder if you think Whoop 5 metrics are any more accurate than whoop 4 ones. Review I have seen are on whoop 4.
hi
i’ve not used the coros band for quite some time and cant say how it would comapre to whoop on the biceps. likely both are ok.
not sure by what you mean the metrics being more accurate as they are the same algorithms. do yo mean the raw sensor readings? again, i haven’t copared whoop 4 to 5. sorry!