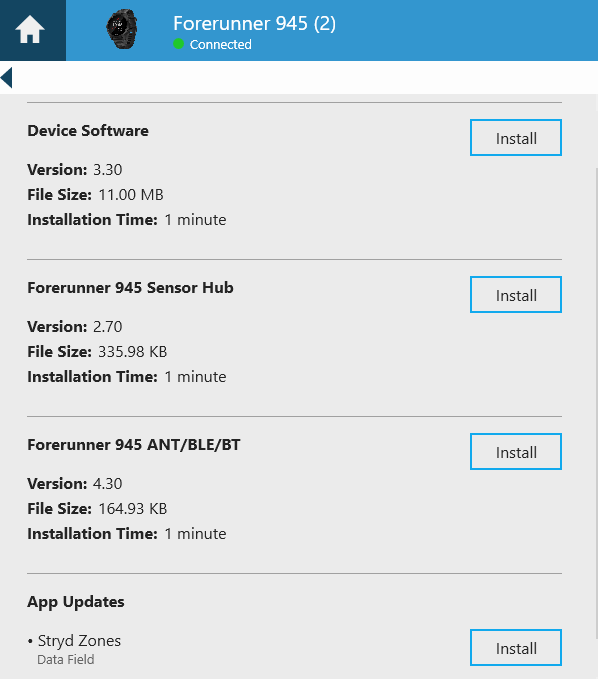
 This arrived today (image to right) and I’m not entirely sure what the updates are to my 945 sensor hub and BLE/BL/ANT+. I’m aware that the 945 doesn’t always find paired devices properly, maybe it fixes that?
It wasn’t broken on the 935 yet Garmin seems to have to repeatedly fix this for the 945. There could be an adage there somewhere if you look hard enough 😉
But I do know what the STRYD data field update is and it’s ‘quite nice’. Users of the STRYD ZONES data field will automatically get this update but if you are still using the original STRYD POWER data field then now is the time to update as the STRYD ZONES data field which contains lots of goodies released in previous versions as well as today’s update.
The new STRYD Zones data field seems better suited to display on a screen with only one data field if you want all the stated functionality. If, like me, you instead show it on a 4-metric screen then the coloured zone bar does not display. Although that MIGHT be different on the new, larger-screened Fenix 6 models (probably not).
Here’s what you get

- If you are targetting 301w over any given lap then you don’t know whether or not you need to speed up at any particular instant. To make that decision properly you need to know both your LAP power and your INSTANT power. The new STRYD ZONES gives you both those numbers in a single data field, which is handly as Garmin devices are quite limited about the number of data fields you can display…you now get two bits of data for the price of one! (OK it’s free, but you know what I mean)
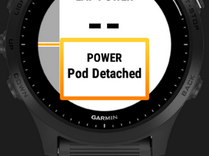
- Then you get a coloured, visual display of your zone, as shown above. That does NOT seem to show on my 945 in full-screen mode for some reason. When I show the data filed on a 4-data field per screen layout the display is the same as before the update and I am still shown the power zone and instant power. HELP! (I do have my zones setup and sync’d along with my auto-calculated CP)
- Interestingly if you leave the full screen/single data field display showing for long enough without starting a workout, it starts to show some bits of interesting info like your CP and when it was last updated.
- Finally, you get a ‘lost pod’ alert if your pod goes out of range. I’m assuming this is linked as well to the battery state to avoid an incorrect message? I’ve never lost a STRYD, however, I have on numerous occasions looked nervously down to see if it’s still there so this is a welcome feature for me. I’d imagine also that when you’ve lost it and it comes back in range the message on the Garmin would disappear? Maybe. The range of the STRYD POD seems to be over 5m in any case, so I’m not sure to what extent that would be useful.
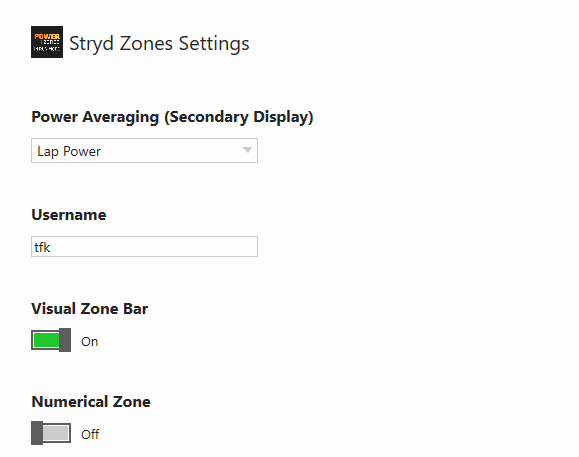
This shows the setting in Garmin Express to make the data field show the VISUAL ZONE BAR
Not bad for a single data field?
2025 STRYD Review, 10,000km Update – (Dual-) Running Power ⚡ Pod
Last Updated on 22 January 2026 by the5krunner
Reader-Powered Content

This content is not sponsored. It’s mostly me behind the labour of love, which is this site, and I appreciate everyone who supports it.
Support the site: Follow (free, fewer ads) · Subscribe (paid, ad-free) · Buy Me A Coffee ❤️
All articles are written by real people, fact-checked, and verified for originality. See the Editorial Policy. FTC: Affiliate Disclosure — some links pay commission. As an Amazon Associate, I earn from qualifying purchases.

tfk is the founder and author of the5krunner, an independent endurance sports technology publication. With 20 years of hands-on testing of GPS watches and wearables, and competing in triathlons at an international age-group level, tfk provides in-depth expert analysis of fitness technology for serious athletes and endurance sport competitors.

Not sure why Stryd does not just color the background (blue/yellow/red) for the power zones so you can use it in a multi data field display. Humon seems to be able to do it with its Hex ConnectIQ field. I need more than power displayed during my runs.
yup,
Have you used the FlowState “Run Power” datafield? (If you have a high-memory device) Have one of the fields be Power Zone, and have the zones color-coded and you’ll get a nice large square of the color on your display which can show 6 other datapoints.
By high-memory device that means Tier 4 (64kb datafield memory) or higher:
https://github.com/flowstatedev/ciq-runpower/wiki/Colors-for-Power,-HR-and-Cadence
That looks really interesting! Really well thought out CIQ field. Thanks!
is there a list of devices by tier ? and/or laetst by max version of ciq supported please?
https://github.com/flowstatedev/ciq-runpower/wiki/Data-Field-Layouts seems to have the details. This is one very flexible but complicated data field.
ty
I suggest NOT having the Run Power datafield log to the .fit file for you. He just recently got busy with other projects and has stopped supporting the datafield, and writing to .fit files was always a workaround. What I suggest doing is having Run Power as one of your ConnectIQ datafields and Stryd’s own Zones datafield as your other ConnectIQ datafield. You never need to look at Stryd’s datafield if you don’t want, but it will handle the logging of all the Stryd metrics to the .fit file for you in the background.
And you can see the Tiers are based on two things, ConnectIQ memory support and native power meter support. Talking to Flowstate he gave me this list of memory limits.
If you’re curious about the actual RAM available to Connect IQ data fields, it’s actually:
T5 (e.g. Fenix 5+, 5X) | 128 KB
T4 (e.g. 245 Music, 645 Music) | 64 KB
T3 (e.g. 735XT, Fenix 5, 5S, 935) | 32 KB
T2 (e.g. 245, 645, Vivoactive 3, Vivoactive 3 Music, 735XT, VAHR) | 32 KB
T1 (e.g. Fenix 3, 920XT) | 16 KB
Flowstate says in the forums that the Fenix 3 actually has SLIGHTLY less than the normal amount
T0 (e.g. 230, 235, 630, Vivoactive) | 16 KB
I have experienced hard crashes on a F3HR when using Run Power AND maps at the same time. Likely a memory overflow. I can also make the F3HR hard crash if the Stryd disconnects: Gus with Stryd said this is because the Stryd Zones data field gets “aggressive” with trying to restore dropped ANT+ connections and is probably locking the system. I have not experienced hard crashes with Run Power and the F5.
“Then you get a coloured, visual display of your zone, as shown above. That does NOT seem to show on my 945 in full-screen mode for some reason.”
Check your settings on your phone/computer app. Make sure setting “Visual Zone Bar” is on. I used the new datafield version today (with this enabled) and had no issues.