Garmin Real-Time Stamina
Quick answers
What is the difference between current stamina and potential stamina?
Current Stamina shows how much capacity remains at the exact level of effort being sustained right now — it drops sharply during hard surges above the lactate threshold and recovers partially when effort eases. Potential Stamina represents the broader ceiling of remaining capacity based on cumulative fatigue, glycogen depletion and muscle damage; it falls progressively throughout an activity and does not recover within a single session, meaning a very hard, long effort may leave Potential Stamina depleted for several days.
Why does my Garmin stamina drop to zero so fast?
The most common cause is an incorrectly set maximum heart rate — if it is too low, the model reads moderate efforts as near-maximal and depletes stamina far faster than physiology warrants. Insufficient activity history is the second most likely cause: the model needs several weeks of recorded runs or rides to personalise its fatigue resistance estimates, and early readings on a new device or after a profile reset should be treated as approximate until that history accumulates.
Why does Stamina start below 100%?
A Potential Stamina reading below 100% at the start of a session indicates the body has not fully recovered from prior training — the model carries stamina values between activities, so residual fatigue from recent hard sessions appears as a reduced starting value. This is the feature working as intended; if Potential Stamina consistently starts at 100% despite heavy training loads, the most likely explanation is that the activity history is too sparse for the model to detect accumulated fatigue.
Why did Stamina show 40% remaining at the end of an all-out 5K?
The model is calibrated for longer events where glycogen depletion and general fatigue accumulation are the primary performance limiters, so in a short maximal race the true binding constraint — the anaerobic ceiling — is not fully captured by the algorithm. Readings well above zero at the finish of a hard 5K or 10K are expected and do not indicate a fault; the feature is substantially more reliable as a pacing tool from half-marathon distance upward.
Garmin Real-Time Stamina — A Deep Dive
When Real-Time Stamina Is Actually Useful
- On Chase the Sun (200 miles, 2024), the rate of decline in potential stamina told me my rate of effort was unsustainable. I eased off. The metric still turned negative and I just managed to finish.
- When including VO2 max and threshold efforts as part of a longer workout, I’ve looked at the charts after the workout to see how low the current stamina went in the hard efforts. I’ve had several extremely hard workouts where each interval felt close to my maximum – sure enough, the current stamina number was very low for each rep and recovered.
- On several group rides, including Ride London (100 miles, 2023) I’ve been working in some fast groups, perhaps slightly above my ability level. The stamina figure goes some way to quantifying the hit you take trying to keep up with the group or taking your turn to lead. Avoiding too many of those moments helped me stay with the group and get an excellent time (sub 4:30).
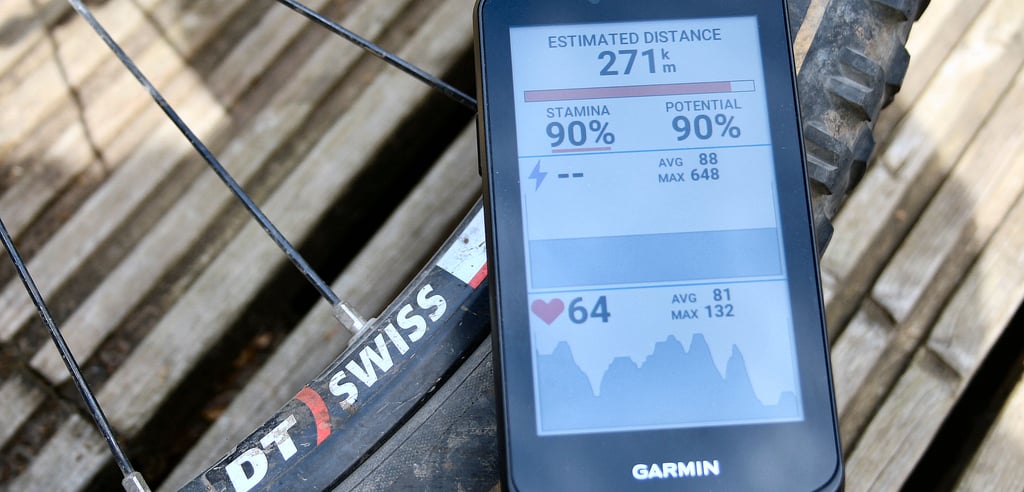
Garmin Real-Time Stamina tells a runner or cyclist how much energy they have left during an activity, displayed as a continuously updating percentage from start to finish. Real-Time Stamina — referred to within the Garmin ecosystem simply as Stamina — tracks two simultaneous metrics: Current Stamina, which reflects remaining capacity at the present level of effort accounting for both general fatigue and the temporary impairment of anaerobic work above the lactate threshold or functional threshold power (FTP); and Potential Stamina, which reflects the broader, longer-lasting fatigue from muscle cell damage, central nervous system fatigue, and carbohydrate depletion. Alongside these two percentages, the feature displays estimated time and distance remaining at the current effort, updated continuously.
The feature was introduced in January 2022 on the fēnix 7 series and Epix (Gen 2). The estimates depend on accurate threshold inputs — an incorrect maximum heart rate, an outdated lactate threshold estimate, or insufficient cycling power history will reduce reliability.
What the Number Actually Means
At a moderate pace below the lactate threshold, Current Stamina and Potential Stamina align and decline gradually together — performance is constrained only by general fatigue and resource depletion. Above the lactate threshold (FTP), Current Stamina drains faster than Potential Stamina; the gap between the two readings quantifies the temporary impairment of anaerobic exertion. When effort returns below threshold, Current Stamina recovers toward Potential Stamina as the residual anaerobic effects clear. Potential Stamina does not recover within a single activity. If it starts below 100%, residual fatigue from prior training has not fully cleared; activities that deplete it close to zero typically require several days of recovery before full capacity returns. There are no published age or sex reference ranges for these values.
How Garmin Calculates It
Real-Time Stamina is calculated by Garmin’s analytics engine using a multi-layered model. The minimum data requirement is an established VO2 max estimate and a live heart rate source; a power meter is recommended for cycling. The model draws on VO2 max, maximum heart rate, lactate threshold pace and heart rate (running), or FTP and heart rate (cycling) to define the threshold boundaries at which aerobic and anaerobic depletion rates change. Real-time heart rate, pace, or power is continuously compared against those thresholds to determine the rate at which Current Stamina drains or recovers at each moment.
Beyond the real-time physiological inputs, the model analyses recent and longer-term activity history — training durations, distances, load accumulations, and load distributions — to model individual fatigue resistance and aerobic and anaerobic tolerances. Running and cycling models are maintained separately; running history does not inform cycling stamina estimates and vice versa. For cycling, accuracy is influenced by power curve records for efforts under 10 minutes and by the duration of the longest recorded effort. Stamina levels carry over between activities, so an athlete who has not fully recovered will see both values start below 100%.
What Affects the Reading
Maximum heart rate accuracy is the most consequential hardware input — an incorrect value produces cascading errors in VO2 max, lactate threshold detection, and real-time intensity classification. Wrist-based heart rate introduces additional noise compared with a chest strap, particularly during hard intervals, when motion artefact can cause brief misreadings that the model interprets as momentary intensity changes. Heat-induced cardiovascular drift — the gradual rise in heart rate at a constant pace during prolonged exercise in warm conditions — can cause the model to read a steady effort as an increasing intensity, accelerating the apparent drain on stamina beyond what the metabolic load warrants.
Insufficient activity history degrades the personalisation layer. A recently changed device, a reset Garmin Connect profile, or a new sport will produce less accurate estimates until several weeks of relevant data have accumulated. Trail running, with its variable gradient and frequent surges, produces more volatile readings than road running at a consistent pace. Nutrition is not a direct model input, but an athlete who enters a long session underfuelled may see Potential Stamina deplete faster than the activity history implies, because the actual glycogen depletion rate exceeds the modelled baseline.
How Accurate Is It
No published peer-reviewed study has evaluated Garmin’s Real-Time Stamina algorithm directly against a physiological criterion measure, and no quantified error range is available from primary sources. Extended secondary testing by DC Rainmaker across the fēnix 7, Epix (Gen 2), Forerunner 955, and Edge 1040 found the feature consistently well-calibrated for cycling over sustained use. For running, community observations indicate the feature underestimates depletion in short maximal efforts — Potential Stamina readings of 30–40% remaining at the finish of an all-out 5K or 10K have been widely reported, suggesting the model is better calibrated for events where glycogen depletion and general fatigue are the primary limiters.
Trend reliability is more dependable than absolute accuracy. The directional behaviour — Potential Stamina falling progressively, Current Stamina recovering during easy efforts and dropping sharply during surges — tracks physiology consistently, even where the absolute percentages diverge from subjective effort. Accuracy degrades without a recently validated lactate threshold and when the maximum heart rate is incorrectly set.
Competitor Equivalents
- Polar: no equivalent; Running Index is a post-run VO2 max estimate calculated after the activity, not a real-time energy model.
- Apple Watch: no equivalent; workout displays show heart rate zones and effort rings, but no real-time remaining energy or fatigue projection.
- Coros: no equivalent; EvoLab provides post-activity training analysis and real-time running metrics such as running power and stride ratio, but does not model a depleting energy reserve during the activity.
- Suunto: ZoneSense (introduced September 2024) uses Detrended Fluctuation Analysis alpha-1 (DFA a1), applied to heart rate variability, to indicate the real-time aerobic or anaerobic state; it measures the current physiological position on the intensity spectrum rather than modelling a depleting reserve, and does not project time or distance to exhaustion.
- Wahoo: not applicable; Wahoo produces cycling computers only and does not manufacture running watches.
Which Garmin Devices Support It
Garmin introduced Real-Time Stamina in January 2022 on the fēnix 7 series and Epix (Gen 2), which launched simultaneously on 18 January 2022. The feature is available on all watches at or above the mid-high tier as of that generation: on the current generation, this covers the fēnix 8 series, Enduro 3, Forerunner 970, Forerunner 570, Epix Pro (Gen 2) series, MARQ (Gen 2) series, Tactix 7 and Tactix 8, and D2 Mach 1; on the prior generation, it covers the fēnix 7 and fēnix 7 Pro series, Enduro 2, and the Forerunner 955 and 965. For cycling, compatible Edge computers are the Edge 540, 540 Solar, 550, 840, 840 Solar, 850, 1040, 1040 Solar, and 1050. The feature is absent from entry-tier watches, including the Forerunner 55, Forerunner 165, Vívoactive 6, and Venu series.
Where to Find It
- Activity data screen (watch): hold UP/MENU > Settings > Activities and Apps > select run or cycling profile > Activity Settings > Data Screens > Add New > Stamina. Displays Current %, Potential %, current pace, and heart rate. Default primary value is Current %; change to Distance Remaining or Time Remaining via Edit Primary.
- Individual data fields (watch): Data Screens > select screen > Data Fields > select field > Stamina Fields. Available fields: Current, Potential, Distance Remaining (rounds to nearest half mile or km), Time Remaining (rounds to nearest 5 minutes), Stamina Gauge (Dist.), Stamina Gauge (Time).
- Activity data screen (Edge cycling computers): Menu > Activity Profiles > biking profile > Data Screens > Stamina > Show Screen > Show Current Effort > Show Distance or Show Time.
- Garmin Connect mobile: post-activity stamina trace visible as a chart in the activity detail. No Garmin Connect Plus subscription required.
- Garmin Connect web: stamina chart not available; mobile app only.
- Morning Report, watch face complication, widget glance: not available.
Common Problems and Misreadings
Stamina beginning a session at 100% despite perceived fatigue usually means prior sessions were not intense enough to register significant Potential Stamina depletion, or the training history is too sparse. A value below 100% at the start confirms the model has detected unrecovered fatigue; its absence in early use indicates insufficient history rather than full recovery. See FAQ above for details.
Readings above 30–40% at the finish of an all-out 5K or 10K are expected, not an error. The model is calibrated for general fatigue and glycogen depletion, which dominate in longer events. In a short maximal race, the binding constraint is the anaerobic ceiling, which the model does not fully capture. The distance and time remaining estimates become unreliable for pacing in shorter races. See FAQ above for details.
Current Stamina that spikes and recovers within seconds during intervals reflects wrist-based heart rate noise, as noted in What Affects the Reading. A paired chest strap stabilises the readings significantly. For cycling, stamina estimates that feel generic after a device change require two to three weeks of power meter data at varied intensities before the personalised power curve rebuilds.
How to Improve It
The underlying fitness determines how quickly Stamina depletes and how well it recovers. The primary lever is aerobic base development — sustained training at moderate intensity below the lactate threshold increases mitochondrial density, improves fat oxidation, and delays the point at which glycogen depletion becomes the limiting factor. Consistent aerobic volume produces measurable improvement in the rate at which Potential Stamina depletes during long efforts.
Raising the lactate threshold shifts the boundary above which Current Stamina diverges from Potential Stamina. Sustained efforts at and just below threshold pace are the most direct method. As the threshold rises, the athlete can sustain faster paces before the anaerobic system begins to dominate, and Current Stamina stays closer to Potential Stamina for longer at race pace.
Scientific Basis
Skiba, P.F., Chidnok, W., Vanhatalo, A., and Jones, A.M. (2012). “Modelling the Expenditure and Reconstitution of Work Capacity above Critical Power.” Medicine and Science in Sports and Exercise, 44(8), 1526–1532. Established the W’ balance model for tracking depletion and reconstitution of work capacity above critical power — the scientific precursor to the Current Stamina component of Garmin’s implementation.
Skiba, P.F., Jackman, S., Clarke, D.C., Vanhatalo, A., and Jones, A.M. (2013). “Effect of Work and Recovery Durations on W’ Reconstitution during Intermittent Exercise.” Medicine and Science in Sports and Exercise, 46(7), 1433–1440. Demonstrated that W’ reconstitution rate depends on the intensity of the sub-threshold recovery period, directly underpinning the behaviour where Current Stamina recovers toward Potential Stamina at a rate determined by how far effort drops below threshold.
Caen, K., Bourgois, G., Dauwe, C., et al. (2021). “W’ Recovery Kinetics following Exhaustion: A Two-Phase Exponential Process Influenced by Aerobic Fitness.” Medicine and Science in Sports and Exercise, 53(9), 1911–1921. Confirmed that W’ reconstitution follows a two-phase exponential process and that VO2 max is a significant determinant of reconstitution rate, consistent with Garmin’s use of VO2 max as a primary recovery modelling input.
How It Connects to Other Features
Real-Time Stamina depends directly on VO2 max and lactate threshold as its primary inputs, and on [LINK: running-power] for cycling when a power meter is present. High Training Load correlates with a reduced Potential Stamina starting value in subsequent sessions; athletes who also use Training Readiness will often find that a low morning readiness score predicts a depleted starting Stamina later that day. Performance Condition provides a complementary in-activity signal — where Stamina models a finite depleting reserve, Performance Condition measures aerobic output relative to the athlete’s baseline. Race Predictor and PacePro share the same VO2 max and threshold foundation, but do not account for residual fatigue; an athlete whose Potential Stamina starts well below 100% may find actual finishing pace falls short of those projections.
