I tracked my heart rate variability for 5 years. Then I changed one thing, or thought I did.
I’ve measured my heart rate variability every morning since around 2005, and more recently with HRV4training since April 2021. Nearly five years of data using a Polar H9 or H10 chest strap, and the HRV4Training app, first thing after waking. For most of that time, I’d lie down for 2 minutes to take the reading, mainly because I’m not a morning person. In February 2025, I switched to sitting for 1 minute.
That position change broke my dataset in half. Something changed, and HRV improved. However, the improvement coincided with other changes: I’d ramped up my strength training with HYROX-related activities, as I’m not getting any younger, and I added yoga in January 2025. This makes the 2025 data difficult to decisively interpret – I can’t cleanly separate the measurement method change from genuine physiological adaptation.
The four years preceding those changes tell a clearer story and add important context.
For context on how chest straps compare to optical sensors and where heart rate data fits into training, see the heart rate guide.
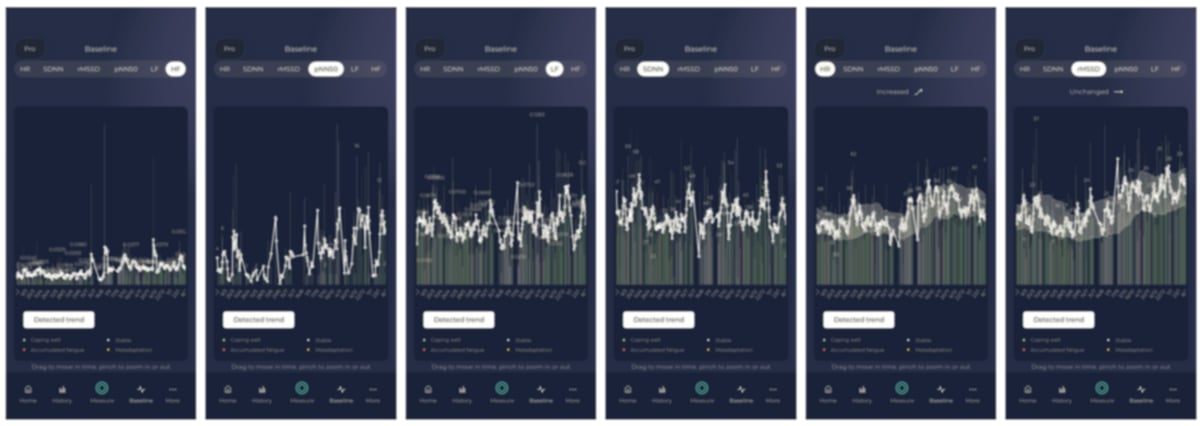
What HRV4Training’s Six Metrics Mean & Show
HRV4Training tracks six core metrics based on timing differences between heartbeats (RR or NN intervals). Here’s what each did from April 2021 through January 2025, before I changed anything:
- rMSSD (root mean square of successive differences): Primary HRV metric. Responds to training stress, sleep, and illness. Statistical analysis shows a very small downward trend – roughly 0.3ms per year – but daily variability (coefficient of variation ~25-29%) completely swamps this drift. Practically speaking, it oscillated around the same baseline for four years.
- HR: Resting heart rate provides context. Small upward trend of roughly 0.1 beats per minute per year. Bounced within a narrow range across all years.
- SDNN (standard deviation of NN intervals): Total variability, better for 24-hour recordings. No statistically significant trend. The tightest of all metrics – barely moved across the entire period. This is the one Apple uses.
- pNN50 (percentage of successive intervals differing by >50ms): Another measure of beat-to-beat variation. No statistically significant long-term trend. Mean values jumped in 2022, then declined back through 2023-2024.
- LF (low frequency power, 0.04-0.15 Hz): Mix of stress (sympathetic) and relaxation (parasympathetic) signals, difficult to interpret alone. No trend detected.
- HF (high frequency power, 0.15-0.4 Hz): Linked to breathing rhythm. No movement whatsoever for five straight years.
The pattern across all six showed minimal directional change. Nearly five years of high-volume endurance training – 10-15 hours per week of running, cycling, and swimming – and my HRV metrics showed only trivial statistical trends. The slope changes were detectable mathematically but practically irrelevant relative to normal day-to-day variation. But…
What Near-Stability Actually Means
My data and charts show I’m neither overtrained (declining HRV) nor undertrained (rising HRV) over the longer term. Even in the short term, my HRV drops after hard sessions but recovers quickly.
I exercise 10-15 hours per week. It’s periodised when goal-focused, with peaks reaching 500+ TSS, and recovery weeks dropping to 100 TSS. thus probably ruling out monotony as a factor.
Near-flat HRV over five years suggests equilibrium. Is that good?
The 2025 Confound – Two Things Change Together
In late 2024, I added a weekly, hard yoga session and then an additional strength training or HYROX-style work in early 2025 with the goal of increasing flexibility and mass – the latter to counter age-related muscle loss and to keep the performances up.
One month later, in February 2025, I changed my waking HRV measurement protocol from lying down for 2 minutes to sitting for 1 minute, allowing approximately 30 seconds for my heart rate to stabilise.
This creates a problem: Other than not remembering exact dates, I can’t separate the measurement artefact from the genuine physiological response to the new training stimulus.
What Changed Immediately (Position Effect)
When I switched positions in February 2025, the breathing-related metrics changed as follows, with the other metrics barely moving, except for a 10% increase in pNN50.
- HR +3.7%: Sitting makes your heart work harder as it fights gravity.
- HF +33%: HF tracks how much your heart rate changes with each breath. Sitting alters your breathing pattern because a different posture gives your diaphragm more room to move.
- LF -11%: When lying flat, your body adjusts blood flow in slow cycles. A different position gives a different regulation pattern.
- The weird bit: Usually, when you sit up, HF drops, and LF rises (your nervous system kicks in). Mine did the opposite, perhaps because the breathing changes swamped everything else.
- rMSSD: +2.8% (not breathing related)
- SDNN: -1.3% (not breathing related)
- pNN50: +9.6% (not breathing related)
What Continued to Change (Adaptation Effect)
If position change were the only factor, metrics should stabilise within weeks. They didn’t.
Here’s the post-position data by ‘month’:
rMSSD:
- Days 0-28: baseline
- Days 29-56: +11.0%
- Days 57+: +12.1%
HR:
- Days 0-28: baseline
- Days 29-56: -0.5%
- Days 57+: +2.4%
Both show sustained upward drift (p < 0.0001), not stabilisation.
The most likely explanation is an adaptation to the strength training. Bodies don’t adapt overnight – neuromuscular efficiency, movement patterns, and recovery capacity improve over extended periods. Research shows that strength training can improve HRV in endurance-only athletes by improving autonomic balance. Despite a good cardiovascular system, my baseline strength was relatively low, leaving room for adaptation.
But I can’t prove this. The position change and the training change occurred within weeks of each other.
Why Waking+Sitting HRV Readings Make Sense for Athletes
Most guidance says lie down or use overnight averages – the “purest” measure without gravity affecting your heart.
But for athletes, that purity might miss the point.
When you’re very fit and lying completely still, your body reaches maximum relaxation. This creates a problem if you’re already at maximum relaxation, as HRV cannot decrease further to signal training stress. Studies show that overtrained athletes showed HRV changes when sitting or standing, but not when lying down.
So, sitting makes your heart work against gravity. This mild challenge reveals whether your body is handling stress well – better for detecting training readiness than measuring general health.
Duration and Breathing Protocol Matter
I didn’t just change position – I also changed duration. Two minutes to one minute. This also matters.
Shorter recordings increase noise, particularly for frequency metrics like HF and LF. A 60-second window captures fewer breathing cycles and fewer low-frequency oscillations.
My measurement variability increased post-change:
- HR variability: +33%
- HF variability: +50%
Some comes from position, some likely from shorter duration. another pesky confoundment.
Unpaced breathing: I’ve never used paced breathing during measurements. Marco Altini and others argue against it for baseline morning measurements. Paced breathing artificially inflates HRV; it’s useful for biofeedback training, not for tracking baseline stress. Spontaneous breathing reflects your actual state.
My protocol follows this principle, but because breathing rate wasn’t controlled and likely varied between lying and sitting, another uncontrolled variable was introduced.
Practical Takeaways
There is one key takeaway for me
and several smaller ones.
- Near-stability indicates sustainable training. HRV remaining approximately flat year over year, while training is consistently high, suggests sustainable volume.
- Position depends on the goal. For athletes monitoring exercise readiness, sitting makes more sense based on research. For general health monitoring, lying works fine.
- Duration affects quality. Shorter recordings increase noise, especially in frequency metrics, but are more convenient.
- Trends require statistics. Small, significant trends might not be obvious if day-to-day variation swamps them.
- rMSSD and HR tell most of the story. Others add nuance but rarely change interpretation.
- Equipment variation matters. Multiple “equivalent” devices over the years may introduce discontinuities. Keep a record.
The Lesson
Changes to my 2025 training and HRV tell a complex story. Multiple plotlines (strength training and position change) and a new character arc (duration change) are mixed and difficult to interpret because I changed too many elements at once. Clean data requires disciplined protocols.
One thing is certain: like you, I’ve got a bit older over the last five years. Probably by a similar amount to you, in fact. 😉
As an older athlete, I’ve reached the point where consistency matters. Perhaps even ‘slowing the decline’ would be a more appropriate phrase. Perhaps I’ve started winning races because, where others have given up or been injured, I’ve found a good, enjoyable and sustainable level at least for now.
Maybe (definitely) I could have tried harder and optimised more.
This article is part of the site’s sports science reference for endurance athletes.
Last Updated on 3 June 2026 by the5krunner
My favourite kit and nutrition
- Injinji – Runners protect your toes. Avoid discomfort and minor injury. Run more. run faster. I use them.
- Garmin 90-degree charging adapter — the small adapter that keeps your charging cables tidy. Essential for race day. I use one.
- Garmin charging puck — the fastest and most reliable way to top up your Garmin before a session. I use one.
- Ravemen FR300 — front light that mounts directly under your Garmin or Wahoo head unit. Keeps your bars clean and your beam pointed where it matters. I use one.
- Body Glide – The Blue anti-chafe stick that all swimmers and many runners use. I use it.
- Maurten — the race nutrition trusted by elite athletes. Gels and drink mix engineered to be easy on the stomach. I use them.
- Garmin Varia RTL515 — radar rear light that alerts you to vehicles approaching from behind. Pairs with your Edge or Garmin watch. I use this model.
- Favero Assioma Pro RS2 — the power meter pedals most serious cyclists end up choosing. Accurate, easy to move between bikes. I use this model.
Reader-Powered Content

This content is not sponsored. It’s mostly me behind the labour of love, which is this site, and I appreciate everyone who supports it.
Support the site: Follow (free, fewer ads) · Subscribe (paid, ad-free) · Buy Me A Coffee ❤️
All articles are written by real people, fact-checked, and verified for originality. See the Editorial Policy. FTC: Affiliate Disclosure — some links pay commission. As an Amazon Associate, I earn from qualifying purchases.

tfk is the founder and author of the5krunner, an independent endurance sports technology publication. With 20 years of hands-on testing of GPS watches and wearables, and competing in triathlons at an international age-group level, tfk provides in-depth expert analysis of fitness technology for serious athletes and endurance sport competitors. ID

Very useful to track CV and the Baevsky Stress Index. In my view, these are the two most underrated HRV metrics. I usually monitor them through Wellhero, it helps me understand training readiness.
BSI: https://forum.intervals.icu/t/baevsky-stress-index/7457
First of all, huge compliments to you. I have been following your work for many years and appreciate the quality and depth of your guides and reviews.
I have also been monitoring and measuring my HRV for several years now, and the Garmin HRV status is perfectly adequate for my needs. I consider HRV to be one of the most important and meaningful metrics that health-conscious and enthusiastic amateur athletes should keep a constant eye on.
I have one question: you mention that you are one of the older athletes. How old are you (I am 53 🙂) and how do you manage 10-15 hours of training per week? Could you perhaps give us an insight into your weekly training routine?
Best regards from beautiful Vienna,
Andreas
i do 2-3 hard sessions a week and one long session at the weekend as a minimum
monday tends to be very easy or complete rest.
i try to do 1x yoga and 2x strength a week.
i try to do one long workout a week
when focussed on race training it woudl depend what the race was eg im training for a duathlon now and then majorca 312 afterwards, so speedier stuff for now giving way to lots of long cycling.
Have you tried Kubios? I moved over after seeing Andrew Flatt using it. I find pns and sns excellent from it along with Garmin overnight and Gemini 3pro for interpretation
its meant to be good but ive not used it in earnest
About the sitting position for athletes, I think it really depends on the definition of “athletes.”
For example, in his podcast with Peter Attia (1:10:58), Joel Jamieson only recommends measuring in a seated position for people with very high HRV and/or very low RHR:
https://youtu.be/3TClfAvj2-Q?si=avx0r1VqQJdrHRNe&t=4258
// transcript //
People with really high HRVs
This doesn’t become an issue in Morpheus until you’re in the 90s or resting heart rates in the low to mid-40s
Your HRV is already very, very high that laying down, you’re taking some responsiveness away
Joel’s advice if you’re in those categories: you probably want to take your HRV measurement seated
The challenge for most people seated is they get antsy, they move around, you introduce more motion artifacts and it becomes more difficult
We really want to have as much range of that dial available as possible because we want to see how the nervous system is turning that dial
Peter’s HRV is never above the low 80s
For him, Joel thinks laying down is still a good way to take that HRV measurement
If your HRV gets up in the 90s (or higher), you want to maximize potential responsiveness and that’s where a seated measurement makes more sense (that’s a small % of the population)