Stryd 5 vs Stryd 4 Accuracy Test: Quantifying the Differences
I’ve been using Stryd 5.0 for a few weeks now. I like the new, smaller design and dual-sided charging pod. However, the reported data does feel different, so I decided to go ahead and do some science, having devised what I thought was a rigorous test to validate the claims, or at least some of the more important ones.
Let’s take a step back to figure out what claims I can validate.
What’s Changed? What are the claims?
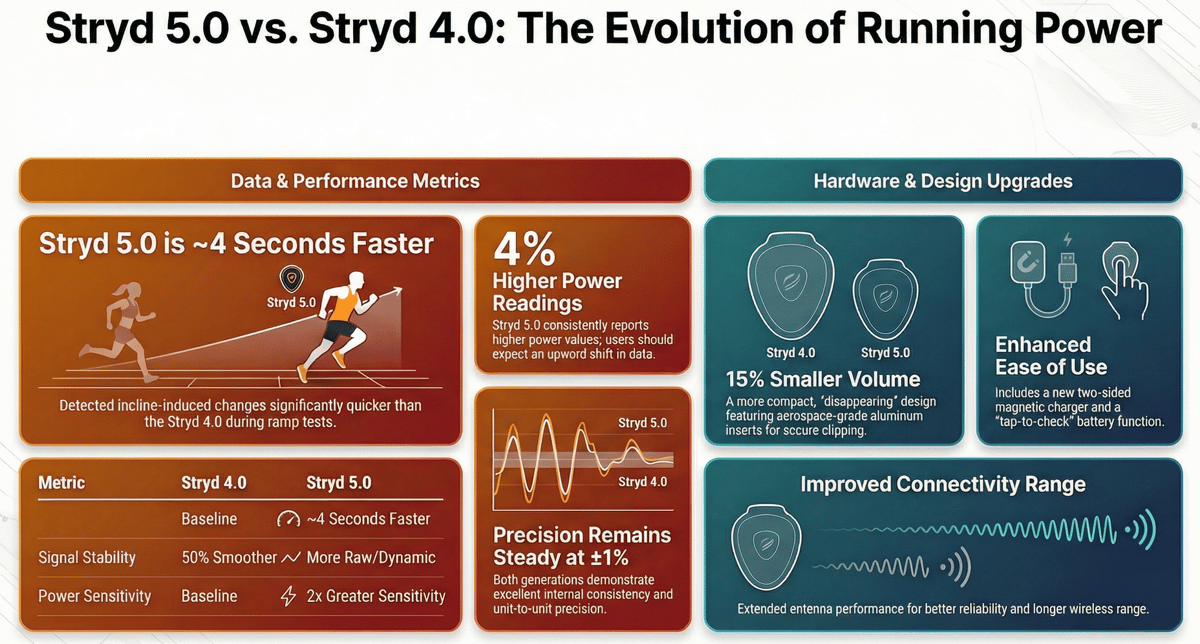
Here’s a recap of what has changed from Stryd 4.0 to 5.0.
All the changes are listed. I highlighted the data-related changes in bold and underlined those I thought I could validate.
| Feature | Updates (Stryd) |
|---|---|
| Accuracy | More accurate & consistent power, pace and distance, across conditions (New) |
| Responsiveness | Faster power responsiveness on varying terrain, climbs and descents (New) |
| Size | 15% smaller by volume pod design, so it disappears on every size shoe (New) |
| Hardware | All new sensors & processing for the smartest pod with the same long battery life (New) |
| Ease of Use | Simple operation with tap battery check & two-sided magnetic keychain charger (New) |
| Connectivity | Extended antenna performance for improved reliability & longer range (New) |
| Design | New grey aerospace-grade aluminium inserts for secure clipping to any shoe (New) |
| Style | Blue and grey clips are optionally available to style your Stryd to every shoe (New) |
Test 1 – 12 hill reps plus 9km over varied terrain
I mistakenly began with a hill test on a compacted trail, later realising that methodological issues may have affected the results. It’s a 2-minute hill in Richmond Park. I could reliably hold a steady 300 W for each effort, aiming to keep the power approximately constant despite the uneven changes in gradient. It began with a gentle gradient, then flattened, and finally steepened markedly at the end.
At my disposal were 2 Stryd 5.0 pods (Model 30) and 2 Stryd 4.0 Pods (Models 26, 27; Model 27 is assumed to be from a later production batch but otherwise identical). I chose to compare the Model 30 to the Model 27. I have a small amount of gait asymmetry, so I switched the pods after each repetition. I recorded the Stryd 5 with a Garmin Forerunner 970 and the Stryd 4.0 with a Suunto Race.
I planned to let the Garmin record the elevation gain second by second from the same starting point. Overall, I could determine the average gradient profile across all 12 runs and examine how power responded to that profile across the tests.
The hill was approximately a 9 km round trip from my home, so I also conducted additional tests on various surface types (wet, soft grass, and variously compacted trails) along the route to and from the hill. In hindsight, I’m not entirely sure what I was trying to prove in these sections! Other than the variance in the raw, uncalibrated distance between the pods.
Anyway, here’s the data. After the test, I encountered several unforeseen issues, including watches with subtly different timestamps, potential delays in recording to the FIT file, and similar factors, as I used two different watch models that might have affected the results. e.g., I could simply align the data by the time the power started, but if there were even a small timestamp difference, I could be correcting a real difference in response time between pods.
Master Verification Table
| Test | G_Lap | Start | Dur(s) | S4_Foot | Surface | Grad | S4_Pwr | S5_Pwr | Δ_Pwr | S4_Dist | S5_Dist | Δ_Dist | S4_Elev | S5_Elev |
|---|---|---|---|---|---|---|---|---|---|---|---|---|---|---|
| 1 | 2 | 14:20:07 | 80 | L | grass | flat | 270.4 | 280.7 | +10.3 | 273.0 | 285.4 | +12.4 | +0.6 | +0.4 |
| 2 | 4 | 14:22:42 | 267 | L | pavement | flat | 273.8 | 280.8 | +7.0 | 925.0 | 965.6 | +40.6 | +1.4 | +1.4 |
| 3 | 6 | 14:28:44 | 290 | L | trail | up | 274.5 | 283.7 | +9.2 | 961.0 | 1000.5 | +39.5 | +11.8 | +11.6 |
| 4 | 8 | 14:40:17 | 126 | L | hill | up | 295.0 | 302.4 | +7.4 | 358.0 | 370.9 | +12.9 | +23.4 | +24.0 |
| 5 | 10 | 14:46:37 | 123 | R | hill | up | 301.8 | 297.2 | -4.6 | 361.0 | 369.4 | +8.4 | +23.2 | +24.2 |
| 6 | 12 | 14:52:24 | 129 | L | hill | up | 285.1 | 292.2 | +7.1 | 357.0 | 369.2 | +12.2 | +22.6 | +24.2 |
| 7 | 14 | 14:58:28 | 125 | R | hill | up | 292.4 | 293.0 | +0.6 | 361.0 | 370.3 | +9.3 | +22.8 | +23.4 |
| 8 | 16 | 15:04:16 | 125 | L | hill | up | 292.7 | 300.1 | +7.4 | 352.0 | 367.1 | +15.1 | +22.8 | +24.0 |
| 9 | 18 | 15:09:41 | 124 | R | hill | up | 294.9 | 292.5 | -2.4 | 359.0 | 368.6 | +9.6 | +23.0 | +23.8 |
| 10 | 20 | 15:15:30 | 124 | L | hill | up | 289.6 | 296.3 | +6.7 | 352.0 | 365.8 | +13.8 | +22.2 | +23.4 |
| 11 | 22 | 15:21:11 | 123 | R | hill | up | 295.0 | 294.1 | -0.8 | 359.0 | 366.1 | +7.1 | +23.2 | +23.8 |
| 12 | 24 | 15:26:37 | 122 | L | hill | up | 299.2 | 309.2 | +10.0 | 356.0 | 369.4 | +13.4 | +23.0 | +24.0 |
| 13 | 26 | 15:31:53 | 120 | R | hill | up | 299.2 | 299.5 | +0.3 | 360.0 | 367.0 | +7.0 | +22.8 | +24.0 |
| 14 | 28 | 15:40:57 | 120 | L | hill | up | 302.3 | 316.9 | +14.6 | 356.0 | 368.3 | +12.3 | +23.2 | +24.2 |
| 15 | 30 | 15:46:29 | 120 | R | hill | up | 307.8 | 302.0 | -5.8 | 362.0 | 371.0 | +9.0 | +23.2 | +23.6 |
| 16 | 32 | 15:54:43 | 285 | R | trail | down | 254.6 | 259.3 | +4.7 | 977.0 | 993.1 | +16.1 | -10.8 | -10.8 |
| 17 | 34 | 16:01:28 | 261 | R | pavement | flat | 276.1 | 281.1 | +5.0 | 955.0 | 961.8 | +6.8 | -0.2 | -0.6 |
| 18 | 36 | 16:07:12 | 81 | R | grass | flat | 265.8 | 277.1 | +11.3 | 289.0 | 295.6 | +6.6 | -0.6 | -1.0 |
Validation Checks
- ✓ 18 tests extracted
- ✓ Tests 4-15 durations: 120s – 129s (expected 120-130s)
- ✓ Hill elevation gains: 23.4m – 24.2m (very consistent)
- ✓ Power range: 255W – 317W
- ✓ Foot alternation pattern correct (L-R-L-R…)
Hill Profile (from Garmin GPS)
- Distance: ~380m
- Elevation gain: ~24m
- Average gradient: ~6.3%
- Profile: Starts gently (3-5%), steepens mid-hill (8-10%), eases at the top
Preliminary Findings (Controlling for Gait Asymmetry)
| Metric | Stryd 4 | Stryd 5 | Difference |
|---|---|---|---|
| Power | 296.2W | 299.6W | +3.4W (+1.14%)* |
| Distance (Uncalibrated, Raw) | 357.7m | 368.6m | +10.8m (+3.03%) |
| Time to 90% peak power** | 9.7s | 7.8s | S5 ~2s faster |
* Smaller difference than subsequent test may reflect methodological limitations (different watches, timestamps, and use of only one pod per generation rather than two)
** time from start of effort to reaching 90% of average power for that rep
Test 2 – Validating 4 pods with each other, and as pairs
Back to the drawing board. Were same-generation pods different? Were the recording methods equivalent?
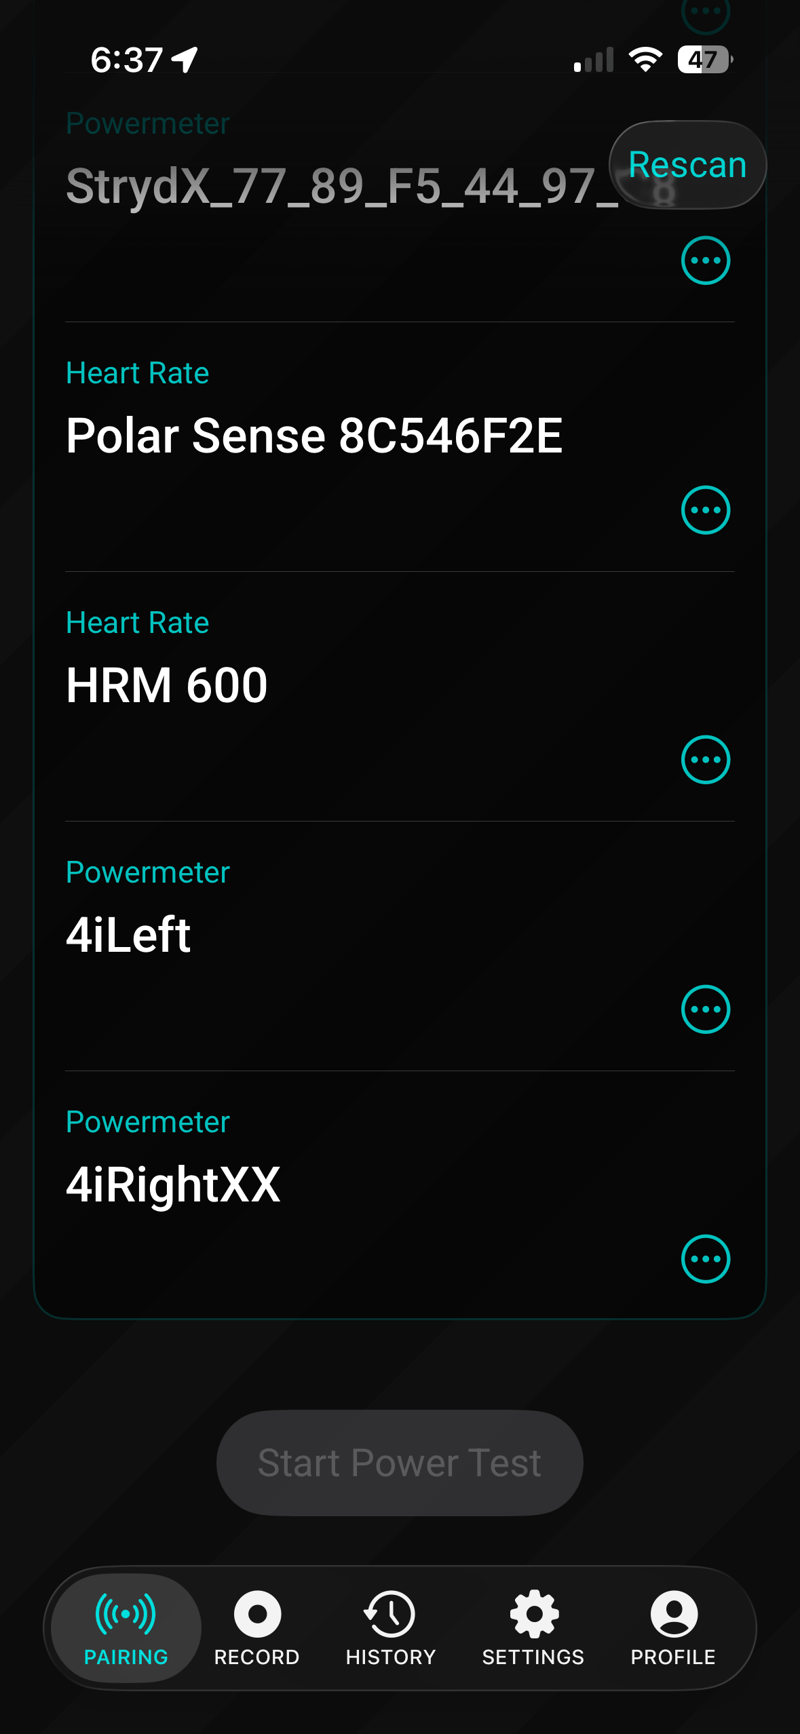
I decided to validate all 4 pods against one another in a controlled environment, thereby revealing unit-level variation within and between generations. I decided to obtain the raw data directly from the pod (via the Stryd app) rather than from four watches. This is possible but not straightforward, requiring four smartphones and a test Stryd account for each. Luckily, I remembered to calibrate them identically, which essentially means assigning the same runner weight and height in each app. The watch calibration factor is for distance, not power.
To cut to the chase, I couldn’t do it, and I’m not the sort of person who gives up easily, but you can only spend so much time with these things.
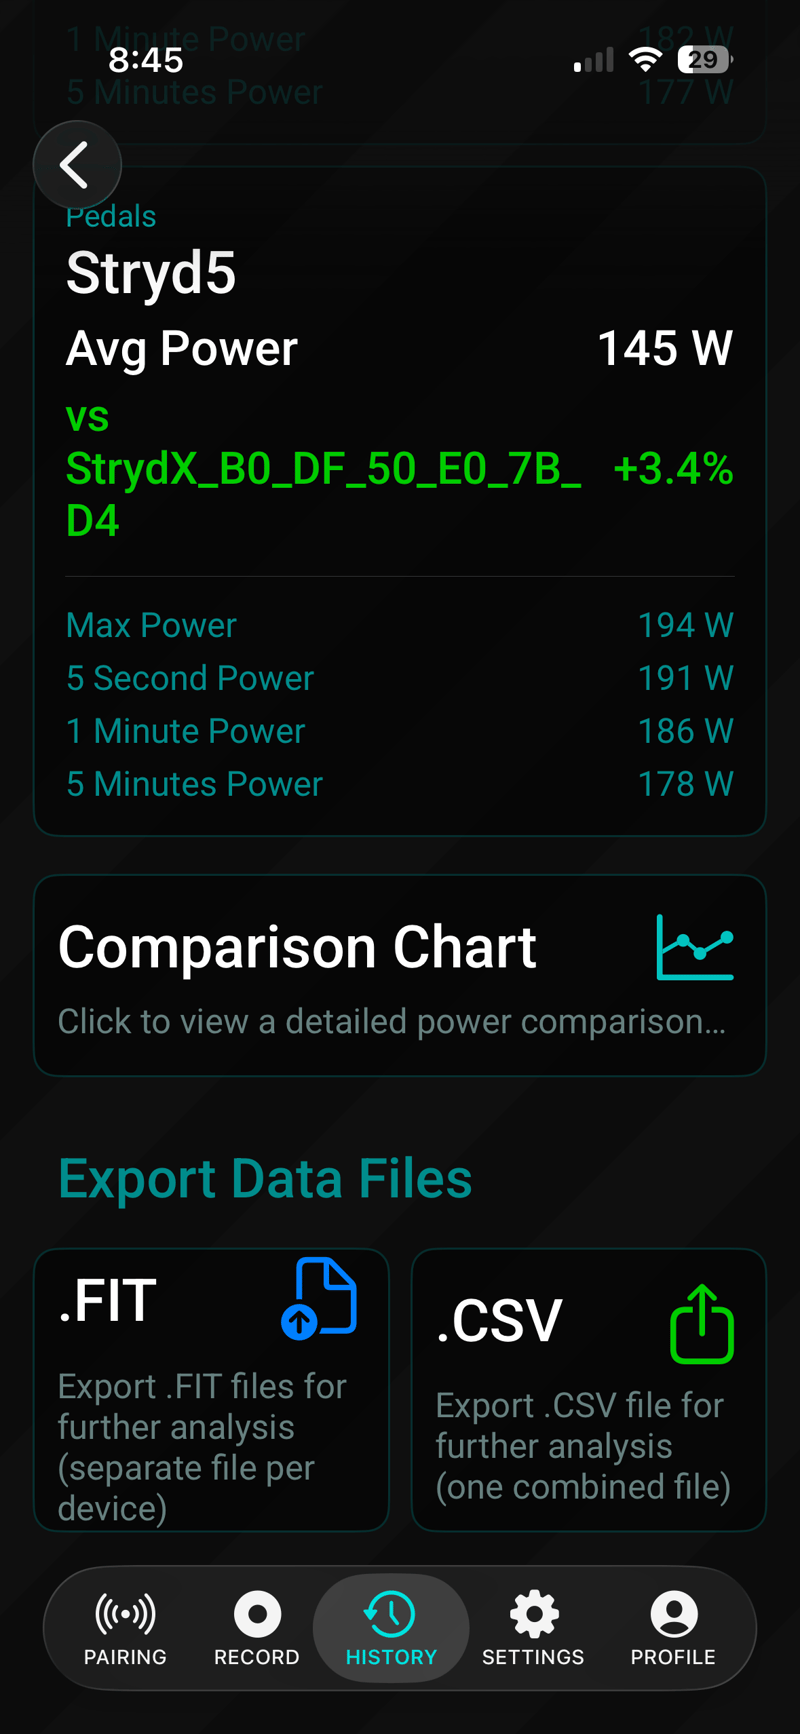
By one of the most fortuitous flukes ever, my bike fitter, who lives nearby (the best in SW London, BTW), was just so happening to be writing an app to help riders quickly understand the differences between their normal road power meter and their winter indoor trainer. Inevitably, many people must just forget about differences that are often far greater than I might notice when I do bike power meter tests (proper calibration, drive chain loss minimisation, cog choice, gear choice). I persuaded him to increase the number of power meters his app could record from 3 to 4, and I was sorted. He could let me export the data as 4 FIT files to use in Dcrainmaker’s Analyzer for easy visualisation, but, more importantly, they all shared the same time stamps when exported as a single CSV file. With the CSV file, I could then simply have an AI statbot analyse it.
To beta test the Freespeed app, contact Richard.
Q: How can you validate accuracy when there is no gold standard?
A: You can’t. But you can assess precision.
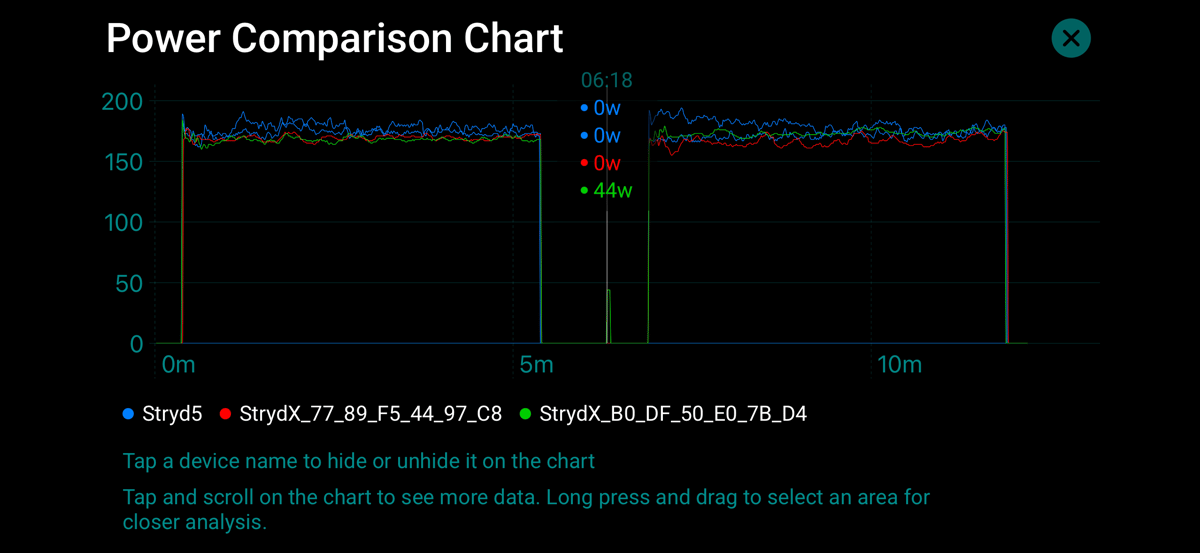
Method: Four pods (2× Stryd5, 2× Stryd4) were worn simultaneously during two 5-minute treadmill runs at a constant speed, with jumps on and off to simulate near-instant changes in power. Pods were swapped between feet between tests to isolate calibration differences from gait asymmetry.
Findings:
| Metric | Result |
|---|---|
| Pod-to-pod spread | 5.3% (9W) across all units |
| Generational offset | Stryd5 reads ~4% higher than Stryd4 |
| Within-generation precision | ±1% (both generations) |
| Response time | 0-1 second, no difference between generations |
| Signal stability | Stryd4 ~50% less second-to-second variation than Stryd5 |
| Gait asymmetry detected | -1.6% (left foot stronger) |
Conclusion: Both generations perform well with equivalent responsiveness to start/stop transitions. Within-generation precision is tight (±1%), but there is a systematic ~4% offset between generations (Stryd5 is higher). Stryd4 produces a smoother signal, though it is unclear whether this reflects greater stability or more aggressive smoothing.
Test 3 – Validating how 4 Pods respond to a constantly rising treadmill incline
Method: Four pods (2× Stryd5, 2× Stryd4) were worn simultaneously during six 60-second treadmill intervals at a constant belt speed. Each interval: 20 seconds of stabilisation at flat, then an incline ramped to maximum (approx 15°) over 40-45 seconds. Pods were swapped between feet after interval 3 to control for foot placement effects.
Responsiveness to Incline Change (Treadmill Ramp Test)
| Metric | Stryd5 | Stryd4 | Difference |
|---|---|---|---|
| Response onset (secs after incline trigger) | 6.2s (±2.6s) | 9.9s (±2.0s) | Stryd5 4s faster |
| Power rise magnitude | +46.3W (±30.1W) | +22.7W (±12.0W) | Stryd5 2x greater |
Note that the Baseline (flat) power is precise (±1% relative to Test 2); however, the incline power values cannot be validated because Stryd requires treadmill incline calibration. These power levels will differ from outdoor power (which incorporates barometric pressure and wind inputs), but this test concerns only responsiveness.
Conclusion: Stryd5 detected incline-induced biomechanical changes approximately 4 seconds faster than Stryd4, supporting Stryd’s claim of improved responsiveness. Stryd5 also reported approximately twice the power increase for the same gradient change, indicating greater sensitivity. However, absolute power values during incline cannot be validated without a reference standard, and outdoor performance may differ due to the absence of barometric pressure input on a treadmill.
Testing Issues
For clarity and completeness, here are some of the issues with my testing. Happy to add to it if you point out errors in the comments
- My Pod 4 were not bought as a pair. They have different model numbers.
- I used the same pair of shoes for all tests
- There was no wind in the outdoor test
- Pod positions AND cradles were potentially moved laterally as pods swapped feet. They were always through the same laces.
- Pricise Pod position on laces varied.
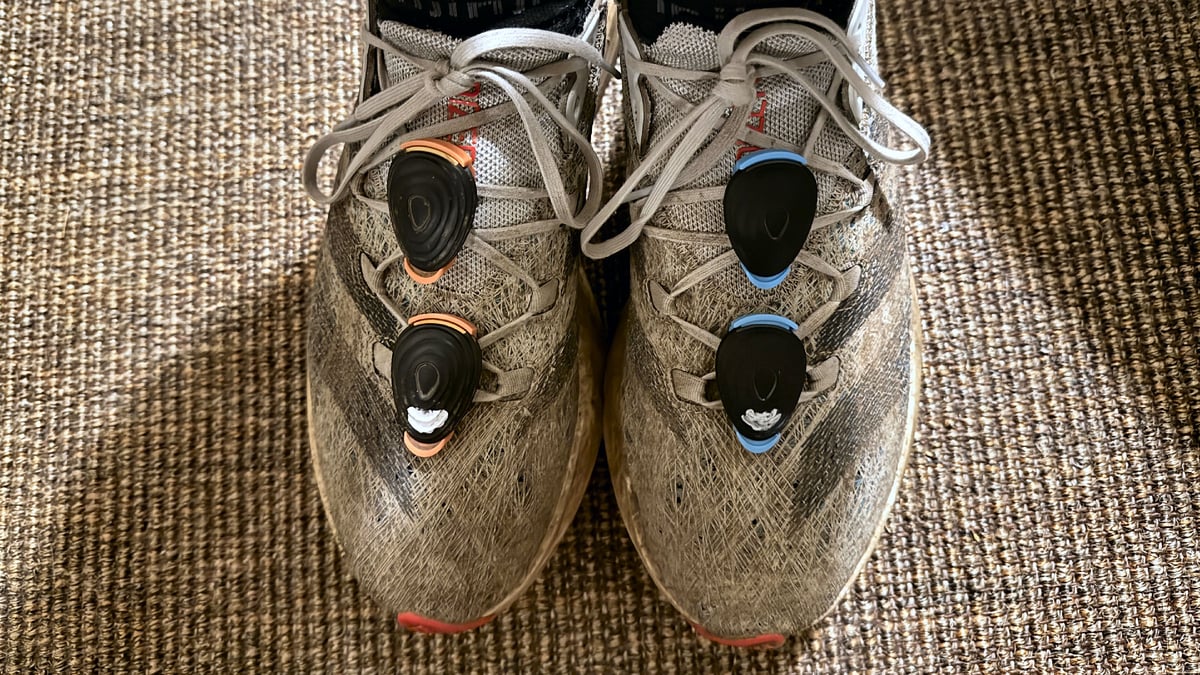
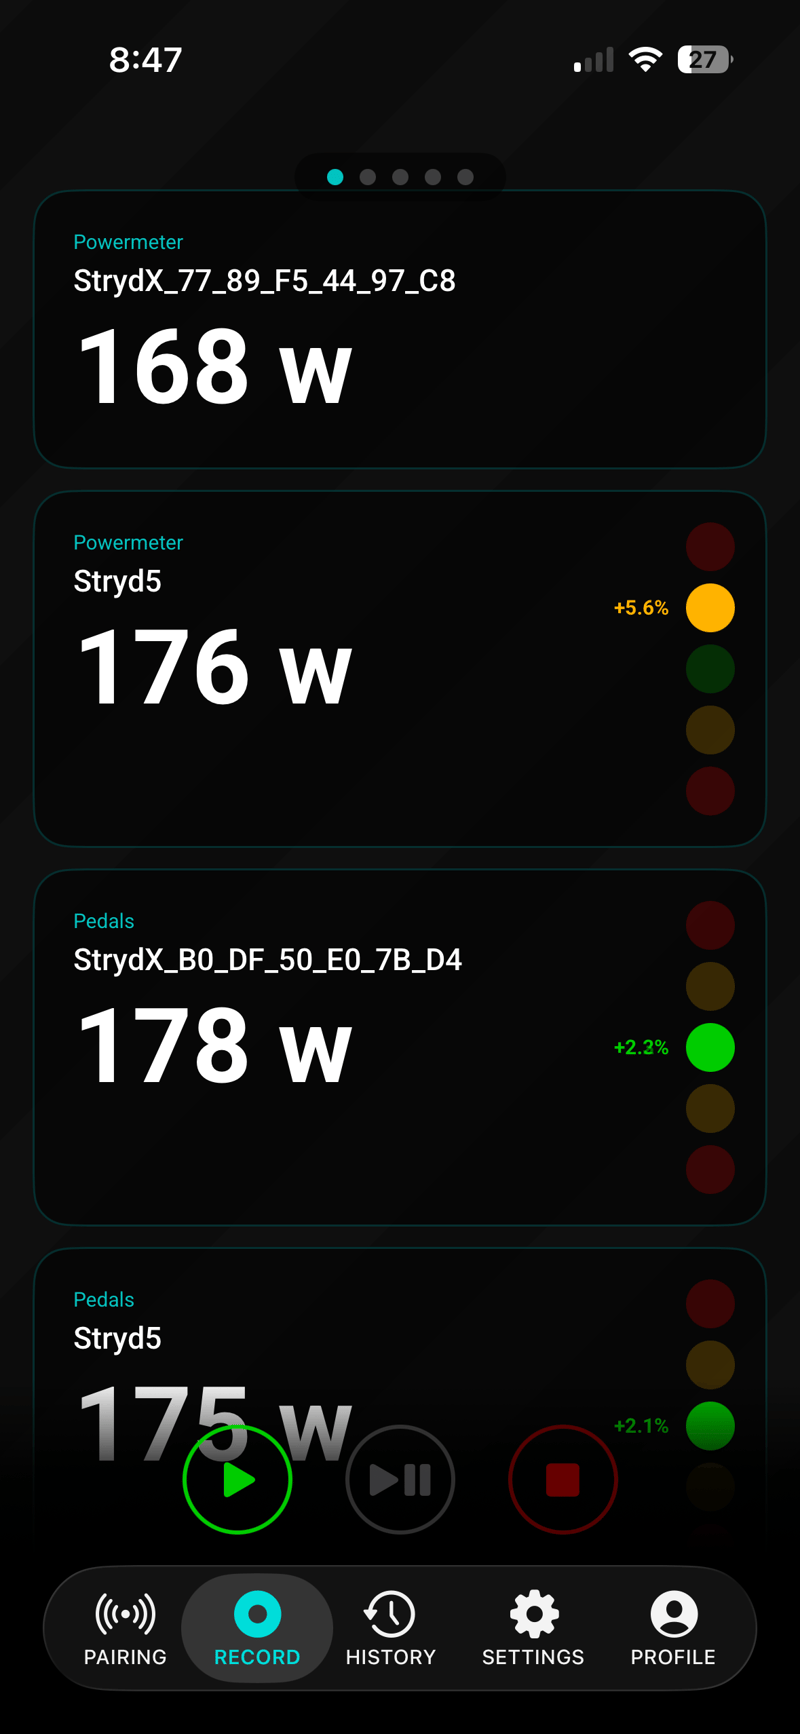
- Pods were always stacked lengthwise on the foot (as per the image at the top). It’s quite posisble foot position made a difference in power and distance.
- My family’s inexpensive treadmill seems to cause lower-than-expected power output. Meaning a dampening/cushioning effect might be in play
- While my outdoor test was at a reasonable level (300w-ish), the internal test was below reasonable levels (180w – I didn’t know how many I was going to have to do and was slightly injured and tired from a long bike ride)
- Stryd point out that, “The hill responsiveness improvements are only available outdoors, as indoor responsiveness on an incline is determined by the incline input.“
Grand Conclusion
Claim 1: “More accurate & consistent power, pace and distance”
- Accuracy: Stryd has clearly updated the power algorithm in Stryd5—the data is demonstrably different (~4% higher power readings). However, it remains unclear whether this represents improved accuracy, as there is no reference standard for running power.
- Precision: Both generations showed equivalent within-generation precision of ±1%. No improvement demonstrated.
- Signal consistency: Stryd4 produces a smoother signal (~50% less second-to-second variation). Whether Stryd5’s higher variation reflects reduced smoothing (potentially capturing more real biomechanical fluctuations) or simply noisier data cannot be determined from these tests. To fully assess the “more consistent” claim, testing would require multiple conditions (surfaces, gradients, fatigue states) and comparison with a reference standard that does not currently exist for running power.
- Distance: Not rigorously tested, though Test 1 showed Stryd5 reporting ~3% longer distances than Stryd4. Without a known reference distance, accuracy cannot be verified.
Claim 2: “Faster power responsiveness on varying terrain, climbs and descents”
- Supported. Stryd5 detected incline changes ~4 seconds faster and showed ~2x greater sensitivity to gradient changes. Test 1 outdoor data also showed that Stryd5 reached 90% peak power ~2 seconds earlier.
Practical takeaway: Users upgrading from Stryd4 to Stryd5 should expect higher power readings (~4%) and faster response to terrain changes. A less-smooth real-time signal will primarily affect users viewing raw (1-second) power; those displaying 3-second smoothed power or longer moving averages are unlikely to notice any difference in signal stability. Precision remains equivalent between generations. Whether the different power values represent improved accuracy cannot be determined.
Caveat: This testing used n=1 runners and 4 pods (2 per generation). Your pods and biomechanics may produce different results—the ~4% offset and other findings may not generalise to all units or all runners.
A note on accuracy claims: Stryd previously claimed accuracy for Stryd4; now Stryd5 is claimed to be “more accurate”, yet reports ~4% higher power. Without a gold standard for running power, neither generation’s absolute accuracy can be verified—this is a limitation of the field, not a criticism of Stryd specifically. The 5.3% pod-to-pod spread observed across four units (two per generation) is notable, though this testing is limited: one runner, four pods, and a small number of test conditions. Stryd’s internal testing with larger sample sizes may show tighter tolerances. Users should treat Stryd power as a consistent internal metric for training rather than an absolute measure of mechanical work.

Note: An ENTIRELY OPTIONAL subscription is not required by most and costs GBP8.75/mo when paid annually. For racing or training for HYROX, you don’t need a subscription, nor do you need two pods. You don’t even need a Stryd 5.0; a 4.0 is sufficient if you can find one for sale (be mindful of older second-hand units, as the battery may have degraded).
Last Updated on 17 February 2026 by the5krunner
Reader-Powered Content

This content is not sponsored. It’s mostly me behind the labour of love, which is this site, and I appreciate everyone who supports it.
Support the site: Follow (free, fewer ads) · Subscribe (paid, ad-free) · Buy Me A Coffee ❤️
All articles are written by real people, fact-checked, and verified for originality. See the Editorial Policy. FTC: Affiliate Disclosure — some links pay commission. As an Amazon Associate, I earn from qualifying purchases.

tfk is the founder and author of the5krunner, an independent endurance sports technology publication. With 20 years of hands-on testing of GPS watches and wearables, and competing in triathlons at an international age-group level, tfk provides in-depth expert analysis of fitness technology for serious athletes and endurance sport competitors.

The most important thing for runners and competitive athletes is comparing pace and distance, both on the treadmill and outdoors. It would be a good idea to conduct a test comparing the performance of the Single Pod with the Duo Pod, and between generations, but using a reference distance, such as on an athletics track, over 400, 800, or 1200 meters. Most runners use Stryd this way, especially during harsh winters and training on a treadmill at home or at the gym. Power is actually a secondary factor for road runners, and is more relevant to ultra-mountain races.
agreed. testign on a running track is a precursor to pace/distance calibration in any case.
treadmill belt speed/ pace/distance is quite different (and wrong), there are error introduced by the recovery speed gain when both feet are off the belt and this is inflenced by the characteristics of the treadmill motor https://the5krunner.com/2020/02/03/npe-runn-review-zwift-garmin/
I have a stryd, but pace and distance is not my top priority.
I either train on a track and do intervals. The track shows the distance quite easy and I know what times I have to run my intervals in. If I have to do 400m in 1:30 I have to hit the 200m mark at 45 seconds. Really all I need is a stopwatch.
If I train for longer races, I really don’t care if my long run is 27 or 28k. I do care about intensity. Heartrate is one thing, but stryd compensates for hills and wind (I live in the Netherlands, more wind than hills)
If I do a 10k race my watch/stryd may say I reached 10k slightly before the finish, but I have to keep runnung anyway.
nice technology, I joined it about 2 years ago – I liked their plans, hassle-free execution which, I guess, matched quite well my physiology of a weekend warrior (HR or pace-based plans never worked for me). It helped me to improve my HM time by 6 minutes (i never expected!!!)- I cant say what was more important – their plan or discipline or both.
I cancelled the subscription after they badly presented 5.0 with a significant bump in subscription price without explaining the benefits of increased price. And I saw no reason upgrading to 5.0 and your comparison confirmed it was a right decision. To satisfy my love to technology, I got 2nd used pod to make DUO to control L/R balance better (path visualization has a very limited use, if any use at all).
I cant agree more, that its a nice technology, if you use it as a self measure (and dont have too many shoes!!!) and (subjectively) upgrading cost doesn’t level up the insightfulness of the metrics.
Thanks for the great and in-depth analysis, as always.
One question regarding your testing methodology, especially the fact that the v5 pods recorded consistently higher power values on average.
In my testing, the v4 pods when recorded with a Suunto Race watch led to a variable number of dropouts that actually recorded null values. The duration was often short enough to not be visible as 0W on the display of the watch mid-run but would display when inspecting the exported files manually. At times the dropouts were long enough (approx. 10s or longer) to be glaringly obvious but also the micro dropouts that recorded 0 Watts for a short time at times accumulated thus leading to uncharacteristically low power values for a given run. I would presume that some internal smoothing if the values (in addition to the sliding window set in the Stryd app) had a hand in here as well.
It really was a connection issue with the Suunto Race, none of the issues occurred when recording the same pods with an Apple Watch Ultra.
I don’t doubt the correctness of your results per se (in fact they sound plausible) but I am wondering how much of the lower power readings by Stryd v4 pods may be attributable to the fact that the v4 were recorded by a Suunto watch.
hi that is a good point. ultimately i was trying to get at the data on the pod which would negate your point entirely – but i couldn’t do that. so i din’t negate your point at all!!
however
the data streams in the third test are in a csv file and every second has a data point (from my cursory look through to manually identify the lap ppoint for the AIStatbot) so it’s not happening there. it could have happened on either of the watches i suppose (first test only)
Hey, thanks for the great review!
I’m currently rehabbing a hip hike issue (glute failure/QL spasm) and run mostly on uneven trails and beach sand. Right now, my Garmin HRM-Pro+ balance data is driving me crazy—my Left/Right dominance flips constantly depending on how soft or rocky the ground is, making it impossible to track my actual physical progress.
I’m thinking about grabbing the Stryd Duo to run clean “benchmark laps,” but I have two questions based on your left/right pod swap tests:
* Does Leg Spring Stiffness (LSS) handle bad footing better than GCT? With Garmin, if I step on soft sand, my Ground Contact Time automatically spikes on that side, ruining the data. Does Stryd’s LSS balance suffer from this same “soft ground” illusion, or does it actually measure the leg’s mechanical effort regardless of the surface it lands on?
* Did you notice a built-in hardware offset? When you swapped the pods left-to-right, did one pod naturally read slightly differently? Since I’m trying to track a very subtle asymmetry (around 1%), I need to know if a 1% difference is my bad leg, or just a normal calibration difference between the two pods.
Thanks for your help!
Leon
1. IDK. I would speculate that both are fairly sensitive metrics in normal use. sand is dulling the response. the surface is defintely a factor. if you are are testing for any one thing its best to have as few other variables as possibel to confuse whtever you are testing for
2. that is covered above. there was a pod to pod variation. however if you do X tests and then swap the pods and do X tests again. it should tell you what you need to know. ask an ai what test to do to quantify that.
caveat: i’m not a statistican or scientist !
Thank you.
Caveat rejected. The technical depth of your testing makes you the best practical running scientist I am aware of 😀
n=1 ? 😉
(thank you for the kind words)
Note: I am more a jogger than a runner, some data illustrating it: CP is around 3.2-3.3 W/kg, LTpace is fluctuating around 5:25 min/km. Latest half marathons are all over 2 hours.
And I am more interested in distance accuracy than power.
In this speed/pace range I sprint, run and jog distance from my Stryd 3 is miraculously precise; it is within +/- 0.2% (at least on the same course)
One of my acquaintances who has a totally different pace range, he is fast as a devil has totally different conclusion with another piece of Styrd 3.
My point is that either running style or pace range can influence precision, OR there is a sort of extra sensitivity of a hardware element which cannot fully be controlled during manufacturing.
I am curious and would hear some words about it from others, and it is not important whether they are related to distance measured by a Stryd 3, 4 or 5.