
Garmin’s Real-Time Stamina feature is gaining two useful tools that make stamina data easier to apply to training: Stamina Curve and Stamina Zones.
Rather than simply showing how much stamina you have left during an activity, these tools help you understand how your current fitness translates into sustainable pace or power — and how different effort levels are likely to affect your stamina.
What Is Garmin Stamina Curve?
Stamina Curve shows how long you are expected to maintain different levels of effort before your stamina runs down.
It gives you a picture of your endurance across a range of intensities, from easy efforts through to near-maximal efforts.
For runners, the curve is based on pace. For cyclists, it is based on power. This makes it useful for answering practical questions such as:
- How fast can I realistically run for a particular duration?
- How much power can I sustain on the bike?
- Is my planned race pace realistic?
- Is a workout intensity sustainable?
- Has my ability to maintain longer efforts improved?
The curve can also show where your fitness is developing. For example, your training may improve your ability to sustain high-intensity efforts, your long-duration endurance, or both.
What Does Stamina Curve Measure?
Stamina Curve uses Garmin’s real-time stamina modelling to simulate how your stamina is expected to respond at different effort levels.
The model takes several factors into account, including:
- Energy expenditure
- Estimated training load
- Effort accumulated above your lactate threshold
- VO2 max
- Lactate threshold for running
- FTP for cycling
- Your ability to tolerate anaerobic efforts
- Your ability to maintain long-duration efforts
- Your recent and longer-term training history
The system then estimates how long you could maintain a particular pace or power level before reaching a physiological limit.
In simple terms, the harder you go, the faster stamina is expected to fall.
How to Use Stamina Curve
Stamina Curve is particularly useful for planning and analysing training and races.
You can use it to:
- Plan a realistic race pace
- Check whether a planned workout intensity is sustainable
- Understand the relationship between pace, power and duration
- Track how your endurance profile changes with training
For example, if your planned race pace sits at a level where the curve predicts a relatively short sustainable duration, that may indicate that the pace is difficult to maintain for the entire event.
The curve therefore gives you another way to look at pacing beyond simply asking how fast you can run or how much power you can produce.
Important Limitations of Stamina Curve
The predictions are based on your current fitness and assume that you are well recovered.
They also assume relatively steady pacing.
Real-world activities are rarely perfectly steady. Hills, accelerations, attacks, changes in pace, and other variations in effort can cause stamina to drain differently than predicted.
Garmin also states that the estimates are most accurate for intensities up to VO2 max.
The curve should therefore be treated as a performance guide rather than a guarantee of exactly how long you will be able to maintain a particular pace or power.
What Are Garmin Stamina Zones?
Stamina Zones take the information behind the Stamina Curve and turn it into five personalised effort ranges.
The zones are designed to make stamina easier to use during an activity, particularly when you are trying to control your effort.
There are always five zones, ranging from easier efforts through to maximal intensity.
The actual pace or power associated with each zone changes as your fitness changes.
How Garmin Stamina Zones Work
The zones are personalised using your physiological data.
For running, they use information such as:
- Lactate threshold pace
- VO2 max estimates
- Your training history
For cycling, the system uses:
- FTP
- VO2 max estimates
- Your training history
The result is a set of effort ranges that are linked to how Garmin expects your stamina to respond.
This connects the intensity you are producing with the rate at which your stamina is likely to decline.
How to Use Stamina Zones
Stamina Zones are primarily designed to help you control effort in real time.
During a workout, they can help you stay within your intended intensity range. This can be particularly useful when a workout calls for a controlled effort rather than simply running or riding as hard as possible.
After the activity, you can also review how much time you spent in each zone.
This can help you understand:
- Whether you followed your intended pacing
- How your effort was distributed
- Where you may have spent too much time at higher intensity
- How your pacing affected stamina during the activity
Stamina Curve vs Stamina Zones
Although both features are part of Garmin’s stamina system, they have different purposes.
Stamina Curve is primarily about planning and understanding your capabilities. It shows how sustainable different effort levels are across different durations.
Stamina Zones are primarily about controlling effort during training. They divide your intensity into five personalised ranges you can use to stay on target.
Put simply:
- Stamina Curve: How long can I sustain this pace or power?
- Stamina Zones: How hard should I be working right now?
The two features complement Garmin’s existing Real-Time Stamina data by making it easier to turn the stamina information into practical training decisions.
How Stamina Curve and Zones Fit Into Real-Time Stamina
Real-Time Stamina already provides two important measurements: Stamina and Potential Stamina.
Stamina represents how much performance capacity you have left at your current effort level. Hard efforts, such as sprints, climbs and attacks, can cause it to fall quickly.
Potential Stamina represents the effects of deeper, longer-lasting fatigue. This can include muscle damage, nervous-system fatigue and depleted glycogen stores.
During a sustained moderate effort, Stamina and Potential Stamina may remain relatively close.
Increase the intensity beyond your lactate threshold when running or FTP when cycling, and Stamina can fall faster than Potential Stamina. Once you return to a more sustainable effort, Stamina can gradually recover towards your Potential Stamina.
Stamina Curve and Stamina Zones add another layer to this information:
- Real-Time Stamina shows how much capacity you have left.
- Stamina Curve shows how sustainable different effort levels are.
- Stamina Zones show where your current effort sits within five personalised intensity ranges.
Why These New Stamina Tools Matter
The main change is that Garmin’s stamina information becomes more useful for planning as well as monitoring.
Instead of only looking at stamina during a run or ride, you can use the Stamina Curve to explore how your current fitness translates into different durations and intensities.
Stamina Zones then provide a simpler way to apply that information while you are actually training.
Together, they can help you:
- Plan race pacing
- Set realistic workout intensities
- Manage effort during long sessions
- Understand how your endurance is changing
- Review whether you executed a planned pacing strategy
Summary
Garmin’s Stamina Curve and Stamina Zones build on the existing Real-Time Stamina feature.
The Stamina Curve gives you a broader view of your performance by showing how long different levels of running pace or cycling power are expected to remain sustainable.
Stamina Zones take that information and divide your effort into five personalised intensity ranges, making it easier to control your effort during a workout.
The key difference is simple:
- Stamina Curve helps you understand what you can sustain. Stamina Zones help you control how hard you are working.
- Together with Real-Time Stamina and Potential Stamina, they give Garmin users a more detailed way to understand how current fitness, training history and exercise intensity affect endurance performance.
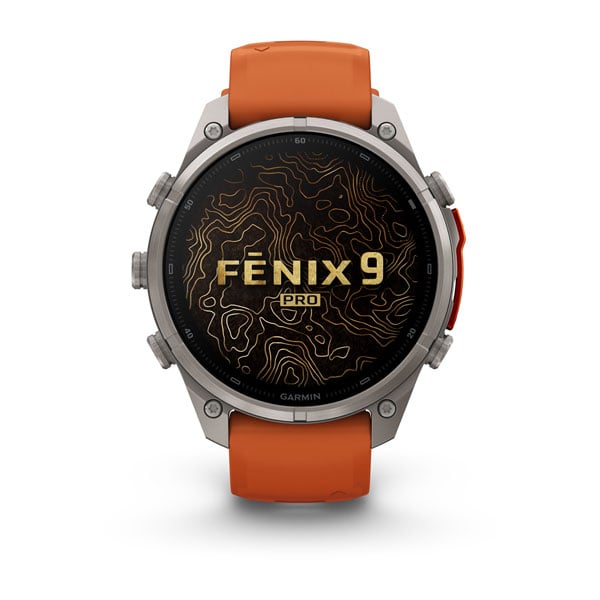
Garmin Fenix 9 range
Every Fenix 9 and Fenix 9 Pro model, including AMOLED, Solar, and inReach variants across all sizes. One link to the full range.

Further reading
- Garmin Fenix 9 vs Fenix 8: which to buy
- Fenix 9: new features explained
- Fenix 9 features will pass to existing Garmin watches
- Garmin Fenix 9 Pro specifications
Last Updated on 3 October 2026 by tfk the5krunner
Small things I always use
- Garmin 90-degree charging adapter: Charges your Garmin from any USB-C cable. Essential when travelling. I use one.
- Body Glide: The blue anti-chafe stick swimmers and runners carry. I use it.
- Speedo earplugs: Fewer ear infections and no cold-water dizziness. I use them.
- Dryrobe Advance: My winter changing robe for open-water swims. I use one. A cheaper option is the AONYIYI changing robe.
- Maurten: Race fuel that stays easy on the stomach. I use them.
- Garmin charging puck: The quickest way to top up before a session. I use one.
- Injinji: Toe socks that stop rubbing, so you run more. I use them.
- Ultimate toe protectors: Stop black toenails on long runs. They work. I use them.
- Compressport R2 v2 calf sleeves: My calf sleeves of choice. I use them.
- Cellucor C4: My pre-workout before hard sessions.
- TPU tubes: Schwalbe Aerothan, Tubolito and Pirelli SmarTube. Light, tiny spares. I use all three.
- G8 insoles: Adjustable insoles that are good. I use them.
- Cycplus Cube: A 97g electric pump that gets a road tyre rideable in two minutes. I carry one. 5% off with code THE5KRUNNER.
Watches and sensors
- Polar H10: My daily driver for waking HRV.
- Polar Verity Sense: My backup arm-worn HR sensor.
- Nomad bedside charger: Charges my iPhone and Apple Watch overnight. I use it, and many of their bands.
- Train.Red: The best muscle oxygen sensor I’ve used.
- Tymewear: Accurate heart rate and reliable ventilatory zones. I use it to pace endurance rides over an hour.
- Garmin Forerunner 970: A pro-grade triathlon watch. I use this.
- Apple Watch Ultra 4: My daily smartwatch. No phone needed on rides.
- Garmin Fenix 9 Pro: I’ve just bought one.
On the bike
- Continental GP5000 for everyday riding, and Aero 111 on the front for special occasions.
- Helmets: Specialized S-Works Evade 3 for road riding, and Rudy Project Wing for TT-style races. I use both.
- Ravemen FR300: A front light that mounts under your Garmin or Wahoo. I use one.
- Wahoo TRACKR Radar: I use it on one bike and Varia on the other. They perform the same.
- Garmin Varia RTL515: Radar that warns you of cars from behind. I use this model.
- Wahoo ELEMNT Roam 3: The bike computer that’s easy to use. I use mine on most rides.
- Favero Assioma Pro RS2: Accurate power pedals that swap easily between bikes. I use this model.
Home and indoor training
- NPE Runn: Makes my basic treadmill smart, sending more accurate speed and distance to my watch and Zwift. I use it.
- Google Wifi: Keeps Zwift connected in my pain cave. I use it.
- Apple TV 4K: Zwift on the big screen. I use two.
- Google Nest Doorbell (wired, 2nd gen): My video doorbell, running in both Google Home and Apple Home. I use it.
Health, recovery and sleep
- FreeStyle Libre 3 Plus: Shows how my blood sugar responds to diet.
- hDrop: Measures my sweat loss in summer and indoors.
- Fourth Frontier Zone: Checks my heart under load in hard sessions.
- Oura Ring 5: My partner’s recovery tracker of choice.
- Kineon MOVE+: Red light therapy for niggles. It works.
- Eight Sleep: A cooling mattress cover my partner and I use nightly.
Reader-Powered Content

This content is not sponsored. It’s mostly me behind the labour of love, which is this site, and I appreciate everyone who supports it.
Support the site: Follow (free, fewer ads) · Subscribe (paid, ad-free) · Buy Me A Coffee ❤️
Written by real people, with AI assistance. Fact-checked and verified for originality. See the Editorial Policy. FTC: Affiliate Disclosure — some links pay commission. As an Amazon Associate, I earn from qualifying purchases.
tfk is the founder and author of the5krunner, an independent endurance sports technology publication. With 20 years of hands-on testing of GPS watches and wearables, and competing in triathlons at an international age-group level, tfk provides in-depth expert analysis of fitness technology for serious athletes and endurance sport competitors. ID
