Untested by any study; Garmin publishes the 28-day window but not the weighting
Seeing whether this week’s training is a spike against the past month
Not shown on Edge bike computers, a modelled value, and easily misread as fitness
Plain English: Chronic load is an athlete’s training baseline, roughly how much training stress the body has been absorbing each week over the past month. A higher number means a bigger recent training base, and a lower number means less. The watch compares the latest week against it to judge whether training is building gradually or jumping.
In practice: This metric is useful when combined with its trend and recent (acute) load. Typically you want it to steadily rise over many months to get fit. See it as unrealised fitness. You can’t get at that fitness until you reduce fatigue with a taper. One key issue is that it is simply a formula, a model, that approximates the impact of your accumulated load. How you feel, and actual measurements such as HRV, can help you triangulate a true view of your fitness and readiness.
Quick answers
What is chronic load on Garmin?
Garmin defines chronic load as a weighted average of your acute load scores over the past 28 days. Acute load is itself normalised to a 7-day window, so chronic load reads in the same units and shows what a typical recent week has looked like.
What is a good chronic load on Garmin?
Garmin publishes no good or bad bands for chronic load, because it is the athlete’s own baseline. What Garmin rates is the load ratio, acute load divided by chronic load, which its owner’s manuals call optimal between 0.8 and 1.4.
Why did my Garmin chronic load drop?
A break, a taper, or an illness lowers acute load first, and the 28-day average then follows. Activities recorded without heart rate add little or nothing, because the load figures are built from EPOC estimated from heartbeat data.
Which Garmin watches show chronic load?
Watches whose owner’s manual lists Load Ratio show it, including Forerunner 970, 965, 570, 265, 255, 170 and 70, Fenix 8, Fenix 9, Fenix E, Enduro 3 and 4, Venu X1 and Epix (Gen 2). The Edge 1050 and 1060 bike computer manuals do not include it.
Chronic Load – a deep dive
When chronic load is actually useful
- Looking at week-on-week progression. Your plan should cause it to rise progressively within a range your body can cope with.
- Combined with acute load, to see how the two are balanced, a modelled view of readiness.
Introduction
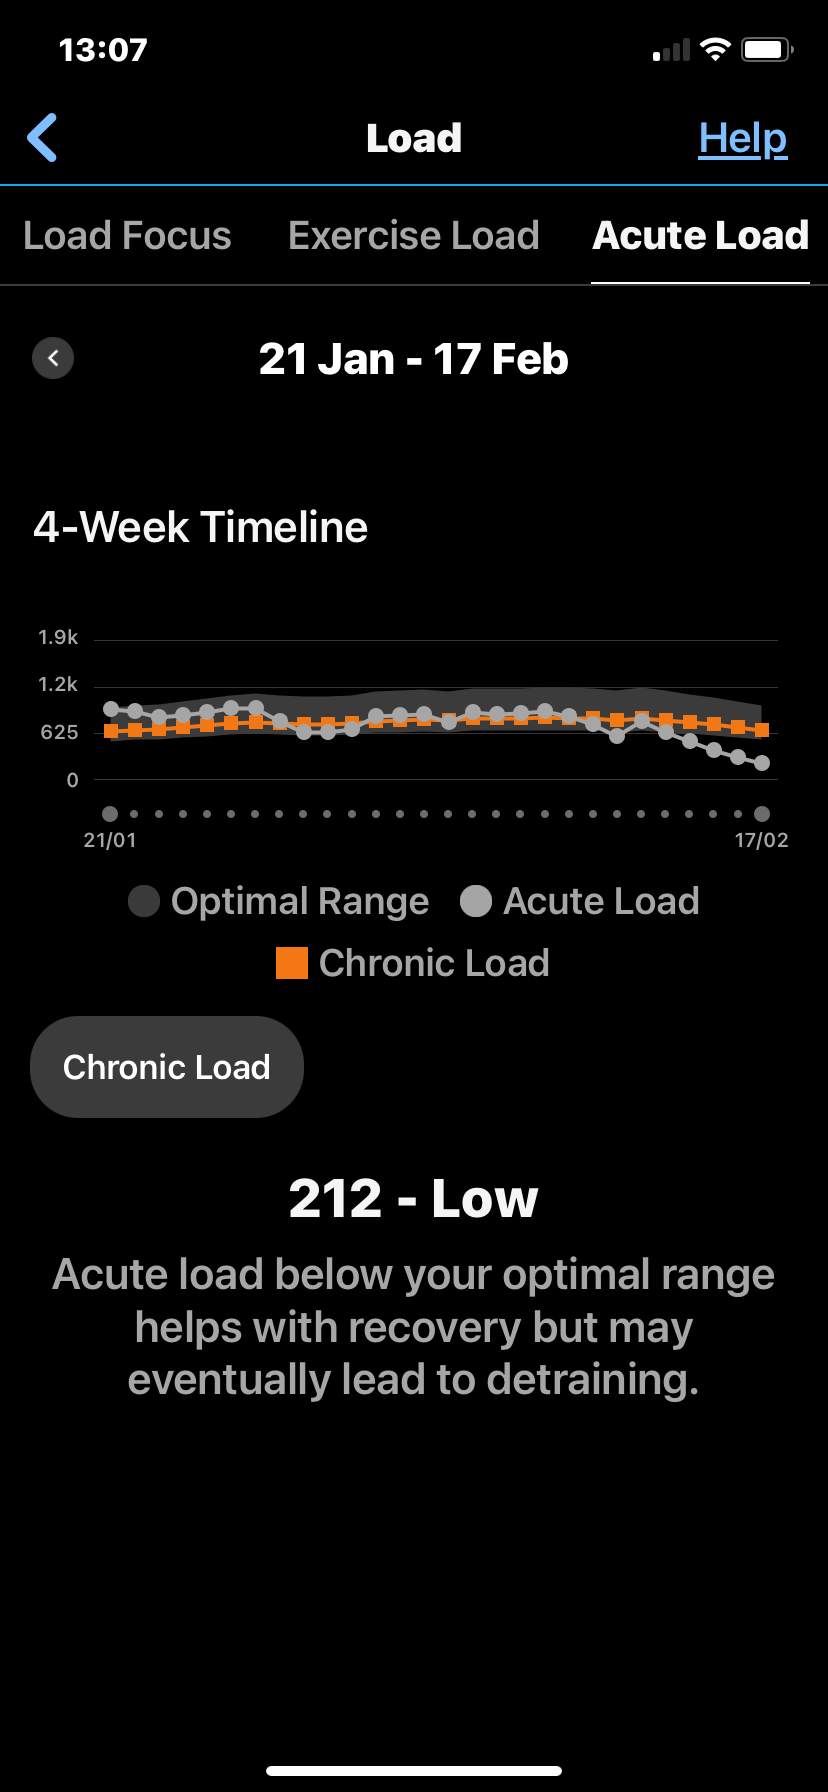
Garmin Chronic Load is, in Garmin’s words, “a weighted average of your acute load scores over the past 28 days.” It is the long-term half of Garmin’s training load figures, and its job is to give the short-term figure something to be compared against. Garmin’s owner’s manuals describe load ratio as “the ratio of your acute (short-term) training load to your chronic (long-term) training load.”
Chronic load belongs to a group Garmin calls training load, which it says “is comprised of Acute Load, Chronic Load, Exercise Load, and Load Ratio.” It appeared in Garmin Connect in February 2023 and arrived on the watch with the Forerunner 965 in March 2023, where DC Rainmaker listed the new “Chronic Training Load feature” alongside Training Load Ratio. No study has tested Garmin’s figure, and the research behind acute-to-chronic comparisons has weakened since they became popular.
What chronic load actually means
A higher chronic load means more training stress absorbed over the past four weeks, and a lower one means less. It has no good or bad value of its own. A runner building towards a marathon and a recreational runner can both be well served by very different numbers, because the figure only describes what each has been doing. Garmin publishes no bands, colour gauge or age and sex norms for chronic load itself.
The rating Garmin does publish is for load ratio, which divides acute load by chronic load. The owner’s manuals give these bands, and add that “The optimal range is based on your individual fitness level and training history.”
| Load ratio status | Value | Garmin’s description |
|---|---|---|
| No status | None | Visible after 2 weeks of training |
| Low | Lower than 0.8 | Short-term load lower than long-term load |
| Optimal | 0.8 to 1.4 | Short-term and long-term loads balanced |
| High | 1.5 to 1.9 | Short-term load higher than long-term load |
| Very High | 2.0 or higher | Short-term load significantly higher |
Source: Load Ratio, Garmin Forerunner 965 and Forerunner 970 owner’s manuals. Garmin’s support FAQ gives a different range, saying “The optimal range is 0.8 – 1.5 and does not change.” The manuals are followed here.
How Garmin calculates chronic load
Garmin states each step of the chain. Every activity produces an exercise load based on excess post-exercise oxygen consumption (EPOC), which Garmin estimates “by analysing heartbeat data and applying advanced mathematical modelling and machine learning.” Acute load then combines recent exercise loads in a weighted moving average: “Record a new activity, and the resulting load is added in full to your current acute load. The influence of that activity then gradually expires during the next 10 days, and the combined total load is normalised to reflect a 7-day window.” Chronic load is the weighted average of those acute load scores over 28 days.
Garmin does not publish the weighting inside the 28 days, so how much last week counts against four weeks ago is unknown. Because every figure starts from heart rate, an activity recorded without heart rate data contributes little or nothing, and the load ratio only appears after 2 weeks of training.
What affects the chronic load reading
Time away from training has the largest effect. During a break or a taper, the acute load falls first, and the 28-day average follows it down over the following weeks, so a lower chronic load after a race block is expected rather than a sign of lost fitness. The same happens during an illness, when training stops.
Heart rate quality shapes the figure because EPOC is estimated from it. Training that raises heart rate little for the work done adds less load than it feels like, and an activity with a poor heart rate trace adds load that did not happen.
How accurate is Garmin chronic load
No study has validated Garmin’s chronic load. PubMed searches in November 2026 found no paper testing Garmin’s EPOC-based figure. The definition is clear because Garmin publishes it. Whether the number predicts anything useful is untested.
The idea behind comparing acute and chronic load comes from Gabbett’s 2016 review, which popularised the acute:chronic workload ratio as an injury warning. Impellizzeri and colleagues (International Journal of Sports Physiology and Performance, 2020, PMID 32502973) later set out conceptual and statistical problems with the ratio. In a cohort of 5,205 runners whose data came from Garmin devices, Frandsen and colleagues (British Journal of Sports Medicine, 2025, PMID 40623829) found that a distance-based ratio did not flag injury risk in the expected direction, while single runs more than 10% longer than the longest run of the previous 30 days did. That study used distance rather than Garmin’s EPOC load, but it is the largest set of Garmin data on the question.
Competitor equivalents
- Polar’s Tolerance, part of Training Load Pro, is the average daily load of the past 28 days, built from heart-rate TRIMP rather than EPOC.
- Apple Watch Training Load compares the strain of the last seven days with the last 28 days, using workout effort ratings from 1 to 10.
- COROS Base Fitness is a 42-day rolling average of training load, compared with a 7-day Load Impact.
- Suunto shows a chronic training load (CTL) built from TSS, alongside acute load and form, without publishing the CTL window.
- WHOOP has no equivalent, because its Strain score covers a single day or workout.
- Oura’s Activity Balance compares the past 14 days with the past two months, but only as an input to its Readiness score.
Which Garmin devices support chronic load
Chronic load appears on the watch where the owner’s manual lists Load Ratio. In November 2026, that includes Forerunner 970, 965, 570, 265, 255, 170 and 70, Fenix 8, Fenix 9, Fenix E, Enduro 3 and 4, D2 Mach 1 and Mach 2, Epix (Gen 2), Tactix 7 and 8, Quatix 8, MARQ (Gen 2), Venu X1, Approach S70 and Descent Mk3. The Edge 1050 and 1060 manuals cover acute load but not load ratio or chronic load, and Garmin does not say whether Garmin Connect shows a chronic load chart for Edge owners. The feature arrived on the watch with the Forerunner 965 in March 2023.
Where to find chronic load on Garmin
- Garmin Connect app: More, then Performance Stats, then Training Status, and select Chronic Load, which Garmin draws in orange.
- Garmin Connect website: Performance Stats, then Training Status.
- Watch: the training load screens inside the Training Status or Training Readiness glances, which show acute load and load ratio.
Common problems and misreadings
A falling chronic load during a taper or holiday is expected, not a fault. See Quick answers above.
The optimal load ratio range differs between Garmin’s own documents. The support FAQ calls 0.8 to 1.5 optimal and fixed, while the owner’s manuals call 0.8 to 1.4 optimal and say it is personal. A ratio of 1.5 is therefore high in the manuals and optimal in the FAQ.
Reading chronic load as fitness is the other common misreading. It measures recent training, so it rises with hard weeks whether or not they improve fitness, and it falls during the rest that lets fitness show.
How to improve chronic load
Chronic load rises by training more, consistently, over weeks. The safest way to raise it is gradually, keeping the load ratio inside the optimal band so that each week adds to the base rather than jumping above it. The Frandsen study suggests one more check for runners: avoid any single run more than 10% longer than the longest run of the past 30 days, because those sessions predicted overuse injury better than the ratio did.
Scientific basis
Banister EW, Calvert TW. Canadian Journal of Applied Sport Sciences, 1980. PMID 6778623. The fitness-fatigue model, in which training produces a long-lasting fitness effect and a shorter fatigue effect, is the origin of every long-term load figure, Garmin’s included.
Gabbett TJ. British Journal of Sports Medicine, 2016. PMID 26758673. The review popularised comparing acute with chronic workload, and argued that a high chronic load protects athletes when it is built gradually.
How chronic load connects to other Garmin features
Chronic load is built from acute load and is the denominator of the training load ratio. Both are part of Garmin’s wider training load figures, alongside load focus, which splits the same four weeks by intensity. Training status and training readiness show the training load screens on the watch.
Small things I always use
- Garmin 90-degree charging adapter: Charges your Garmin with any USB-C cable. Essential when travelling. I use one.
- Body Glide: The blue anti-chafing stick swimmers and runners carry. I use it.
- Speedo earplugs: Fewer ear infections and no cold-water dizziness. I use them.
- Dryrobe Advance: My winter changing robe for open-water swims. I use one. A cheaper option is the AONYIYI changing robe.
- Maurten: Race fuel that stays easy on the stomach. I use them.
- Beet It Sport nitrate shots: Beetroot shots I take in the days before a race. I use them.
- Garmin charging puck: The quickest way to top up before a session. I use one.
- Injinji: Toe socks that stop rubbing, so you run more. I use them.
- Ultimate toe protectors: Stop black toenails on long runs. They work. I use them.
- Compressport R2 v2 calf sleeves: My calf sleeves of choice. I use them.
- Cellucor C4: My pre-workout before hard sessions.
- TPU tubes: Schwalbe Aerothan, Tubolito and Pirelli SmarTube. Light, tiny spares. I use all three.
- G8 insoles: Adjustable arches, perfect position. I use them.
- Cycplus Cube: A 97g electric pump that gets a road tyre rideable in two minutes. I carry one. 5% off with code THE5KRUNNER.
Health, recovery and sleep
- Kineon MOVE+: Red and infrared light for sore knees, Achilles and other joints after hard training. I use it.
- FreeStyle Libre 3 Plus: Shows how my blood sugar responds to diet. Occasional use.
- hDrop: Measures my sweat loss in summer and indoors. I use it.
- Fourth Frontier Zone: Checks my heart under load in hard sessions.
- Oura Ring 5: My partner’s recovery tracker of choice.
- Eight Sleep: A cooling mattress cover my partner and I use nightly.
Watches and sensors
- Polar H10: My daily driver for waking HRV.
- Polar Verity Sense: My backup arm-worn HR sensor.
- Nomad bedside charger: Charges my iPhone and Apple Watch overnight. I use it, and many of their bands.
- Train.Red: The best muscle oxygen sensor I’ve used. Occasional use.
- Tymewear: Accurate heart rate and reliable ventilatory zones. I use it to pace endurance rides over an hour.
- Garmin Forerunner 970: A pro-grade triathlon watch. I use this.
- Apple Watch Ultra 4: My daily smartwatch. No phone needed on rides.
On the bike
- Continental GP5000 for everyday riding, and Aero 111 on the front for special occasions. I use both.
- Helmets: Specialized S-Works Evade 3 for road riding, and Rudy Project Wing for TT-style races. I use both.
- Ravemen FR300: A front light that mounts under your Garmin or Wahoo. I use one.
- Ravemen FR1000: The light and the computer mount in one unit, so nothing else goes on the bars. Better than mine.
- Ravemen FR1500SE: 1,500 lumens hanging under your Garmin, for proper night rides.
- Ravemen FR1100SE: 1,100 lumens under your Garmin, and up to 46 hours on slow flash.
- Ravemen FR500: A brighter FR300 with the same mount.
- Wahoo TRACKR Radar: I use it on one bike and Varia on the other. They perform the same.
- Garmin Varia RTL515: Radar that warns you of cars from behind. I use this model.
- Wahoo ELEMNT Roam 3: The bike computer that’s easy to use. I use mine on most rides.
- Favero Assioma Pro RS2: Accurate power pedals that swap easily between bikes. I use this model.
Home and indoor training
- NPE Runn: Makes my basic treadmill smart, sending more accurate speed and distance to my watch and Zwift. I use it.
- Google Wifi: Keeps Zwift connected in my pain cave. I use it.
- Apple TV 4K: Zwift on the big screen. I use two.
- Google Nest Doorbell (wired, 2nd gen): My video doorbell, running in both Google Home and Apple Home via Starling. I use it.
Reader-Powered Content

This content is not sponsored. It’s mostly me behind the labour of love, which is this site, and I appreciate everyone who supports it.
Support the site: Follow (free, fewer ads) · Subscribe (paid, ad-free) · Buy Me A Coffee
Written by real people, with AI assistance. Fact-checked and verified for originality. See the Editorial Policy. FTC: Affiliate Disclosure — some links pay commission. As an Amazon Associate, I earn from qualifying purchases.
