Garmin Training Effect: How It Works, Accuracy and Answers to FAQs
Reliable as a relative measure for comparing sessions of the same type; less reliable as absolute physiological values
Athletes who want to confirm that the intensities of workout execution matched the plan — and to balance aerobic and anaerobic stimulus across the week
Aerobic score inflates in heat, illness or fatigue without flagging that this has happened
Quick answers
Why is my anaerobic Training Effect always zero?
The anaerobic score responds only to efforts of 10 to 120 seconds at near-maximal intensity. Sustained running at threshold pace or below generates little or no anaerobic score, however demanding it feels. Include short sprint intervals — 200-metre to 400-metre repeats with full recovery between each — to generate a meaningful anaerobic Training Effect.
Why does my aerobic Training Effect seem too high after an easy run?
The aerobic score reflects physiological strain on the heart, not external pace. Heat, poor sleep, illness, or a loose optical sensor all elevate heart rate relative to actual effort, inflating the score. Check those conditions before concluding the session was harder than it felt; a chest strap produces a more stable reading when any of those factors are present.
What does a Training Effect score of 5.0 mean?
A 5.0 indicates overreaching and carries a Garmin warning that extended recovery is required before the next hard effort. Occasional scores at 5.0 are physiologically normal during hard training blocks. A consistent pattern of 5.0 scores without intervening recovery sessions is a signal to reduce load.
Does Training Effect differ between running on a treadmill and running outside?
The aerobic score is largely unaffected, as it derives from heart rate regardless of surface. The anaerobic score can be affected if the treadmill is used without a footpod, because the device cannot resolve short, high-intensity speed variations from treadmill belt data alone. Outdoors, GPS pace anchors the anaerobic calculation; on a treadmill without a footpod, the anaerobic score reflects only a partial picture of short efforts.
Garmin Training Effect — A Deep Dive
When Training Effect Is Actually Useful
- I check Training Effect after a run or ride as a sense check — less a prompt to put the shoes back on and do more, more a confirmation that the session was executed as intended.
- After a recent long run in the heat, the morning after a hard 2.5-hour evening ride, I scored 4.4 aerobic and 0.1 anaerobic. On the face of it, 4.4 seemed high for a slow long run, but my heart rate was elevated from accumulated fatigue, with heat accounting for the rest. My assessment is that the true aerobic stimulus was probably somewhere between 4.2 and 4.4. A 95-hour predicted recovery time confirmed every metric was reading the same story: the session was harder than my pace alone suggested.
- My confidence in the anaerobic score is higher on the bike, where a calibrated power meter feeds the calculation. That matters in practice: pacing longer runs is generally manageable, but hills and riding with others reliably push my cycling intensity higher than planned. Training Effect quantifies that irrational exuberance in a way that pace alone cannot.
Garmin Training Effect is a post-activity score on a 0 to 5 scale that quantifies the physiological stimulus of a single training session on aerobic and anaerobic fitness. Two separate values are produced for each workout: one for aerobic benefit and one for anaerobic benefit. Training Effect is a per-session measure that resets at the start of each session; the accumulated effect of multiple sessions over seven days is represented separately by Training Load. The principal limitation is its dependence on heart rate accuracy for the aerobic score — any condition that elevates heart rate relative to actual effort will inflate the aerobic value without signalling that this has occurred.
What the Number Actually Means
Both scores follow the same 0 to 5 scale. Below 1.0 indicates no meaningful stimulus. The 2.0 to 2.9 range indicates sufficient effort to maintain existing fitness but not to advance it. The improving range begins at 3.0, and the highly improving range begins at 4.0. A score of 5.0 indicates overreaching, requiring extended recovery before the next hard effort. The aerobic and anaerobic scores are independent: a long tempo run might return an aerobic score of 4.2 and an anaerobic score of 0.3, while a session of short maximal intervals might return 3.5 aerobic and 3.8 anaerobic.
| Score range | Label | Meaning |
|---|---|---|
| 0.0 – 0.9 | No benefit | Insufficient stimulus to produce a training effect |
| 1.0 – 1.9 | Minor benefit | Contributes to recovery or very light maintenance |
| 2.0 – 2.9 | Maintaining | Sufficient to maintain current fitness but not to advance it |
| 3.0 – 3.9 | Improving | Stimulus sufficient to improve fitness with adequate recovery |
| 4.0 – 4.9 | Highly improving | Strong stimulus; recovery required before the next hard session |
| 5.0 | Overreaching | Excessive stimulus; extended recovery required |
How Garmin Calculates It
Firstbeat Analytics calculates Aerobic Training Effect from the peak EPOC value reached during the session — the peak rather than the total means a brief high-intensity spike scores differently from a session that sustains that intensity throughout. The algorithm estimates EPOC in real time from heart rate data, accounting for the athlete’s fitness level and training history. Steady efforts at moderate intensity and intervals exceeding 180 seconds both increase the aerobic score.
Anaerobic Training Effect uses heart rate and speed or power, because the anaerobic energy system operates above the threshold where heart rate alone provides sufficient accuracy. The algorithm identifies high-intensity intervals of 10 to 120 seconds and calculates the anaerobic EPOC contribution from those efforts. Efforts below 10 seconds contribute little; efforts sustained beyond 120 seconds shift progressively into the aerobic domain.
What Affects the Reading
The aerobic score is distorted by anything that artificially elevates heart rate: heat, altitude, illness, poor sleep, and alcohol all raise heart rate at a given pace, inflating the aerobic Training Effect. Wrist optical heart rate produces larger errors than a chest strap, particularly during high-cadence running and in cold conditions. A new athlete will also see elevated scores in the first few sessions before the device has accumulated sufficient data to calibrate its estimate of fitness level; scores normalise over several weeks.
The anaerobic score is less susceptible to heart rate noise because speed or power anchors its calculation, but it requires a reliable pace or power signal. On a treadmill without a footpod, or indoors on a stationary bike without a power meter, the anaerobic score reflects only a partial picture of short efforts. On the bike with a paired power meter, the anaerobic calculation benefits from the greater precision of power data over GPS pace for short, high-intensity efforts.
How Accurate Is It
Firstbeat’s validation of the EPOC model underlying the aerobic score shows strong correlation with laboratory-measured EPOC under controlled conditions using chest-strap heart rate. The aerobic Training Effect score is best understood as a relative measure — useful for comparing sessions of the same type over time — rather than as an absolute physiological value. The anaerobic score carries greater inherent uncertainty because the anaerobic energy contribution is beyond the accuracy of any wrist-worn device; treat it as a directional indicator rather than a precise measurement.
Competitor Equivalents
- Polar offers Training Benefit as a text-based label derived from time spent in heart rate zones, with no numerical score; EPOC estimates are shown separately, but aerobic and anaerobic benefits are less explicitly distinguished.
- Suunto historically used Firstbeat’s Training Effect on older devices; current Suunto devices use a workout classification system based on training zones rather than a numeric score.
- Coros provides a Training Effect score via its EvoLab platform, using a TRIMP-based model rather than Firstbeat’s EPOC approach, and a Training Focus label that classifies each session by energy system.
- Apple offers no Training Effect equivalent; the Effort Rating introduced in watchOS 11 is a manually adjusted RPE-based input that does not automatically distinguish between aerobic and anaerobic stimuli.
- Wahoo provides no Training Effect equivalent on its cycling computers; training load analysis relies on third-party integrations such as TrainingPeaks.
Which Garmin Devices Support It
Garmin introduced Training Effect in 2012 on the Forerunner 610, the first Garmin device to carry Firstbeat’s EPOC-based aerobic scoring. [EDITOR: verify before publishing — introduction year and first device not confirmed from a primary Garmin source in this session.] The feature is supported across all current Forerunner, Fenix, Enduro, Epix, Tactix, and Edge series. The Forerunner 165 is the most accessible current model to include. The Forerunner 55 sits below the threshold at which Training Effect and Training Status become available, as do entry-level Vivoactive and Venu models. On Edge cycling computers, the anaerobic score requires a paired power meter; without one, only the aerobic score is produced.
Where to Find It
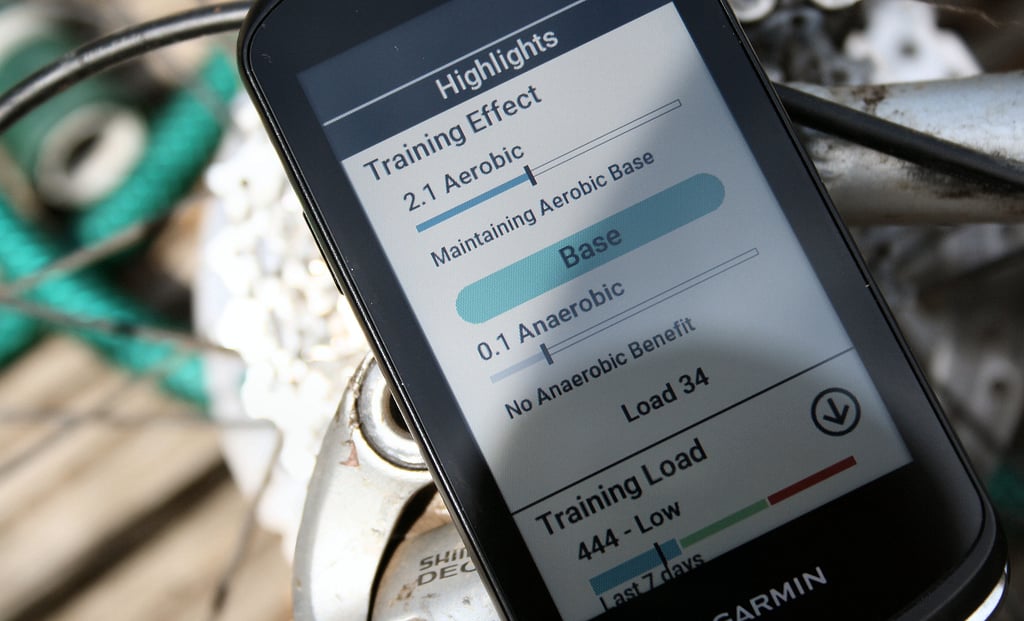
- Activity summary screen: both aerobic and anaerobic scores appear at the end of each session.
- Real-time data fields: add Aerobic Training Effect and Anaerobic Training Effect fields to a training screen via activity profile settings; both update in real time during the session and are found in the Heart Rate data field category.
- Garmin Connect activity detail: both scores appear beneath the performance summary alongside the seven-label description of the primary benefit; historical data is accessible within individual activity records rather than as a standalone trend chart.
Common Problems and Misreadings
An aerobic score that seems too high after an easy run is most often due to an elevated heart rate caused by heat, fatigue, illness, or a loose optical sensor. See FAQ above for detail.
An anaerobic score of 0.0 after a hard session is normal for sustained efforts. The anaerobic score responds only to short maximal intervals; a threshold run at sustained effort produces a high aerobic score and a near-zero anaerobic score regardless of perceived difficulty. See FAQ above for detail.
A consistently low aerobic Training Effect despite hard training often points to a maximum heart rate set too high in the athlete’s profile. If the device believes maximum heart rate is higher than the athlete’s true physiological maximum, EPOC estimates are compressed downward. Confirm the maximum heart rate value through a maximal field test.
How to Improve It
To raise the aerobic Training Effect, extend session duration or sustain effort at 70 to 85 per cent of maximum heart rate for 30 to 60 minutes. To generate meaningful anaerobic Training Effect, include efforts of 10 to 120 seconds at near-maximal intensity with full recovery between repetitions — 200-metre to 400-metre repeats at close to maximum speed produce the highest anaerobic scores in running; on the bike, short maximal efforts with a paired power meter produce the equivalent result.
Every session need not score highly on both scales. The goal is a distribution across sessions that aligns with the Load Focus targets for low-aerobic, high-aerobic, and anaerobic training.
Scientific Basis
Firstbeat Technologies (2015). “EPOC-Based Training Effect Assessment.” Firstbeat White Paper. Describes the heart rate-based EPOC estimation methodology and the mapping of peak EPOC values to the 0–5 aerobic Training Effect scale.
Firstbeat Technologies (2017). “Aerobic and Anaerobic Training Effect Assessment.” Firstbeat White Paper. Describes the algorithm for detecting high-intensity intervals and estimating anaerobic EPOC contribution, with field validation results from sprint and interval running sessions.
Rusko, H. et al. (2003). “Prediction of EPOC: A tool for monitoring fatigue accumulation during exercise?” ACSM Congress, San Francisco. Early validation of the Firstbeat heart rate-based EPOC model, showing strong correlation between predicted and measured EPOC during cycle ergometer exercise across multiple intensities.
How It Connects to Other Features
Training Load is the seven-day sum of EPOC values from all sessions; each Training Effect score contributes directly, with high aerobic sessions feeding the high-aerobic Load bucket and meaningful anaerobic scores driving the anaerobic Load Focus figure. Training Status uses the accumulated load that Training Effect feeds as its primary input, alongside VO2 max trends. Load Focus distributes training across low-aerobic, high-aerobic, and anaerobic categories using the same EPOC-derived classification — the Training Effect colour coding on the activity summary maps directly to these three categories. VO2 Max is updated by qualifying runs independently, but the sessions generating the highest aerobic Training Effect scores are also those most likely to produce upward movement in the VO2 max estimate over time.
