Millions of Garmin workouts reveal their biggest predictor of VO2 max.

Garmin has released its annual running and cycling data reports, drawn from Garmin Connect activity logs across 2025. The data covers millions of users worldwide. The headline finding is one that exercise science has long supported: athletes who train more tend to record higher VO2 max values. At this scale, the relationship is consistent across every mileage band.
What the data shows
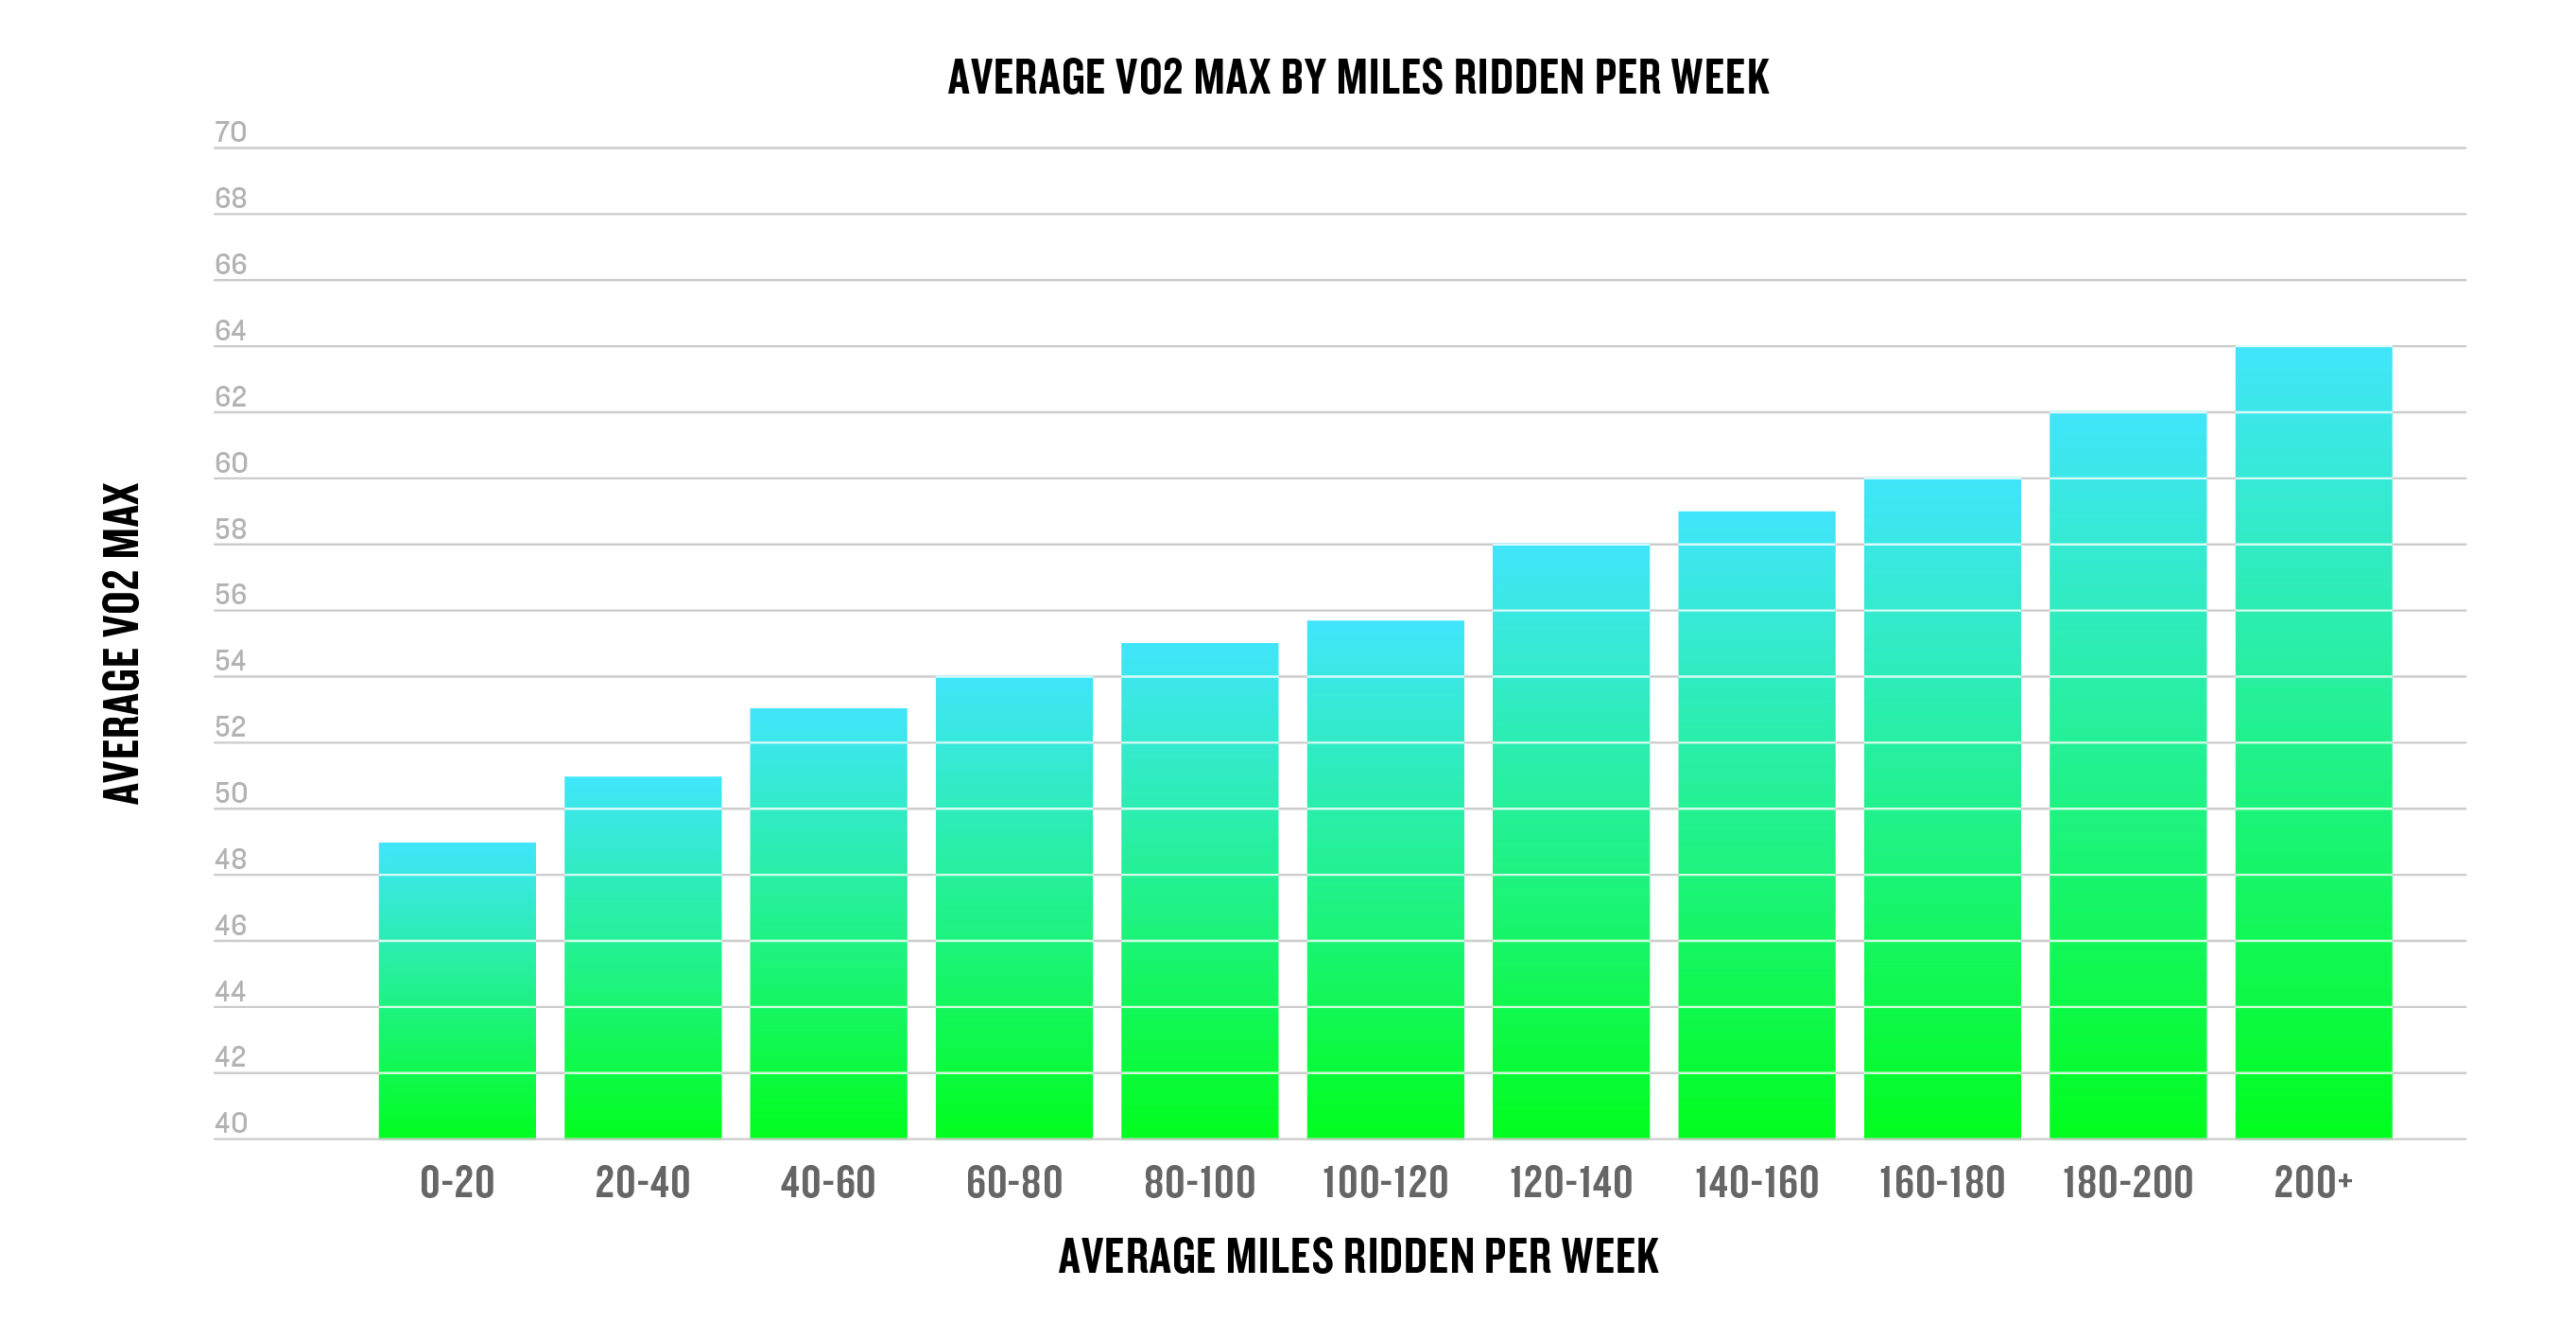
Among cyclists, the association between weekly mileage and VO2max is consistent throughout. Riders averaging 0-20 miles per week recorded an average VO2 max of 49. Those averaging 200 miles or more recorded 64. The progression is steady: 20-40 miles per week returned 51, 40-60 returned 53, 60-80 returned 54, continuing upward to the 180-200 band at 62. No obvious plateau is visible within the mileage ranges Garmin reports.
The running report did not publish equivalent VO2 max data by mileage band, but resting heart rate followed a similar pattern. Non-runners averaged 62 bpm. Runners covering 0-5 miles per week averaged 59 bpm. Those running more than 31 miles per week averaged 55 bpm. The relationship is linear throughout.
The overall averages: Garmin cyclists recorded a mean VO2 max of 51, runners 50. Both figures fall within the good-to-excellent range for recreational athletes, though the exact range depends on age and sex. How those benchmarks break down by demographic is covered in the site’s detailed VO2 max guide.
What VO2 max is
VO2 max is the maximum rate at which the body can consume oxygen during sustained exercise, expressed in millilitres per kilogram of bodyweight per minute – think of it as the sporting efficiency of an average kilogram of your body. It is the primary measure of aerobic ceiling and correlates with endurance performance across distances ranging from 5K to Ironman. It also correlates with healthspan, i.e., the length of your healthy life.
Greater training volume generally provides more opportunity for aerobic adaptation, though training intensity, recovery, and genetics also influence the outcome. The Garmin data reflects the volume relationship at a scale no laboratory study can approach, although it isn’t ‘science’ in and of itself.
Garmin estimates VO2max via the Firstbeat Analytics algorithm, which analyses the relationship between heart rate and pace during runs, or heart rate and power during cycling with a paired power meter. Under controlled conditions with chest-strap heart rate, Firstbeat’s validation puts accuracy within approximately 5% of laboratory spirometry. The estimate is directionally reliable for tracking trends even where the absolute figure diverges from lab results.
Age and VO2 max
The age effect is significant and worth understanding separately from the training volume effect. Among Garmin cyclists, the 20-29 age group averaged a VO2 max of 57, falling to 53 for 30-39, 50 for 40-49, 48 for 50-59, 46 for 60-69, and more significantly to 42 for those over 70. The decline is broadly consistent across every decade.
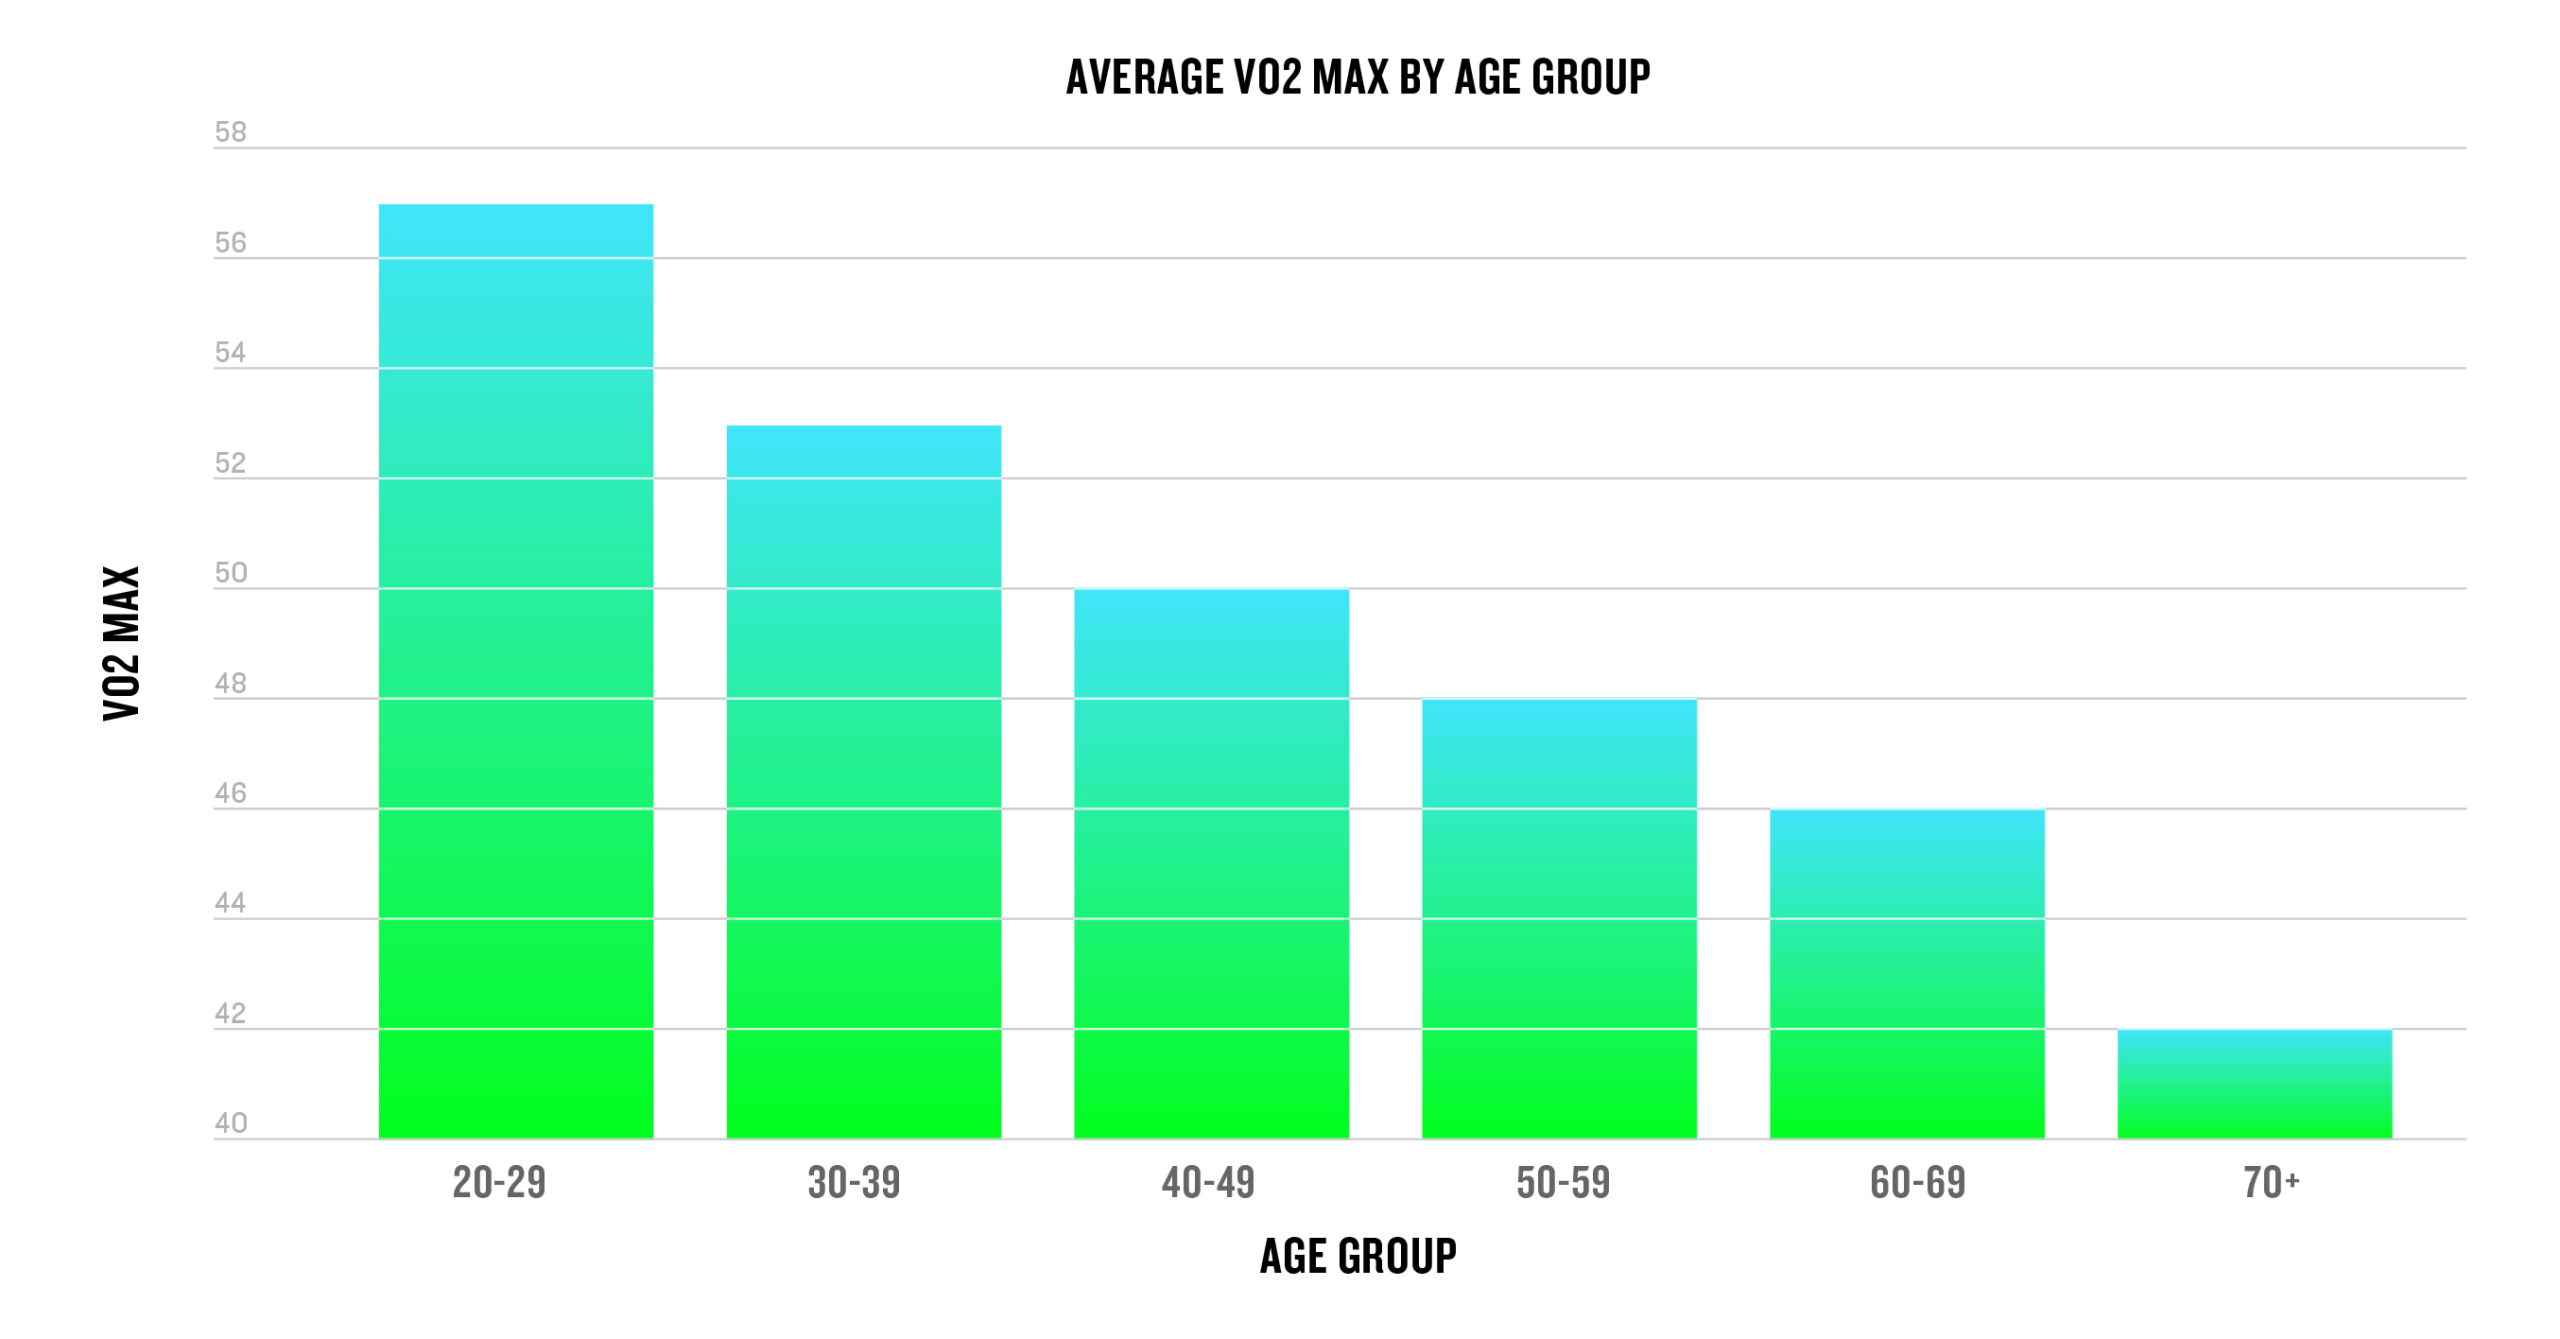
This is a normal physiological process driven by reduced cardiac output and changes in muscle composition. It does not mean older athletes cannot improve their VO2 max. They can, and the training volume relationship holds regardless of age group. It means the benchmark for what constitutes a good number shifts downward with each decade, which is why age-adjusted comparisons matter more than raw figures.
What this means is that if you are trying to improve your VO2 max
The Garmin data points toward several practical conclusions for athletes tracking this metric.
Volume is the strongest lever. The data show a clear and consistent association between weekly mileage and VO2 max across all training bands. Athletes who ride or run more tend to score higher. Progressively building weekly volume is the most reliable approach.
Intensity still matters. Volume alone does not tell the full story. High-intensity efforts — intervals, threshold work, race-pace sessions — provide an adaptation stimulus that easy miles cannot replicate. A programme that combines both is more effective than accumulating easy miles.
Age adjusts the target, not the principle. VO2 max declines with age, but the training volume relationship holds across all decades. Older athletes who train consistently record higher VO2 max values than sedentary peers of the same age. The ceiling is lower; the lever still works.
Consistency over weeks matters more than any single session. Garmin’s algorithm requires qualifying sessions — at least 10 minutes at approximately 70% of maximum heart rate for running, 20 minutes of steady effort with a power meter for cycling — to update the estimate. A single hard week will not move the number. Sustained training over months will.
Track trends, not absolutes. Garmin’s estimate carries an error margin of approximately 5% under good conditions, and more under heat, altitude or optical heart rate. The value of the metric is in the direction of travel over weeks and months, not the precise figure on any given day.
What else does the data show
- Indoor running activity increased by 12.6% per user in 2025 compared to 2024, compared to 3.2% for outdoor running. Treadmill and structured indoor training appear to be driving that divergence.
- Among runners, a 23% increase in users recording both a run and a strength session in the same week reflects a broader shift in how endurance athletes structure their training. The gym is increasingly treated as part of the programme rather than optional supplementary work.
- Geographically, South Korean users recorded the highest running activity volume per user of any country, leading across running, track running and treadmill categories. France led trail running. Italian cyclists recorded the highest average ride distance at 34.73 miles per ride, ahead of Belgium at 33.05 miles and Spain at 32.80 miles. The global average was 28.59 miles.
- The 50-59 age group ran the longest average distance per session, at 5.1 miles, ahead of the 40-49 age group at 5.02 miles and the 30-39 age group at 4.84 miles. The 20-29 group averaged 4.6 miles per run. Older runners run further per session; they simply do it more slowly.
- August was the peak month for both running and cycling activity. Saturdays were the most popular day for running, Sundays for cycling.
Interesting stuff. And, yes, some of these factoids are statements of the obvious. Obvious if you already know, of course.
Quick answers
What is a good VO2 max for a recreational cyclist or runner?
Among Garmin users in 2025, the average was 51 for cyclists and 50 for runners. Both sit in the good-to-excellent range. The meaningful comparison is against your own age and sex cohort rather than the global average. Full benchmark tables are in the VO2 max guide.
How many miles per week do I need to ride to improve my VO2 max?
Garmin’s data show improvement across every mileage band from 0-20 miles per week onward. There is no minimum threshold in the data, but the gains become more pronounced above 60 miles per week.
Why does my Garmin VO2 max drop in summer?
Heat elevates heart rate relative to pace. The algorithm reads this as reduced fitness and lowers the estimate accordingly. The number recovers once conditions cool and qualifying sessions re-establish a baseline.
This article is part of the site’s sports science reference for endurance athletes.
Last Updated on 3 October 2026 by tfk the5krunner
Small things I always use
- Garmin 90-degree charging adapter: Charges your Garmin from any USB-C cable. Essential when travelling. I use one.
- Body Glide: The blue anti-chafe stick swimmers and runners carry. I use it.
- Speedo earplugs: Fewer ear infections and no cold-water dizziness. I use them.
- Dryrobe Advance: My winter changing robe for open-water swims. I use one. A cheaper option is the AONYIYI changing robe.
- Maurten: Race fuel that stays easy on the stomach. I use them.
- Beet It Sport nitrate shots: Beetroot shots I take in the days before a race. I use them.
- Garmin charging puck: The quickest way to top up before a session. I use one.
- Injinji: Toe socks that stop rubbing, so you run more. I use them.
- Ultimate toe protectors: Stop black toenails on long runs. They work. I use them.
- Compressport R2 v2 calf sleeves: My calf sleeves of choice. I use them.
- Cellucor C4: My pre-workout before hard sessions.
- TPU tubes: Schwalbe Aerothan, Tubolito and Pirelli SmarTube. Light, tiny spares. I use all three.
- G8 insoles: Adjustable insoles that are good. I use them.
- Cycplus Cube: A 97g electric pump that gets a road tyre rideable in two minutes. I carry one. 5% off with code THE5KRUNNER.
Watches and sensors
- Polar H10: My daily driver for waking HRV.
- Polar Verity Sense: My backup arm-worn HR sensor.
- Nomad bedside charger: Charges my iPhone and Apple Watch overnight. I use it, and many of their bands.
- Train.Red: The best muscle oxygen sensor I’ve used.
- Tymewear: Accurate heart rate and reliable ventilatory zones. I use it to pace endurance rides over an hour.
- Garmin Forerunner 970: A pro-grade triathlon watch. I use this.
- Apple Watch Ultra 4: My daily smartwatch. No phone needed on rides.
- Garmin Fenix 9 Pro: I’ve just bought one.
On the bike
- Continental GP5000 for everyday riding, and Aero 111 on the front for special occasions.
- Helmets: Specialized S-Works Evade 3 for road riding, and Rudy Project Wing for TT-style races. I use both.
- Ravemen FR300: A front light that mounts under your Garmin or Wahoo. I use one.
- Wahoo TRACKR Radar: I use it on one bike and Varia on the other. They perform the same.
- Garmin Varia RTL515: Radar that warns you of cars from behind. I use this model.
- Wahoo ELEMNT Roam 3: The bike computer that’s easy to use. I use mine on most rides.
- Favero Assioma Pro RS2: Accurate power pedals that swap easily between bikes. I use this model.
Home and indoor training
- NPE Runn: Makes my basic treadmill smart, sending more accurate speed and distance to my watch and Zwift. I use it.
- Google Wifi: Keeps Zwift connected in my pain cave. I use it.
- Apple TV 4K: Zwift on the big screen. I use two.
- Google Nest Doorbell (wired, 2nd gen): My video doorbell, running in both Google Home and Apple Home. I use it.
Health, recovery and sleep
- FreeStyle Libre 3 Plus: Shows how my blood sugar responds to diet.
- hDrop: Measures my sweat loss in summer and indoors.
- Fourth Frontier Zone: Checks my heart under load in hard sessions.
- Oura Ring 5: My partner’s recovery tracker of choice.
- Eight Sleep: A cooling mattress cover my partner and I use nightly.
Reader-Powered Content

This content is not sponsored. It’s mostly me behind the labour of love, which is this site, and I appreciate everyone who supports it.
Support the site: Follow (free, fewer ads) · Subscribe (paid, ad-free) · Buy Me A Coffee
Written by real people, with AI assistance. Fact-checked and verified for originality. See the Editorial Policy. FTC: Affiliate Disclosure — some links pay commission. As an Amazon Associate, I earn from qualifying purchases.
tfk is the founder and author of the5krunner, an independent endurance sports technology publication. With 20 years of hands-on testing of GPS watches and wearables, and competing in triathlons at an international age-group level, tfk provides in-depth expert analysis of fitness technology for serious athletes and endurance sport competitors. See the gear tfk uses. ID

One thing I’ve noticed and that it’s usually glossed over, is the fact that the calculation is affected by weight.
I’ve had periods where I basically wasn’t running because of injury, so opted to do recovery like sauna (plasma increase) and kept my mouth shut (more shut than usual at least). Weight kept creeping down, after 1 month when I got back to running my VO2Max quickly increased. Then my weight kept creeping up and my gains went nowhere. 🫣
You can also noticed that, even when keep the runs more or less the same (pace/hr), weight changes will eventually reflect vo2max changes.
My hunch is that Garmin is looking at the weight trend, probably past week or so (the same metric that is used in the fitness age screen).
i’m pretty sure garmin will use some form of moving average weight. More than that IDK.
yes of course the metircs is absolutely grounded in weight…the units of measure end in per kg.
lose weight…increase vo2max
lose muscle…decrease vo2max
#dilemma
Yeah just to wanted to say that sometimes the “breakthrough” are really not because of increased fitness, but because you just happened to lose some weight relatively fast. In fact it seems that VO2Max tend to stabilize after a while, and then it’s really hard to make it move unless you sort of “game the system” be reducing the denominator. 😃
the key determinant must be how much quality muscle/mitochndria you’ve built up. it was hard to get it but perhaps easy to lose it through crazy dieting and not fuelling properly
liposunciton must be the easiest way to be guaranteed to boost vo2max overnight 😉
Cycling is a weird one on Garmin. I ride a 40 lb enduro mtb, and a 27 lb xc bike. Both are lumped into mountain bike.
indeed so! You can only get decent vo2max from cycling with a power meter, from running you need to know distance. (there are exceptions). with that info you can work out the work you are doing and hence vo2max can flow out from that
point being if you have a power meter on your bikes you should largely be able to work out a decent vo2max regardless of the bike type (with caveats)