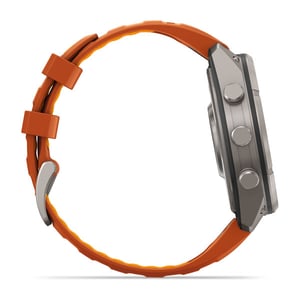
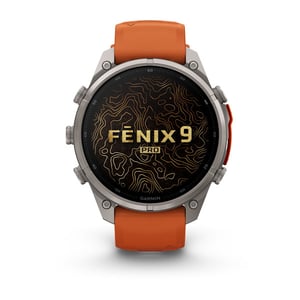
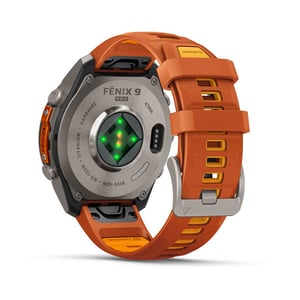
The Fenix 9 Pro currently tops the overall speed leaderboard on WristBench, a public Connect IQ benchmark for Garmin watches. Its overall score of 176 is the highest on record. The catch is that this result comes from just two submitted devices, so the site gives a confidence score of only 58 percent. But why is it fast?
We have already looked at what is physically different between the Fenix 9 and Fenix 9 Pro component by component. WristBench looks at whether any of that difference shows up as measurable speed and the potential causes.
In brief: how WristBench works and scores
Garmin owners install a free Connect IQ app, run four short tests, and submit the results to a public leaderboard at benchmark.wristtale.com. The leaderboard currently holds 524 submitted runs across 61 device groups.
WristBench runs four artificial tasks inside Connect IQ, so it’s not a hardware benchmark in the conventional sense.
- Logic pushes 1,000 integers through 256 passes of bitwise operations followed by a sort, timed in milliseconds. Lower is faster.
- Memory builds strings of characters, slices them repeatedly, and churns through 5,000 short-lived dictionary objects, timed in milliseconds. Lower is faster.
- Storage (I/O) writes, reads and deletes 500 small keys in the watch’s app storage, timed in milliseconds. Lower is faster. This measures the storage interface a Connect IQ app sees, not the watch’s raw flash speed, and it is not the same operation as Garmin’s native activity-save pipeline you experience at the end of workouts.
- UI draws 500 shapes and text elements per frame for five seconds and counts how many frames complete. Higher is faster. This is the closest of the four tests to general screen responsiveness, menus, data-screen transitions, watch face animation, but it does not test map rendering, a perennial bugbear for owners of every Garmin Fenix watch. A map involves loading tiles and routing data as well as drawing them, and WristBench does not touch that part of the pipeline.
Every result carries a confidence score, built from how many distinct devices contributed results (65 percent of the weighting), how consistent those results were (25 percent), and how many runs came back valid (10 percent). The Fenix 9 Pro’s 58 percent sits well below the leaderboard’s most trusted entries, which run past 90 percent on dozens of devices.
Fenix 9 Pro’s claim, by the numbers
| Test | Fenix 9 Pro result | Devices | Confidence |
|---|---|---|---|
| Overall average | 176 (highest on leaderboard) | 2 | 58% |
| Logic | not a category leader | 2 | 58% |
| Memory | not a category leader | 2 | 58% |
| UI | not a category leader | 2 | 58% |
The Fenix 9 Pro does not lead any individual test. Its overall average is highest because WristBench’s weighting favours memory and screen rendering, and the Fenix 9 Pro scores well across all four rather than leading in any one.
Screen rendering (UI), fastest 3
| Device | Frames rendered | Runs | Confidence |
|---|---|---|---|
| vívoactive 6 | 12 | 8 | 78% |
| Venu 4 (45mm / D2 Air X1) | 11 | 7 | 71% |
| Venu 4 (41mm) | 11 | 3 | 61% |
Logic (integer/sort), fastest 3
| Device | Time | Runs | Confidence |
|---|---|---|---|
| vívoactive 6 | 27,919 ms | 8 | 78% |
| Venu 4 (45mm / D2 Air X1) | 29,755 ms | 7 | 71% |
| Venu 4 (41mm) | 31,231 ms | 3 | 61% |
Memory, fastest 3
| Device | Time | Runs | Confidence |
|---|---|---|---|
| Forerunner 70 | 10,166 ms | 1 | 40% |
| Fenix E | 11,092 ms | 1 | 50% |
| Fenix 8 (43mm) | 11,118 ms | 2 | 56% |
Storage (I/O), fastest 3
| Device | Time | Runs | Confidence |
|---|---|---|---|
| Forerunner 170 | 18,991 ms | 2 | 48% |
| Forerunner 70 | 19,653 ms | 1 | 40% |
| Forerunner 955 / Solar | 21,804 ms | 32 | 93% |
Overall average, top 5 raw
| Device | Average score | Runs | Confidence |
|---|---|---|---|
| Fenix 9 Pro (47mm) | 176 | 2 | 58% |
| Venu X1 | 175 | 6 | 50% |
| Forerunner 265s | 170 | 6 | 76% |
| Venu 3 | 170 | 6 | 76% |
| Fenix 8 (43mm) | 170 | 2 | 56% |
Restricting the leaderboard to models with at least 15 submitted devices removes the Fenix 9 Pro from the picture entirely and gives a steadier answer that some prior-gen Forerunner owners will be pleased about:
Overall average, 15+ devices, top 5
| Device | Average score | Runs | Confidence |
|---|---|---|---|
| Forerunner 955 / Solar | 165 | 32 | 93% |
| Forerunner 265 | 161 | 54 | 83% |
| Forerunner 965 | 159 | 45 | 89% |
| Forerunner 255 | 156 | 62 | 95% |
| Fenix 7X / Tactix 7 / Quatix 7X Solar / Enduro 2 | 141 | 30 | 97% |
The Forerunner 955/Solar is the closest thing to a true answer for the fastest ever Garmin watch, backed by 32 devices and 93 percent confidence.
This site and plenty of Fenix 8 and Fenix 8 Pro owners have reported slow map panning, zooming and redraws, including on Garmin’s own forums, and those reports are real, current, and likely won’t change any time soon. WristBench cannot confirm or rule out that complaint, because its UI test never touches map data. Whether the Fenix 9 Pro fixes that in practice is a separate question this benchmark does not answer either, but early looks at zooming on the Fenix 9 show a 2-second lag, still noticeable, but a real improvement on the 10-second zooms/pans I saw on older Garmins.
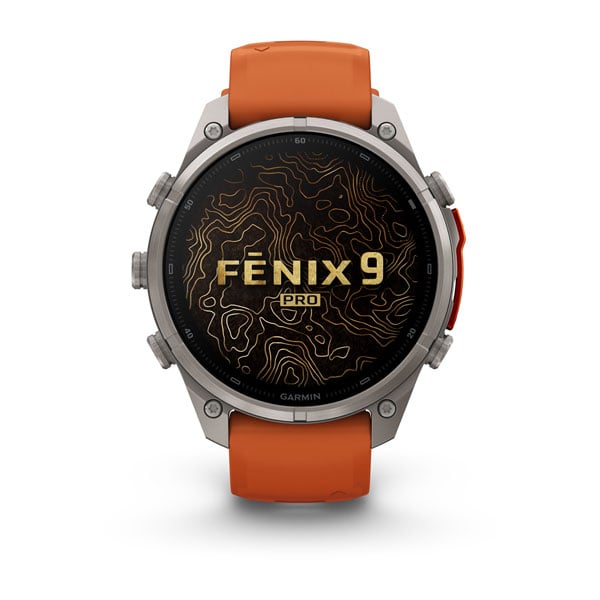
Garmin Fenix 9 range
Every Fenix 9 and Fenix 9 Pro model, including AMOLED, Solar, and inReach variants across all sizes. One link to the full range.

For the technically curious: how the score is actually calculated
WristBench does not just average four raw numbers. Each metric is normalised against a fixed baseline before it is weighted: Logic against 2,000ms, Memory against 3,500ms, I/O against 1,500ms, and UI against 60 frames.
Time-based metrics score as (Base Time / Actual Time) × 1000, so a watch that beats the baseline time scores above 1,000 on that metric. The UI metric inverts that logic, scoring as (Actual Frames / Base Frames) × 1000, since more frames rendered is better rather than less time taken. The four normalised scores then feed into the familiar weighting: Logic 25 percent, Memory 35 percent, UI 30 percent, I/O 10 percent.
The CPU-heavy Logic phase is deliberately sliced into short steps rather than run as one continuous block. Connect IQ’s watchdog will kill an app that blocks the runtime for too long in one pass, so WristBench breaks the workload up to keep the app responsive between slices. The timer, called via System.getTimer(), still spans the entire phase regardless of the slicing, so the elapsed time measured is unaffected.
The leaderboard does not trust client-submitted scores either. Each watch uploads raw metrics, logicMs, memoryMs, ioMs and uiFrames, and the server recalculates every component score and the final weighted score independently, using the same public formula. Results are then aggregated by Garmin model, averaged across every distinct device that submitted for that model, which is why a model with two submitted devices produces a much less stable average than one with thirty-two.
WristBench is unofficial, crowdsourced and still growing. Half of the 61 device groups on the leaderboard currently rest on five or fewer submitted devices, several on just one, and the Fenix 9 Pro is one of them. Every additional submitted device tightens the confidence score and either confirms or overturns the Fenix 9 Pro’s current lead, and the Quick answers below cover how to add one.
Garmin Fenix 9 range
Every Fenix 9 and Fenix 9 Pro model, including AMOLED, Solar, and inReach variants across all sizes. One link to the full range.
Quick answers
Is the Fenix 9 Pro really Garmin's fastest watch?
It holds the highest overall score on WristBench’s leaderboard, though that figure is built from only two watches and a 58 percent confidence score. The most reliably fast watch on the leaderboard, backed by a large sample, is the Forerunner 955/Solar.
Does WristBench test how fast Garmin maps load or pan?
No. Its UI test measures general screen drawing speed using shapes and text, not map tiles or routing data.
How do I add my own result to WristBench?
Install the WristBench app from the Connect IQ Store and submit a run at benchmark.wristtale.com.
Last Updated on 9 October 2026 by tfk the5krunner
Small things I always use
- Garmin 90-degree charging adapter: Charges your Garmin from any USB-C cable. Essential when travelling. I use one.
- Body Glide: The blue anti-chafe stick swimmers and runners carry. I use it.
- Speedo earplugs: Fewer ear infections and no cold-water dizziness. I use them.
- Dryrobe Advance: My winter changing robe for open-water swims. I use one. A cheaper option is the AONYIYI changing robe.
- Maurten: Race fuel that stays easy on the stomach. I use them.
- Garmin charging puck: The quickest way to top up before a session. I use one.
- Injinji: Toe socks that stop rubbing, so you run more. I use them.
- Ultimate toe protectors: Stop black toenails on long runs. They work. I use them.
- Compressport R2 v2 calf sleeves: My calf sleeves of choice. I use them.
- Cellucor C4: My pre-workout before hard sessions.
- TPU tubes: Schwalbe Aerothan, Tubolito and Pirelli SmarTube. Light, tiny spares. I use all three.
- G8 insoles: Adjustable insoles that are good. I use them.
- Cycplus Cube: A 97g electric pump that gets a road tyre rideable in two minutes. I carry one. 5% off with code THE5KRUNNER.
Watches and sensors
- Polar H10: My daily driver for waking HRV.
- Polar Verity Sense: My backup arm-worn HR sensor.
- Nomad bedside charger: Charges my iPhone and Apple Watch overnight. I use it, and many of their bands.
- Train.Red: The best muscle oxygen sensor I’ve used.
- Tymewear: Accurate heart rate and reliable ventilatory zones. I use it to pace endurance rides over an hour.
- Garmin Forerunner 970: A pro-grade triathlon watch. I use this.
- Apple Watch Ultra 4: My daily smartwatch. No phone needed on rides.
- Garmin Fenix 9 Pro: I’ve just bought one.
On the bike
- Continental GP5000 for everyday riding, and Aero 111 on the front for special occasions.
- Helmets: Specialized S-Works Evade 3 for road riding, and Rudy Project Wing for TT-style races. I use both.
- Ravemen FR300: A front light that mounts under your Garmin or Wahoo. I use one.
- Wahoo TRACKR Radar: I use it on one bike and Varia on the other. They perform the same.
- Garmin Varia RTL515: Radar that warns you of cars from behind. I use this model.
- Wahoo ELEMNT Roam 3: The bike computer that’s easy to use. I use mine on most rides.
- Favero Assioma Pro RS2: Accurate power pedals that swap easily between bikes. I use this model.
Home and indoor training
- NPE Runn: Makes my basic treadmill smart, sending more accurate speed and distance to my watch and Zwift. I use it.
- Google Wifi: Keeps Zwift connected in my pain cave. I use it.
- Apple TV 4K: Zwift on the big screen. I use two.
- Google Nest Doorbell (wired, 2nd gen): My video doorbell, running in both Google Home and Apple Home. I use it.
Health, recovery and sleep
- FreeStyle Libre 3 Plus: Shows how my blood sugar responds to diet.
- hDrop: Measures my sweat loss in summer and indoors.
- Fourth Frontier Zone: Checks my heart under load in hard sessions.
- Oura Ring 5: My partner’s recovery tracker of choice.
- Kineon MOVE+: Red light therapy for niggles. It works.
- Eight Sleep: A cooling mattress cover my partner and I use nightly.
Reader-Powered Content

This content is not sponsored. It’s mostly me behind the labour of love, which is this site, and I appreciate everyone who supports it.
Support the site: Follow (free, fewer ads) · Subscribe (paid, ad-free) · Buy Me A Coffee ❤️
Written by real people, with AI assistance. Fact-checked and verified for originality. See the Editorial Policy. FTC: Affiliate Disclosure — some links pay commission. As an Amazon Associate, I earn from qualifying purchases.
tfk is the founder and author of the5krunner, an independent endurance sports technology publication. With 20 years of hands-on testing of GPS watches and wearables, and competing in triathlons at an international age-group level, tfk provides in-depth expert analysis of fitness technology for serious athletes and endurance sport competitors. ID

My Fenix 8 51mm has an interminable ~2s lag to redraw on map pan and zoom. Surely the Fenix 9 does better than that or what is the point of the new hardware/software “map engine”.
i’ll tell you next week! vids i have seen are 2 secs. I think it depends on what overlays you use.
Ut thos ia just for Garmin watches. If you compate to Huawei, Apple or Samsung Garmin lags far far behind. The hedline is misleding.
I agree many other brands are faster. the headline is not misleading tho, it is quite clear.
you go deeper than me, thanks !
I know we’re talking about the 9 now, but reaslitcally there’s 0 reasons for me to switch from my 7 Pro.
Do you think Fenix 10 or maybe 11 are going to have Elevate Gen 6? I’m still waiting (hoping) for sweet (hydration), non invasive continous glucose monitoring and pulse spectroscopy, basically next gen sensors.
Thanks.
it must have gen 6 but im not sure you’d get those.
perhaps the smo2 leak (which will def NOT be on the watch) heralds a new gen of sensor for off the wrist wear. eg i would have thought hydration (see my hdrop review) would be better somewhere off the wrist where sweat might evaporate better. CGM wont come first to garmin so we need to see which chinese brand releases it first eg huawei (who have a BP launch coming soon based on leaks but that would use an inflatable cuff so not for sports)