Five zones on the watch, three in the body
A sports watch shows training load, recovery time, VO₂max, race predictions, and calorie counts, and it builds all of them from an age entered at setup and a wrist sensor. None of it is measured. Each figure rests on an estimate of where a threshold probably sits for someone of that age and fitness. For many runners the estimate lands close enough. For many others it is wrong by enough to distort every number below it, and the watch never says which group a runner falls into.
The three intensity ranges
Open any watch, and it shows five training zones. Two decades of product design have made that feel like biology. It is not. The body has three intensity ranges, divided by two thresholds. The same three appear whether the thresholds are found by lactate, by breathing or by critical-power testing (Jamnick et al., 2020).
The moderate range runs from rest up to the first threshold. Lactate is produced all the time, but it is cleared as fast as it is made, so blood lactate stays near resting levels. Oxygen uptake settles within two to three minutes. Most weekly mileage belongs here.
The heavy range sits between the two thresholds. Lactate rises and then holds at a higher level, oxygen uptake drifts up a second time, and it can take fifteen to twenty minutes to settle.
The severe range lies above the second threshold. Nothing settles. Oxygen uptake climbs towards maximum, lactate keeps building, and how long the effort lasts becomes the limit.
Why the watch shows five
Watches split the moderate range into zones one and two, and the heavy range into zones three and four. Zone five covers severe. Those splits are arithmetic rather than biology. Nothing measurable separates zone one from zone two. The line is there because cutting a percentage range into equal parts looks tidy on a screen, and because it gives coaches separate words for a recovery jog and a steady aerobic run.
Three different things get called zones: the three ranges in the body, Seiler and Kjerland’s three-zone training model, and the five zones on the watch. They share the same two thresholds, so they line up at the edges. One describes how to train, another describes what the body does, and the five-zone display sits furthest from the physiology. It is also the only one most runners ever see. A month with a lot of zone three might be a real problem. It might instead mean the watch put the zone two ceiling in the wrong place.
Where the 80/20 rule comes from
In Seiler’s polarised-training research, elite endurance athletes spent about eighty per cent of their training time in the moderate range, below the first threshold. Most of the rest sat above the second threshold, with little time in between. It is a pattern measured in one group of athletes, not a law of physiology.
The threshold terminology, sorted
Read widely on this topic and the initialisms multiply: LT1, LT2, VT1, VT2, MLSS, OBLA, GET, RCP, AeT, AnT. In 1985, Heck and colleagues counted nine threshold terms already in use, and the list has grown since (Heck et al., 1985). Beneath the terms there are two boundaries.
The lower boundary: LT1 and VT1
LT1, the first lactate threshold, is where blood lactate first rises above its resting level during a step test. VT1, the first ventilatory threshold, is the breathing equivalent. Breathing turns deeper and more rhythmic, and conversation is still possible. It marks the shift from burning mostly fat to burning fat and carbohydrate together. The two methods measure the same change and usually agree closely. This is the ceiling of genuinely easy running.
The upper boundary: LT2, VT2, and MLSS
Maximal lactate steady state, MLSS, is the hardest effort at which blood lactate still holds steady instead of climbing. It is the standard the other two are trying to approximate. Finding it takes several steady efforts on separate days. The answer depends on how long each step lasts, how much lactate rise the tester allows before calling it unsteady, and how often blood is taken, so two labs will not always agree (Beneke, 2003).
LT2 and VT2 are faster proxies. LT2 is usually read off a fixed lactate figure, and 4 mmol/L is the most common one (Heck et al., 1985), though that number is a convention rather than a constant. VT2, the respiratory compensation point, is where breathing turns heavy and speech collapses to a word or two at a time. Above it the body burns mostly carbohydrate, lactate builds quickly, and acidosis sets in.
The three do not land on the same line. In a study of 22 trained runners, Cerezuela-Espejo et al. found that a lactate rise of 3.0 mmol/L above baseline predicted VT2 well. MLSS matched a much smaller rise of about 1.0 mmol/L, and it sat between VT1 and VT2 rather than alongside VT2, where it is usually assumed to be. The upper boundary is a small target area rather than a single line, and LT2, VT2 and MLSS each aim at it from a different angle.
The anaerobic threshold problem
Different authors have attached the term anaerobic threshold to both boundaries, which is why athletes and coaches so often talk past each other. Wasserman argued in the 1970s that working muscle ran short of oxygen at higher intensities and produced lactate as a result. That idea shaped how a generation of coaches talked about going anaerobic. Lactate is now understood as a fuel the body makes all the time and uses as a signal. The oxygen-shortage explanation has gone, and Poole, Rossiter, Brooks and Gladden set out the fifty-year argument in The Journal of Physiology in 2021. The name survived the mechanism.
When a device or a training plan says threshold, it often fails to say which one it means, even though the two can be a long way apart in heart rate. Anchor a zone to the wrong one and easy runs become moderately hard, or threshold intervals turn into merely brisk ones. Our Garmin lactate threshold deep dive covers how Garmin’s Firstbeat engine estimates LTHR from the changing relationship between pace and heart rate, and why the estimate is only as good as the run behind it.
How to set your zones
Anchor the zones to lactate threshold heart rate, LTHR, rather than to maximum heart rate. LTHR sits near the upper boundary at LT2, VT2 and MLSS, not at the ceiling. It is the number that sets where the heavy range ends and the severe range begins.
The field test
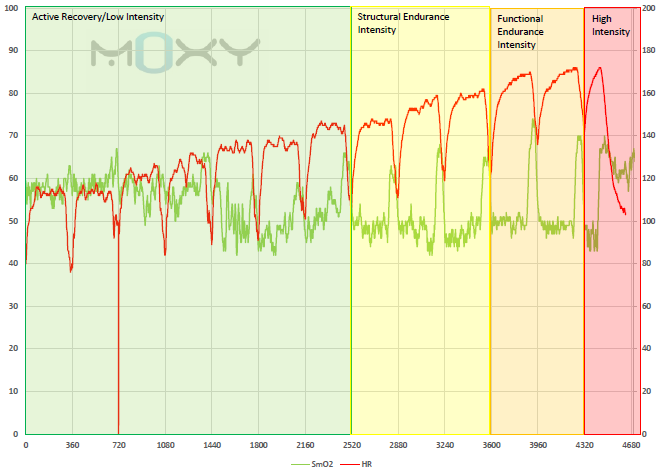
The most widely used field test is a thirty-minute time trial, made popular by the coach Joe Friel. Warm up for ten minutes at an easy jog. Run alone, not in a race and not with training partners, for thirty minutes at a hard, even effort, roughly 5K pace. Going out too fast and fading is the most common way to wreck the result. Use a track or a flat open road, because trails break the rhythm at every foot placement and a treadmill invites an easier effort. Hit the lap button ten minutes in, or split the file afterwards in training software. LTHR is the average heart rate over the final twenty minutes, not the full thirty.
A study of 27 competitive distance runners and triathletes tested four field methods against a lab lactate threshold: the thirty-minute time trial, VDOT, a 3,200-metre time trial and the Conconi test. Only the thirty-minute trial matched the lab result for both pace and heart rate, within 0.21 metres per second and 8.0 beats per minute (McGehee, Tanner and Houmard, 2005).
The test finds the second threshold and nothing else. Every zone below it is worked out as a percentage of that one figure, so the first threshold is never measured.
Zone percentages, built from LTHR
Friel’s zone system builds five zones from that number. These are the running figures; the bike version differs slightly.
- Zone 1: less than 85 per cent of LTHR
- Zone 2: 85 to 89 per cent of LTHR
- Zone 3: 90 to 94 per cent of LTHR
- Zone 4: 95 to 99 per cent of LTHR
- Zone 5a: 100 to 102 per cent of LTHR
- Zone 5b: 103 to 106 per cent of LTHR
- Zone 5c: more than 106 per cent of LTHR
Zones 1 and 2 sit in the moderate range, zones 3 and 4 in the heavy range, and zone 5 crosses into severe.
Retest cadence
LTHR moves as fitness changes, and a stale number spoils every zone built on it. Retest at the start of each training block, and every four to six weeks during hard training.
Karvonen and percent of max
Both methods below are shortcuts. They estimate the same two thresholds from population averages, without a field test. Neither measures a threshold.
Percent of maximum heart rate
This method divides the maximum into bands. The zone is maximum heart rate multiplied by the intensity percentage. It needs one number and works instantly, which is why most watches use it by default. It ignores resting heart rate completely. Two runners who both reach 185 bpm but rest at 42 and 74 bpm are given the same zones, despite 32 beats of difference in the range they can actually use.
The Karvonen method
Karvonen, Kentala and Mustala introduced heart rate reserve in 1957. Reserve is maximum heart rate minus resting heart rate. The target is reserve multiplied by the intensity percentage, with resting heart rate added back on. Run the same two athletes at seventy per cent and the gap reappears. The runner resting at 42 bpm gets a target near 142 bpm, and the runner resting at 74 bpm gets 152 bpm. That is ten beats of separation, from a number both runners already have.
The free Karvonen heart rate zone calculator turns a resting and maximum heart rate into the exact bpm targets.
Which method to use
Karvonen adds one individual number, so it errs by less. It still does not find anyone’s lactate or ventilatory thresholds. Researchers have compared these formulas against measured thresholds, and fixed percentages, heart rate reserve included, match individual thresholds poorly (Jamnick et al., 2020; Iannetta et al., 2020; Mann, Lamberts and Lambert, 2013).
Percent of max is fine for general health and fitness. For structured endurance training, use heart rate reserve where the device offers it. For serious racing, test LTHR and build the zones from that.
What breaks when the zones are wrong
Nearly every default setup starts from a maximum of 220 minus age. Robergs and Landwehr went looking for the research behind that equation in 2002 and found none. No study produced it. Their conclusion was blunt: the formula has no scientific merit for use in exercise physiology and related fields. Across the studies they reviewed, age-predicted maximum heart rate was out by 7 to 11 beats per minute. That is the typical error, not the worst case.
The dependency chain
Training load comes first. Watches weight time in each zone using EPOC or TRIMP models, and both take the zone boundaries as an input. On Firstbeat-powered Garmin devices, lactate threshold feeds straight into Training Status and Training Load, so an out-of-date threshold corrupts them directly.
Recovery time comes from training load, so it inherits the error and adds to it. VO₂max is read from the relationship between pace and heart rate, measured against the maximum. On Garmin’s algorithm the error also runs backwards: a bad VO₂max gives a bad threshold, which gives a bad training load and a bad recovery time. Calorie figures come from heart rate reserve and carry the same error again.
These numbers form a chain, and on at least one platform a loop. All of it hangs off one or two early assumptions. They move together, and they can all be confidently wrong at once. Manufacturers smooth the output, and the figures still work as trends over weeks. The mistake is reading a derived number as a measurement when it is an estimate built on an estimate.
What the formulas ignore
Running against cycling
Running carries body weight and uses more muscle. Cycling is seated and takes the weight, so the work falls on a smaller group of muscles, and the quadriceps fatigue first, before the heart and lungs reach their limit. Maximum and threshold heart rates on the bike therefore come out lower than they do running (Millet, Vleck and Bentley, 2009). Set zones separately for each sport, and expect the bike numbers to sit lower. The difference does not carry across everything: one study found that time to exhaustion at MLSS was much the same cycling and running (Fontana, Boutellier and Knöpfli-Lenzin, 2009).
Daily variation
Hold a steady effort long enough and heart rate climbs anyway. That is cardiovascular drift, caused by a steady fall in stroke volume that begins after ten to twenty minutes (Coyle and González-Alonso, 2001). Dehydration makes it worse. Heat and humidity raise heart rate at any given pace, which is why an easy August run can read as tempo work. Altitude does the same until the runner acclimatises. Sleep, tiredness, illness, caffeine and stress all move the number day to day. A common rule of thumb treats aerobic decoupling under five per cent across a steady effort as a sign of good aerobic fitness. That figure is a coaching convention, not a measured constant (Buchheit, 2014).
Sensor error
The formula is only one source of error. A watch-based threshold estimate usually lands within 5 to 10 beats per minute of a lab test in trained athletes. In untrained runners the error is larger, because the change from aerobic to anaerobic is less distinct. Wrist sensors add their own lag and noise on top, particularly at anything faster than steady running, which is why a chest strap is worth the trouble for intervals and for any threshold test.
What is replacing the guesswork
Thresholds can now be found during the session itself rather than guessed from age at setup. Suunto ZoneSense and the TymeWear VitalPro chest strap both read aerobic or anaerobic state live, instead of assuming where the threshold sits before the run starts. Neither replaces a lab test, but both show where zone-setting is going next.
Every number on the watch rests on where it thinks the thresholds sit. Test them, and the rest of the display becomes worth reading.
Written by Ethan of calculatemyheartrate.com. Edited by the5krunner.
Quick answers
How many heart rate training zones are there really?
A watch shows five, but the body has three intensity ranges divided by two thresholds. The five zones are an arithmetic split of those three ranges, made for a tidy display and for coaching language, rather than a set of separate biological events.
What is the difference between LT1 and LT2?
LT1 is the first lactate threshold, where blood lactate first rises above its resting level, and it marks the ceiling of genuinely easy running. LT2 sits at the upper boundary, near maximal lactate steady state, and it marks where the heavy range ends and the severe range begins.
Can I find my thresholds without a lab test?
A thirty-minute solo time trial gives a usable lactate threshold heart rate, taken as the average heart rate over the final twenty minutes. It finds the upper threshold only, but it anchors the zones to a real number rather than to age.
Should I test my lactate threshold in a lab?
A lab test is the most accurate option and it is worth it for serious racing. For most runners a well-run field test gets close enough, and the real gain comes from testing the threshold at all rather than working from an age-based maximum.
