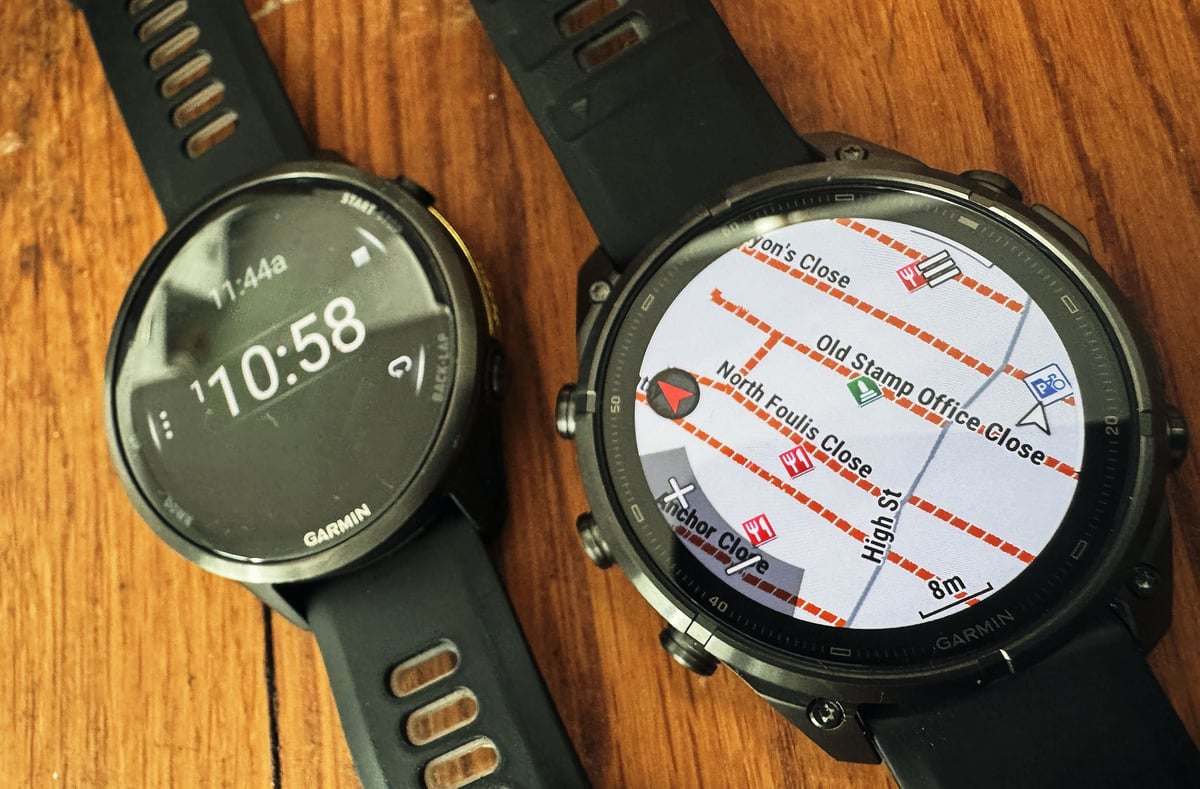
I’ve been testing the Fenix 9 Pro in preparation for a detailed review later in the month. It’s a nice watch, and for a thousand dollars/pounds it should be.
Two negative aspects immediately spring to mind that potential buyers need to be aware of. One is a speaker that can’t handle the intended (default) volume and sounds broken, though this probably isn’t new hardware, as previous models sounded similar to me. The other issue is the new, faster CPU and graphics engine, which is improved over the earlier one on the Fenix 8/8 Pro (technical deep dive here into the Fenix 9 / 9 Pro component changes) but still isn’t up to the job.
The article explores why it isn’t up to the job, with some test results, and I’ve also added results from Jerome at MontreCardio in France, who has been running similar tests.
Other Brands
On this site, I test all the sports watch brands on the market. In my testing, the current flagship adventure watches from Amazfit, Suunto, Apple, Coros and Polar all rendered a full map display very quickly: the Amazfit T-Rex Ultra 2, Suunto Vertical 2, Apple Watch Ultra 3, Coros Vertix 2S and Polar Grit X2 Pro all clear this test comfortably. The point is that technical solutions to lag exist, and Garmin isn’t using them.
Garmin Maps
Garmin has detailed maps. More than that, Garmin lets you add multiple overlays, like contours, weather and heatmaps. That’s much richer data than you get from the competition.
My working theory was that Garmin now has a modern graphics engine but was displaying much more data than the competition. Let’s see if that’s true, but also bear in mind that on-device caching may have sped up the performance I see here, and if you have the 51mm Fenix 9, its higher pixel count might further slow rendering.
Here are multiple, partly subjective speed tests covering many aspects of the Fenix 9 Pro’s interface.
Startup Time (cold Boot)
It takes 76 seconds for the Fenix 9 Pro to fully start up, including a map check.
Raise to wake watchface
This behaviour will vary by watchface. For the best-designed watchfaces, when the Always-On Display (AOD) is working, the screen dims when the wrist is turned away, and certain screen elements are disabled to save battery. When you twist your wrist to view, everything lights up, and the hidden screen elements are shown
Time: there is a very tiny lag, which is acceptable. I can’t measure how long it takes, but I’d estimate it at 0.1-0.2 seconds. Quick.
Press Start to enter menus and leave watchface
This is slower than the raise-to-wake movement. I would say it takes half a second.
Scrolling through main menus
This is 98% smooth. Occasionally, there is a slight jump when one menu item leaves the screen and another enters.
Choosing a Menu Option to show further options
This generally feels instant, but I did notice an almost 2-second delay going from Shortcuts to the list of shortcut options when first pressed.
Choosing a Sport Profile
With a choice of profiles showing on the screen, you choose one. The time it takes to display the particular sport profile’s start screen is about a second, sometimes longer, sometimes just under. This feels like a lag.
Exploring the profile and starting a workout
Exploring the profile seems almost lag-free. There is a minuscule lag when starting the workout itself. No different from before, and certainly better than something like the Apple Watch Ultra 3, where there is noticeable lag with the audible beep in what, after all, is one of the most important aspects of a sports watch’s performance: starting the workout correctly.
Discarding or saving a small workout
The end-of-workout behaviours from Garmin are market-leading in terms of the scope of the features offered. However, anyone who has owned a Garmin watch before will know that discarding or saving workouts takes seconds. That doesn’t appear to have changed.
- Discarding – takes 4-5 seconds
- Saving – varies depending on the length and complexity of the workout data.
- Takes two seconds for the stop button to translate to resume/save.
- Takes a further 4-5 seconds (minimum) to start displaying workout summary data
Map Performance
This is the area of most concern. Garmin map panning and zooming on previous-generation Fenix models was awful. Has it improved?
Fenix 7 and Fenix 8 owners have reported the same problem for years. Garmin’s own forums document Fenix 7 users flagging slow map scrolling, and Fenix 8 owners describing panning and redrawing as unusable in places, slower even than the older Epix 2. the5krunner documented the same problem on the Fenix 8 at launch, when full-screen map draws were taking up to 5 seconds.
I performed numerous tests and included four typical recordings for anyone who wants to dive deeper or see the experience they might encounter if they buy a Fenix 9 Pro. These cover every combination of zooming (layers vs no layers) and panning (layers vs no layers): watch the playlist here.
It’s worth understanding that Garmin’s default TOPO (topographic) maps, supplied free, comprise multiple map layers. Each layer has many square sections of vector map data, which are rendered separately, and there is a map layer for each zoom level. You could therefore expect more of a delay when zooming in or out, since that essentially loads a different map. When panning at the same zoom level, adjacent tiles from that level are loaded and displayed. Theoretically, these can be cached more easily, so when you pan, the watch has already anticipated where you might go and can serve those tiles quickly.
Garmin also supplies further special layers, like weather and the heatmap. These layers are overlaid on the map layer of the zoom level you’ve chosen. The more layers displayed simultaneously, the more information the watch has to load and display. At least that’s the theory.
Why Garmin’s Maps Are Slower to Render
Garmin’s built-in maps are vector-based, not like the pre-rendered image tiles used by some competitors. The watch draws roads, points of interest and contour lines live from raw map data every time you pan or zoom, rather than simply displaying a static picture. That’s more capable, and it’s part of why the data is so rich, but it’s also far more demanding on the processor.
Coros, by contrast, uses raster tile rendering: pre-rendered static images that the watch just displays. A discussion on Garmin’s own forums put it plainly: Coros’s approach is dramatically less CPU-intensive.
Hardware compounds the problem. According to a technical breakdown on Garmin’s forums, the Fenix, Epix and Enduro lines share a chip with just 5MB of onboard RAM, while the equivalent chip used by Coros, Suunto and Polar carries an extra 32MB module, for roughly 37MB total. That leaves Garmin’s watches with far less room to cache map data, so panning and zooming repeatedly forces the watch back to slower storage to redraw. The Fenix 9 Pro’s 50% RAM increase narrows that gap, but doesn’t close it, and it doesn’t change the underlying approach: real-time vector rendering will always ask more of the processor than displaying a static tile.
General findings are that:
- The most zoomed-out views take the longest to load.
- Enabling every special layer typically adds no more than one additional second to the rendering time.
- Tiles at the centre of the screen, the ones you’ll typically focus on first, are rendered almost immediately almost all the time.
- Peripheral tiles can take considerable time to load, sometimes up to 15 seconds (16 seconds with all special layers enabled).
Zoom tests were performed around a location on the map in London. Panning tests were performed in different areas of the map in Northern England and Scotland.
Map Zoom Tests
Zooming in typically takes about 3 seconds with layers enabled, though this can extend to 5 or 6 seconds. The central tiles on display always render immediately, and the last elements to display appear to be the additional layers.
Turning layers off typically saves about 1 second, though this varies. Even with layers off, zooming out fully can still take up to 15 seconds to redraw in some instances.
Map Pan Tests
With layers enabled, panning while zoomed out typically takes about 4 seconds, sometimes extending to 6. Zooming with layers enabled in the Scotland test areas was slightly faster than earlier, around 13 seconds.
With layers disabled, panning generally takes 0 to 3 seconds.
How Does This Compare to the Fenix 8 or Fenix 8 Pro?
Jerome at MontreCardio has run these Fenix 9 Pro vs Fenix 8 Pro comparisons. I’d encourage you to watch his video (French audio), and here’s a summary of his findings.
Menu navigation, route loading, weather overlay rendering, and activity stop-and-save timing were roughly identical on both watches. TopoActive zooming in and slow panning were faster on the Fenix 9 Pro, as was panning across shaded relief terrain, thanks to tile pre-loading. Shaded relief’s initial render was slightly faster on the Fenix 8 Pro, and post-activity stats loaded faster on the Fenix 8 Pro too. On the third-party MapRando map, the Fenix 9 Pro showed sharper detail at wide zoom levels, and small pans and recentering were significantly faster, again down to tile pre-loading. Both watches showed GPS drift while stationary over a 7-minute test in standalone GPS mode: 40m on one unit, 90m on the other.
Dave from Dave Does Fitness ran a similar side-by-side against his Forerunner 970 on launch day and reached the same conclusion, watching both watches scroll the same map and finding they load about the same time, despite Garmin’s claim of a more fluid new mapping engine.
Thoughts and Summary
Garmin has certainly improved the technology in the Fenix 9 Pro, and it is generally a superbly capable watch.
However, it’s an adventure watch, and adventurers typically buy this watch to use maps. As well as a sports tech company, Garmin is also a mapping company. Bearing those two things in mind, you would have thought that the mapping experience on a Garmin adventure watch would be second to none. In reality, it’s at the bottom of the pile.
Garmin says the Fenix 9 has 50% more RAM than the Fenix 8 and a new map engine, with panning up to 30% faster than the Fenix 8 and round-trip route calculation 40% faster than the Fenix 8 Pro. Neither claim matches what these tests show. Panning with layers enabled still takes up to 6 seconds, and peripheral map tiles can take up to 15 or 16 seconds to fully render.
Part of this can be explained by the richer map details Garmin displays, but many Garmin map rendering actions still feel to me like three, four, or five times slower than on competitor watches. The fundamental architecture is the problem; more memory helps, but the underlying mechanism of live, vector-based rendering will always be CPU-intensive and slow.
There is no quick fix.
Map lag is one of 94 problems owners have reported in the first month. Here is the full Fenix 9 bug list.
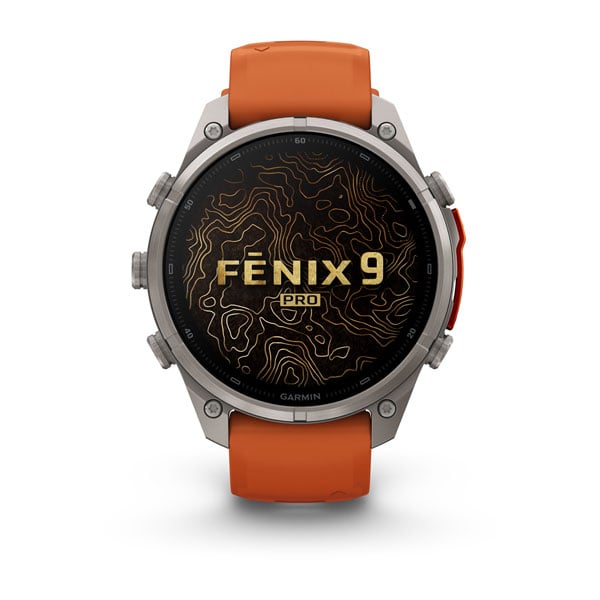
Garmin Fenix 9 range
Every Fenix 9 and Fenix 9 Pro model, including AMOLED, Solar, and inReach variants across all sizes. One link to the full range.

Quick answers
Does the Garmin Fenix 9 Pro have map lag?
Yes. Peripheral map tiles can take up to 15 to 16 seconds to render fully, particularly at wide zoom or with all layers enabled.
How long does the Garmin Fenix 9 Pro take to boot up?
A full cold boot, including a map check, takes 76 seconds.
Is Garmin's claimed 30% faster panning accurate in real-world testing?
Testing on this site and by MontreCardio shows mixed results rather than a consistent 30% improvement, with some map actions faster on the Fenix 9 Pro and others faster on the Fenix 8 Pro.
How does the Fenix 9 Pro's map speed compare to rivals?
The current flagship adventure watches from Amazfit, Suunto, Apple, Coros and Polar all render a full map display very quickly, comfortably ahead of the Fenix 9 Pro.
Last Updated on 8 October 2026 by tfk the5krunner
Small things I always use
- Garmin 90-degree charging adapter: Charges your Garmin from any USB-C cable. Essential when travelling. I use one.
- Body Glide: The blue anti-chafe stick swimmers and runners carry. I use it.
- Speedo earplugs: Fewer ear infections and no cold-water dizziness. I use them.
- Dryrobe Advance: My winter changing robe for open-water swims. I use one. A cheaper option is the AONYIYI changing robe.
- Maurten: Race fuel that stays easy on the stomach. I use them.
- Beet It Sport nitrate shots: Beetroot shots I take in the days before a race. I use them.
- Garmin charging puck: The quickest way to top up before a session. I use one.
- Injinji: Toe socks that stop rubbing, so you run more. I use them.
- Ultimate toe protectors: Stop black toenails on long runs. They work. I use them.
- Compressport R2 v2 calf sleeves: My calf sleeves of choice. I use them.
- Cellucor C4: My pre-workout before hard sessions.
- TPU tubes: Schwalbe Aerothan, Tubolito and Pirelli SmarTube. Light, tiny spares. I use all three.
- G8 insoles: Adjustable insoles that are good. I use them.
- Cycplus Cube: A 97g electric pump that gets a road tyre rideable in two minutes. I carry one. 5% off with code THE5KRUNNER.
Watches and sensors
- Polar H10: My daily driver for waking HRV.
- Polar Verity Sense: My backup arm-worn HR sensor.
- Nomad bedside charger: Charges my iPhone and Apple Watch overnight. I use it, and many of their bands.
- Train.Red: The best muscle oxygen sensor I’ve used.
- Tymewear: Accurate heart rate and reliable ventilatory zones. I use it to pace endurance rides over an hour.
- Garmin Forerunner 970: A pro-grade triathlon watch. I use this.
- Apple Watch Ultra 4: My daily smartwatch. No phone needed on rides.
- Garmin Fenix 9 Pro: I’ve just bought one.
On the bike
- Continental GP5000 for everyday riding, and Aero 111 on the front for special occasions.
- Helmets: Specialized S-Works Evade 3 for road riding, and Rudy Project Wing for TT-style races. I use both.
- Ravemen FR300: A front light that mounts under your Garmin or Wahoo. I use one.
- Wahoo TRACKR Radar: I use it on one bike and Varia on the other. They perform the same.
- Garmin Varia RTL515: Radar that warns you of cars from behind. I use this model.
- Wahoo ELEMNT Roam 3: The bike computer that’s easy to use. I use mine on most rides.
- Favero Assioma Pro RS2: Accurate power pedals that swap easily between bikes. I use this model.
Home and indoor training
- NPE Runn: Makes my basic treadmill smart, sending more accurate speed and distance to my watch and Zwift. I use it.
- Google Wifi: Keeps Zwift connected in my pain cave. I use it.
- Apple TV 4K: Zwift on the big screen. I use two.
- Google Nest Doorbell (wired, 2nd gen): My video doorbell, running in both Google Home and Apple Home. I use it.
Health, recovery and sleep
- FreeStyle Libre 3 Plus: Shows how my blood sugar responds to diet.
- hDrop: Measures my sweat loss in summer and indoors.
- Fourth Frontier Zone: Checks my heart under load in hard sessions.
- Oura Ring 5: My partner’s recovery tracker of choice.
- Eight Sleep: A cooling mattress cover my partner and I use nightly.
Reader-Powered Content

This content is not sponsored. It’s mostly me behind the labour of love, which is this site, and I appreciate everyone who supports it.
Support the site: Follow (free, fewer ads) · Subscribe (paid, ad-free) · Buy Me A Coffee ❤️
Written by real people, with AI assistance. Fact-checked and verified for originality. See the Editorial Policy. FTC: Affiliate Disclosure — some links pay commission. As an Amazon Associate, I earn from qualifying purchases.

tfk is the founder and author of the5krunner, an independent endurance sports technology publication. With 20 years of hands-on testing of GPS watches and wearables, and competing in triathlons at an international age-group level, tfk provides in-depth expert analysis of fitness technology for serious athletes and endurance sport competitors. ID

Very in-depth article and I agree that Vector Maps are more demanding buy this Is not an excuse for selling a device that at best its only twice as expensive and :
– No additional RAM ( likes competitors) Just keep a puny 7.5 RAM
– Same ancient,buggy and inexplicabily laggy interfacce
– No new sensors (come on some competitors its bene years that offers passive afib) probably still poor sleep tracking
– floored that they still hasnt manager to have a decent speaker likes other waterproof competitors..) on my F8 it’s so poor that im struggling to find a reason to keep It a Daily driver….
– i finish this tirade saying that amazfit ,while the routing function has a lot to improve ( probably the team must be 1/100 Garmins) ,their Maps are Vector rendered likes Garmin but the responsiveness and smoothness it’s way better because belive or not , they use a way way more up to date and faster processor and more than 10x the RAM (96MB) and still keeping interesting battery life because the actually put a decent sized battery on a device that a fraction of the cost.
Keeping ram powered is incredibly expensive from a battery perspective. Garmin aren’t keeping the ram down because they’re cheap or their engineers are idiots, they’re doing it as a tradeoff being longevity and performance.
It would be interesting to see a comparison between AMOLED and MIP solar (a lot less pixels to update)
With all these issues and Garmin’s crazy pricing, somehow we still keep buying them 😅
I was seriously considering COROS, but after the recent bricking issue and how they initially handled it… I guess I’ll keep paying the Garmin tax for now 😞
One question: how does the Fenix 9 compare to the Fenix 8 when actually following a preloaded course on trails? That’s my main use case — load a route and follow it, without much manual panning/zooming. Does the faster hardware make any noticeable difference there?
i’ll test that at some point. for now i’d look at MontreCardio’s tests Jerome would probably have done that exact comparison
So far, we’ve only seen reviews of the Fenix 9 Pro AMOLED, which seems to be a bit faster at rendering maps compared to the Fenix 8.
However, there are no tests yet for the 9 Pro SOLAR version with its MIPS display. I’d love to know if that performance boost is noticeable there as well, or if the screen technology itself acts as the bottleneck.
Thanks!
Not got any issues with lag, coming from the Fenix 8.
Just completed a 30km hike with the Fenix 9 Pro 51mm.
Extremely impressed. Best navigation experience I’ve had on the Garmin platform after many years of frustration with the company’s past top watches.
The mapping experience feels noticeably more reliable and snappy overall. Turn vibration notifications actually happen at the right time and panning and zooming is reasonably good too (but can be further improved);
The watch was super stable too bar some strange vibrations happening every 10 minutes in the background (not alert related, verified it);
GPS and altimeter performance were also excellent, as expected. strava.app.link/1n2TLMj5b6b
Separately, the map on my watch had significantly more detail than my mate’s Fenix 8.
I think Garmin had a winner with the 945 LTE and then lost their way. GARMIN GIVE ME A RUNNING WATCH THAT I CAN TXT/CALL FROM! I want a running watch with all the details stats, can play music without a phone, and can receive calls from my spouse if the kids are giving her crap and she wants me to come home. Or I can call EMS if my 40+ year old knees blowout. I don’t need an archery activity or a titanium case. Give me whatever display will last a week between charges and I am good. The fact that Garmin has ignored this for 5 years is ridiculous. I don’t want to wear a pixel watch or an apple watch, but they can do all this without the week long battery and cost hundreds less. I just don’t understand what Garmin is thinking, but a lot of running buddies want to abandon their phones for runs. Adding LTE is all you need to do Garmin!