Biological age is an appealing idea because it turns a complicated question into one number. Feed an app enough biomarkers, and it can tell a 42-year-old that their body is supposedly 35. A single number can hide more than it reveals.
Someone can have excellent cardiovascular fitness but poor glucose control. They can be lean but weak. They can exercise every day and still spend most of the rest of the day sedentary. Collapsing all of that into one age implies that very different dimensions of health are interchangeable.
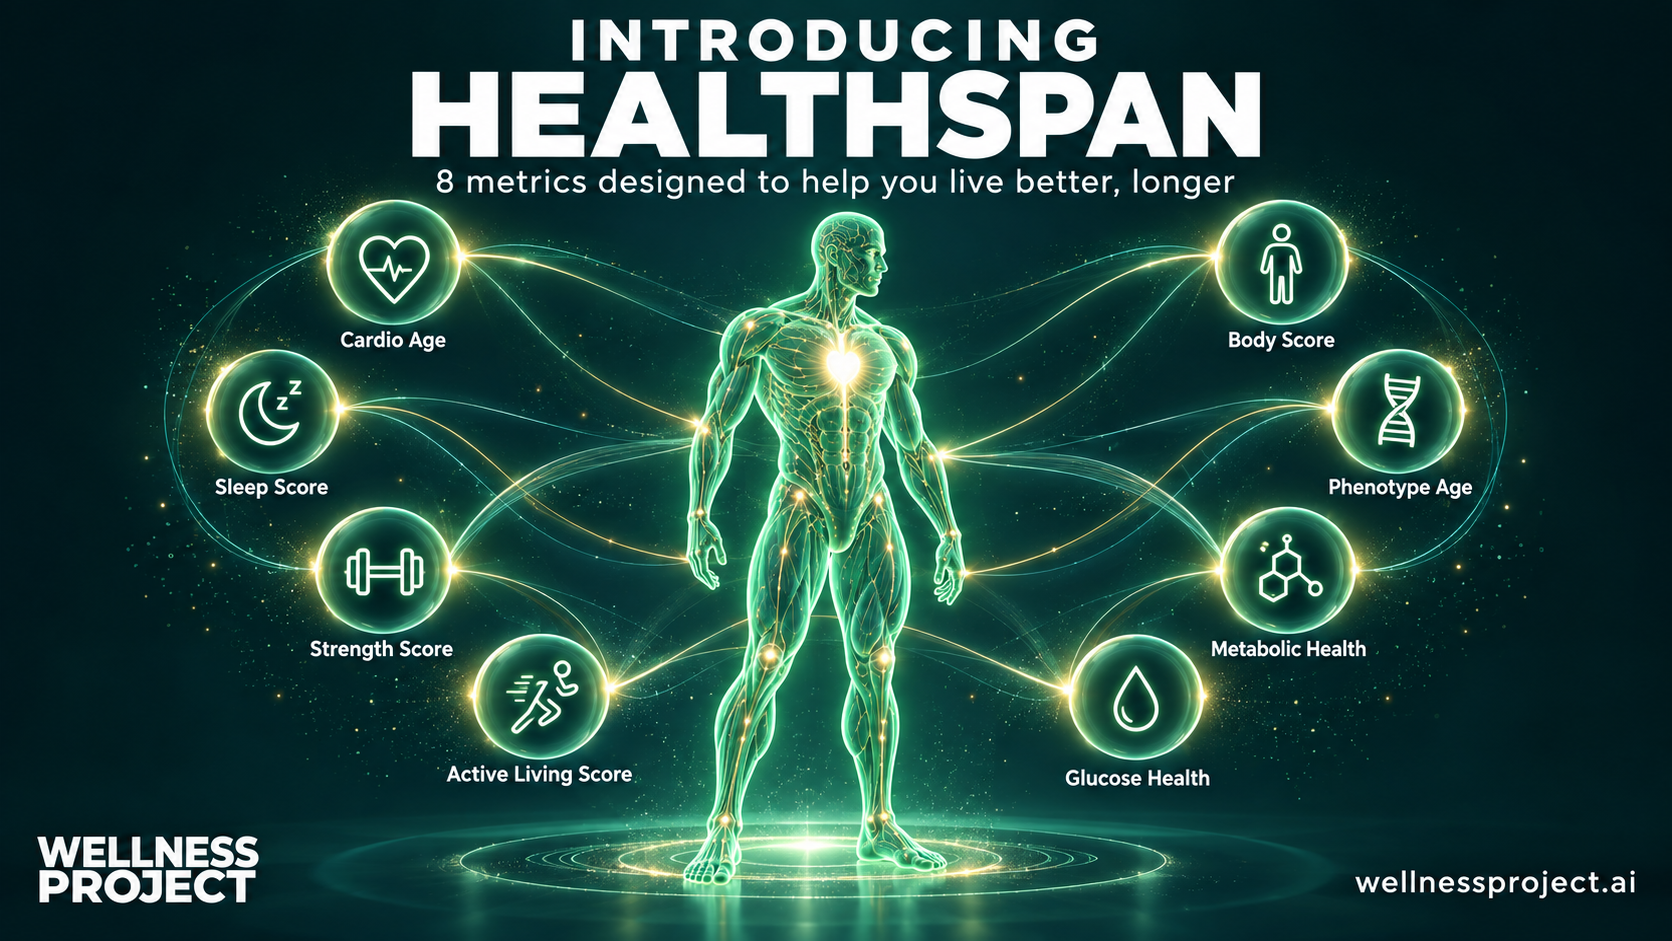
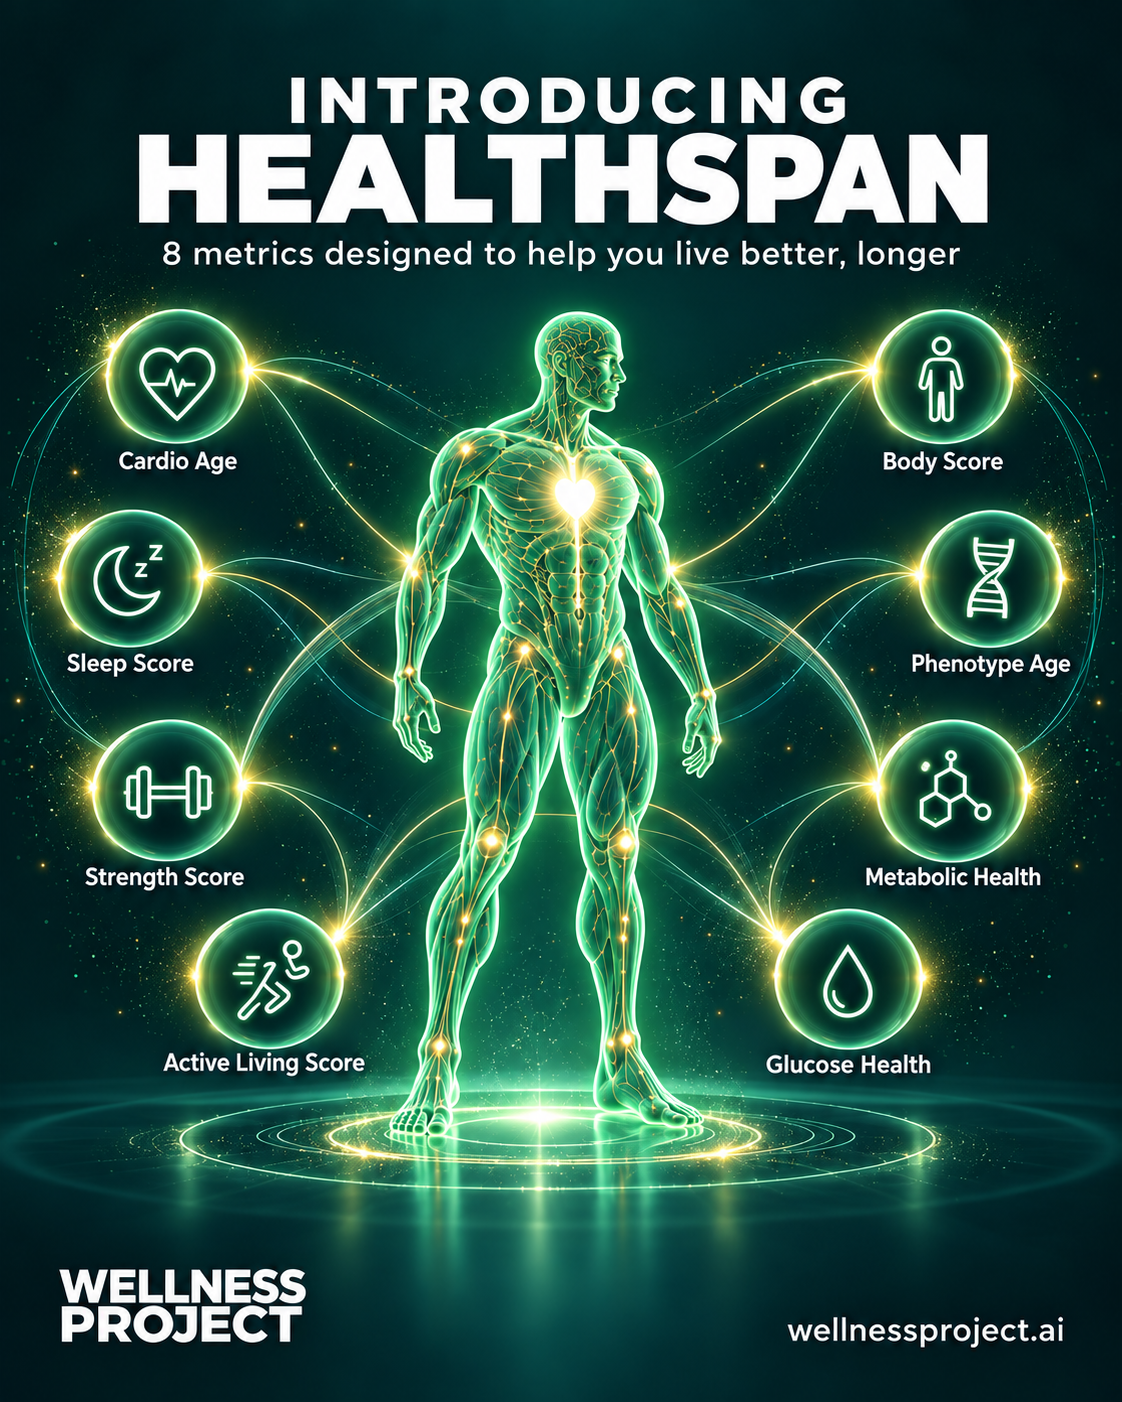
Wellness Project built Healthspan around the opposite idea. Healthspan keeps eight areas separate: Cardio Age, Strength Fitness, Active Living, Sleep, Body Composition, Phenotypic Age, Metabolic Health and Glucose Health.
Each factor shows the measurements behind it, how confident Wellness Project is in the result, and the methodology or research used to interpret it. A factor without enough reliable data stays unassessed and does not quietly become a bad score.
How Healthspan works
TL;DR: Healthspan evaluates eight dimensions of long-term health independently. It uses the wearable, training, body, and laboratory data a person already has, shows the inputs behind every result, and doesn’t penalise missing data.
There is little separate setup. A user connects existing wearables and training services to Wellness Project, which runs on iOS, Android and the web. Body measurements can come from a connected scale or be entered manually, and laboratory reports can be imported when they are available.
Healthspan then uses whatever credible data already exists. The report is useful before all eight factors are populated.
Cardio Age
Cardio Age is based mainly on cardiorespiratory fitness, particularly VO2 max when available, interpreted against age and sex references. Resting heart rate and other cardiovascular context can contribute to the interpretation.
Strength Fitness
Strength Fitness uses resistance-training history across the major movement patterns. Wellness Project estimates strength from logged sets and normalises it, so performance is read in context and not as an isolated bench press or squat number.
Active Living
Active Living looks across a 28-day window at movement volume, activity load and how activity is spread through the day. A completed workout does not mean somebody is active during the other 15 waking hours.
Sleep
Sleep combines sleep quantity with regularity over time, so one good or bad night is not treated as representative.
Body Composition
Body Composition uses the available weight, body-fat, fat-free-mass and waist information, and keeps the uncertainty around consumer body-composition measurements visible.
The three bloodwork factors
The remaining three factors use bloodwork. Phenotypic Age implements the published PhenoAge method. Metabolic Health uses markers such as the triglyceride-glucose index and, when inputs are available, HOMA-IR. Glucose Health interprets HbA1c and eligible glucose measurements.
Data quality and health interpretation are kept separate throughout. A provisional result is not the same thing as a poor result.
Worked example: a real eight-factor report
Bryan Barash, the founder of Wellness Project, used his own account for this example, not idealised demo numbers.
Cardio Age: 28
A Fitbit VO2 max of 46.9 ml/kg/min, roughly the 78th percentile for the relevant reference group, was the strongest input. Resting heart rate was 65 bpm, with recent HRV around 10% above his own baseline. The factor was favourable, but confidence remained moderate because the estimate came from a wearable, not a laboratory VO2 test.
Strength Fitness: 163.2
The strength factor used repeated resistance-training data, not a single lift. The underlying movement-pattern anchors were 205.5 for push, 187.5 for hip, 145.4 for knee and 114.3 for pull. There was no qualifying overhead lift yet, and the report showed that gap instead of silently estimating it.
Active Living: 78
The 28-day view showed 9,235 steps per day, a movement-volume score of 93, an activity load of 81, a movement distribution of 51 and roughly 4.2 active daytime hours. The overall picture was good, but the distribution score showed room to spread movement more evenly through the day.
Sleep: 87
Fourteen Fitbit nights averaged 7.1 hours of sleep and a sleep-regularity value of 78. Wellness Project does not claim that a score of 87 is a clinically validated sleep endpoint. The score makes the underlying behaviour legible and shows where the interpretation comes from.
Body: 100
The report used a weight of 163.4 lb (74.1 kg), 13.5% body fat, a Fat Mass Index of 3.0 kg/m², a Fat-Free Mass Index of 19.2 kg/m² and a 33.5-inch (85 cm) waist at six feet tall, giving a waist-to-height ratio of about 0.47. Confidence was moderate because consumer devices do not report every body-composition metric reliably enough to treat them as interchangeable.
Phenotypic Age: 33.9
Phenotypic Age was about nine years below Bryan’s chronological age. It differs from the other seven factors because it is a published biological-age estimate. The calculation uses chronological age together with albumin, creatinine, glucose, C-reactive protein, mean cell volume, red-cell distribution width, alkaline phosphatase, white-blood-cell count and lymphocyte percentage.
The result was marked provisional. Bryan’s newest panel did not include lymphocyte percentage, so the report flagged that limitation and used an older value from April 2025.
Metabolic Health: TyG 7.708
The triglyceride-glucose index came from fasting triglycerides of 50 mg/dL and glucose of 89 mg/dL. The result was favourable and high confidence because the necessary fasting inputs were available.
Glucose Health: 93.3
Glucose Health used an HbA1c of 5.1% together with glucose of 89 mg/dL, producing a high-confidence result.
None of the eight numbers replaces the others. The report shows a Cardio Age of 28 alongside a movement-distribution score of 51, a contrast one combined age would hide.
One record across every device
Health information rarely lives in one place. At the time of writing, Wellness Project has 14 direct integrations feeding one health record:
- Apple Health
- Google Health Connect
- Fitbit, through the Google Health API
- Oura
- WHOOP
- Ultrahuman
- Withings
- Polar
- Wyze Scale
- Hevy
- Liftosaur
- Lyfta
- Gravl
- Cronometer
Ultrahuman can also contribute continuous-glucose data from its M1 platform. Other brands arrive through the system-level health stores: Samsung Health, Garmin and Amazfit can pass supported data through Apple Health or Health Connect.
When two devices report the same category, users can set a Data Source Priority independently for activity, sleep, heart and recovery, body composition and nutrition.
The record extends beyond wearables. Wellness Project supports data across 18 categories, including labs, supplements, injuries, menstrual-cycle information and wellbeing. The AI assistant reasons from that longitudinal record instead of answering a generic question about VO2 max or sleep.
Wellness Project says it encrypts health data in transit and at rest and does not sell users’ health data. Users can export their information or delete account data at any subscription level. AI connections receive only the categories the user authorises and can be disconnected from Settings.
What the research says
No single clinical trial validates Wellness Project Healthspan as an eight-factor medical endpoint. The evidence sits under the individual measurements, not the combined number.
- Cardio Age uses age-aware and sex-aware VO2 max references, including the FRIEND registry.
- Strength Fitness builds on established one-repetition-maximum methods, including work associated with Epley, Lander and Brzycki, alongside strength-normalisation literature. The combined Strength Fitness score is a product interpretation and not a validated mortality equation.
- Active Living draws on research into daily steps, physical activity and sedentary behaviour, but the combined activity score is Wellness Project’s own way of organising those signals.
- Sleep regularity is a product-defined measure of sleep timing and consistency. It is not the published Sleep Regularity Index and does not carry that metric’s outcome estimates.
- Body Composition uses established literature on waist-to-height ratio, Fat Mass Index and Fat-Free Mass Index, including work associated with Ashwell and Gibson, VanItallie and Schutz.
- Phenotypic Age implements the published Levine PhenoAge calculation and is not a Wellness Project formula.
- Metabolic Health uses the Guerrero-Romero triglyceride-glucose index and Matthews HOMA-IR when the required inputs are available.
- Glucose Health uses HbA1c and glucose research, including the work connecting HbA1c with estimated average glucose, together with established clinical reference ranges.
Every factor has limitations. Wearable VO2 max is not a metabolic-cart test. Consumer body-fat estimates are imperfect. Workout logs are only as complete as the workouts recorded. Sleep stages from wearables are estimates, and laboratory biomarkers change over time. The report exposes those limitations instead of hiding them behind a decimal point.
Pricing and access
Wellness Project has a Free Basic tier with unlimited logging and wearable connections.
Founder Pro costs $4.99 per month or $39.99 per year until 15 October. After the founder period, the standard price is $9.99 per month or $99.99 per year, and an active founder subscription keeps the founder rate.
The first useful Healthspan report starts a 14-day window before you need a subscription. After that window, Founder Pro keeps the report live and updating with trends. Free Basic keeps the existing snapshot and all the underlying health data.
More: Wellness Project Healthspan
Quick answers
What happens if some Healthspan data is missing?
The data stays missing. A factor with too little reliable information is shown as unassessed and isn’t counted as an unfavourable result. In other cases, Wellness Project gives a provisional or lower-confidence interpretation and explains what is missing.
What research is behind the Healthspan results?
The research depends on the factor. Cardio Age draws on FRIEND and VO2 max reference research; Strength Fitness on established 1RM methods; Body Composition on FMI, FFMI, and waist-to-height literature; and Phenotypic Age on Levine PhenoAge. Metabolic Health uses TyG and HOMA-IR, and Glucose Health uses HbA1c research and clinical reference ranges. Active Living and sleep regularity are Wellness Project’s own interpretations of published activity and sleep research. The eight-factor report as a whole is not presented as a clinically validated mortality or lifespan model.
How is Healthspan different from a biological-age score?
Phenotypic Age is already one of the eight factors, and Healthspan doesn’t average it with cardiovascular fitness, strength, sleep, and metabolism to produce another age. Someone can see that their cardiovascular fitness looks excellent while movement distribution or a metabolic marker needs attention.
Which wearables work with Wellness Project Healthspan?
Wellness Project connects directly to Apple Health, Google Health Connect, Fitbit, Oura, WHOOP, Ultrahuman, Withings and Polar, plus six scale, strength and nutrition apps. Garmin, Samsung Health and Amazfit data can arrive through Apple Health or Health Connect.
Related reading
- Cinder: an Apple Watch recovery app that shows its calculations
- Vitara: Apple Health trends, HRV context and workouts in one dashboard
- SportVitals: transparent training load and HRV for Apple Watch
Author: Bryan Barash, founder of Wellness Project; edited by the5krunner.
Last Updated on 2 October 2026 by the5krunner
Small things I always use
- Garmin 90-degree charging adapter: Charges your Garmin from any USB-C cable. Essential when travelling. I use one.
- Body Glide: The blue anti-chafe stick swimmers and runners carry. I use it.
- Speedo earplugs: Fewer ear infections and no cold-water dizziness. I use them.
- Dryrobe Advance: My winter changing robe for open-water swims. I use one. A cheaper option is the AONYIYI changing robe.
- Maurten: Race fuel that stays easy on the stomach. I use them.
- Garmin charging puck: The quickest way to top up before a session. I use one.
- Injinji: Toe socks that stop rubbing, so you run more. I use them.
- Ultimate toe protectors: Stop black toenails on long runs. They work. I use them.
- Compressport R2 v2 calf sleeves: My calf sleeves of choice. I use them.
- Cellucor C4: My pre-workout before hard sessions.
- TPU tubes: Schwalbe Aerothan, Tubolito and Pirelli SmarTube. Light, tiny spares. I use all three.
- G8 insoles: Adjustable insoles that are good. I use them.
- Cycplus Cube: A 97g electric pump that gets a road tyre rideable in two minutes. I carry one. 5% off with code THE5KRUNNER.
Watches and sensors
- Polar H10: My daily driver for waking HRV.
- Polar Verity Sense: My backup arm-worn HR sensor.
- Nomad bedside charger: Charges my iPhone and Apple Watch overnight. I use it, and many of their bands.
- Train.Red: The best muscle oxygen sensor I’ve used.
- Tymewear: Accurate heart rate and reliable ventilatory zones. I use it to pace endurance rides over an hour.
- Garmin Forerunner 970: A pro-grade triathlon watch. I use this.
- Apple Watch Ultra 4: My daily smartwatch. No phone needed on rides.
- Garmin Fenix 9 Pro: I’ve just bought one.
On the bike
- Continental GP5000 for everyday riding, and Aero 111 on the front for special occasions.
- Helmets: Specialized S-Works Evade 3 for road riding, and Rudy Project Wing for TT-style races. I use both.
- Ravemen FR300: A front light that mounts under your Garmin or Wahoo. I use one.
- Wahoo TRACKR Radar: I use it on one bike and Varia on the other. They perform the same.
- Garmin Varia RTL515: Radar that warns you of cars from behind. I use this model.
- Wahoo ELEMNT Roam 3: The bike computer that’s easy to use. I use mine on most rides.
- Favero Assioma Pro RS2: Accurate power pedals that swap easily between bikes. I use this model.
Home and indoor training
- NPE Runn: Makes my basic treadmill smart, sending more accurate speed and distance to my watch and Zwift. I use it.
- Google Wifi: Keeps Zwift connected in my pain cave. I use it.
- Apple TV 4K: Zwift on the big screen. I use two.
- Google Nest Doorbell (wired, 2nd gen): My video doorbell, running in both Google Home and Apple Home. I use it.
Health, recovery and sleep
- FreeStyle Libre 3 Plus: Shows how my blood sugar responds to diet.
- hDrop: Measures my sweat loss in summer and indoors.
- Fourth Frontier Zone: Checks my heart under load in hard sessions.
- Oura Ring 5: My partner’s recovery tracker of choice.
- Kineon MOVE+: Red light therapy for niggles. It works.
- Eight Sleep: A cooling mattress cover my partner and I use nightly.
Reader-Powered Content

This content is not sponsored. It’s mostly me behind the labour of love, which is this site, and I appreciate everyone who supports it.
Support the site: Follow (free, fewer ads) · Subscribe (paid, ad-free) · Buy Me A Coffee ❤️
Written by real people, with AI assistance. Fact-checked and verified for originality. See the Editorial Policy. FTC: Affiliate Disclosure — some links pay commission. As an Amazon Associate, I earn from qualifying purchases.
tfk is the founder and author of the5krunner, an independent endurance sports technology publication. With 20 years of hands-on testing of GPS watches and wearables, and competing in triathlons at an international age-group level, tfk provides in-depth expert analysis of fitness technology for serious athletes and endurance sport competitors. ID
