CycleLytic: Terrain-Honest Cycling Analytics That Answer “Am I Getting Faster?”
You finish a ride, glance at your average speed, and try to read the tea leaves. Faster than last week, progress? Slower, a bad day, or just a hillier route? For most riders, the honest answer is: you can’t tell. Average speed blends every gradient into one number, and that number moves as much with the terrain you happened to ride as with your fitness.
And speed is only half the question. The same blur hides whether the effort itself is improving: your power, your heart rate, the quality of the workout.
CycleLytic is a small, independent tool built to fix exactly that.
The problem: same average, different ride
A flat 20-miler and a mountainous 20-miler can post identical average speeds and trend lines, even though one is a recovery spin and the other is the hardest ride of your month. So the most basic question a cyclist asks, “am I getting faster on this terrain?”, gets a misleading answer every time terrain enters the mix.
Ride flatter routes for a few weeks, and your average climbs: you look fitter without being fitter. Add hills, and it drops: you look worse while actually getting stronger. The number lies quietly in both directions.
How CycleLytic works
TL;DR: CycleLytic connects to your ride history and sorts every ride by how much you climb per mile, so it compares flat-to-flat and climb-to-climb rather than averaging it all.
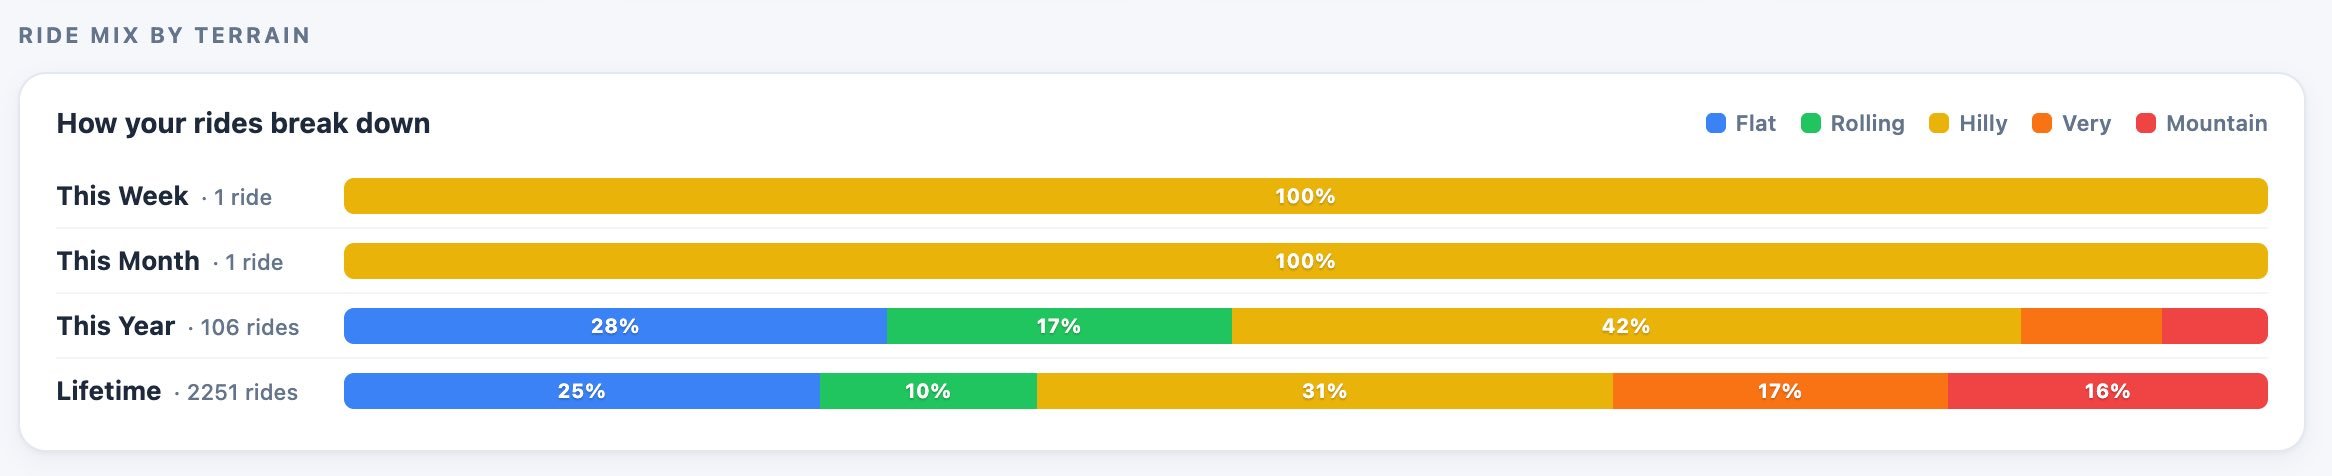
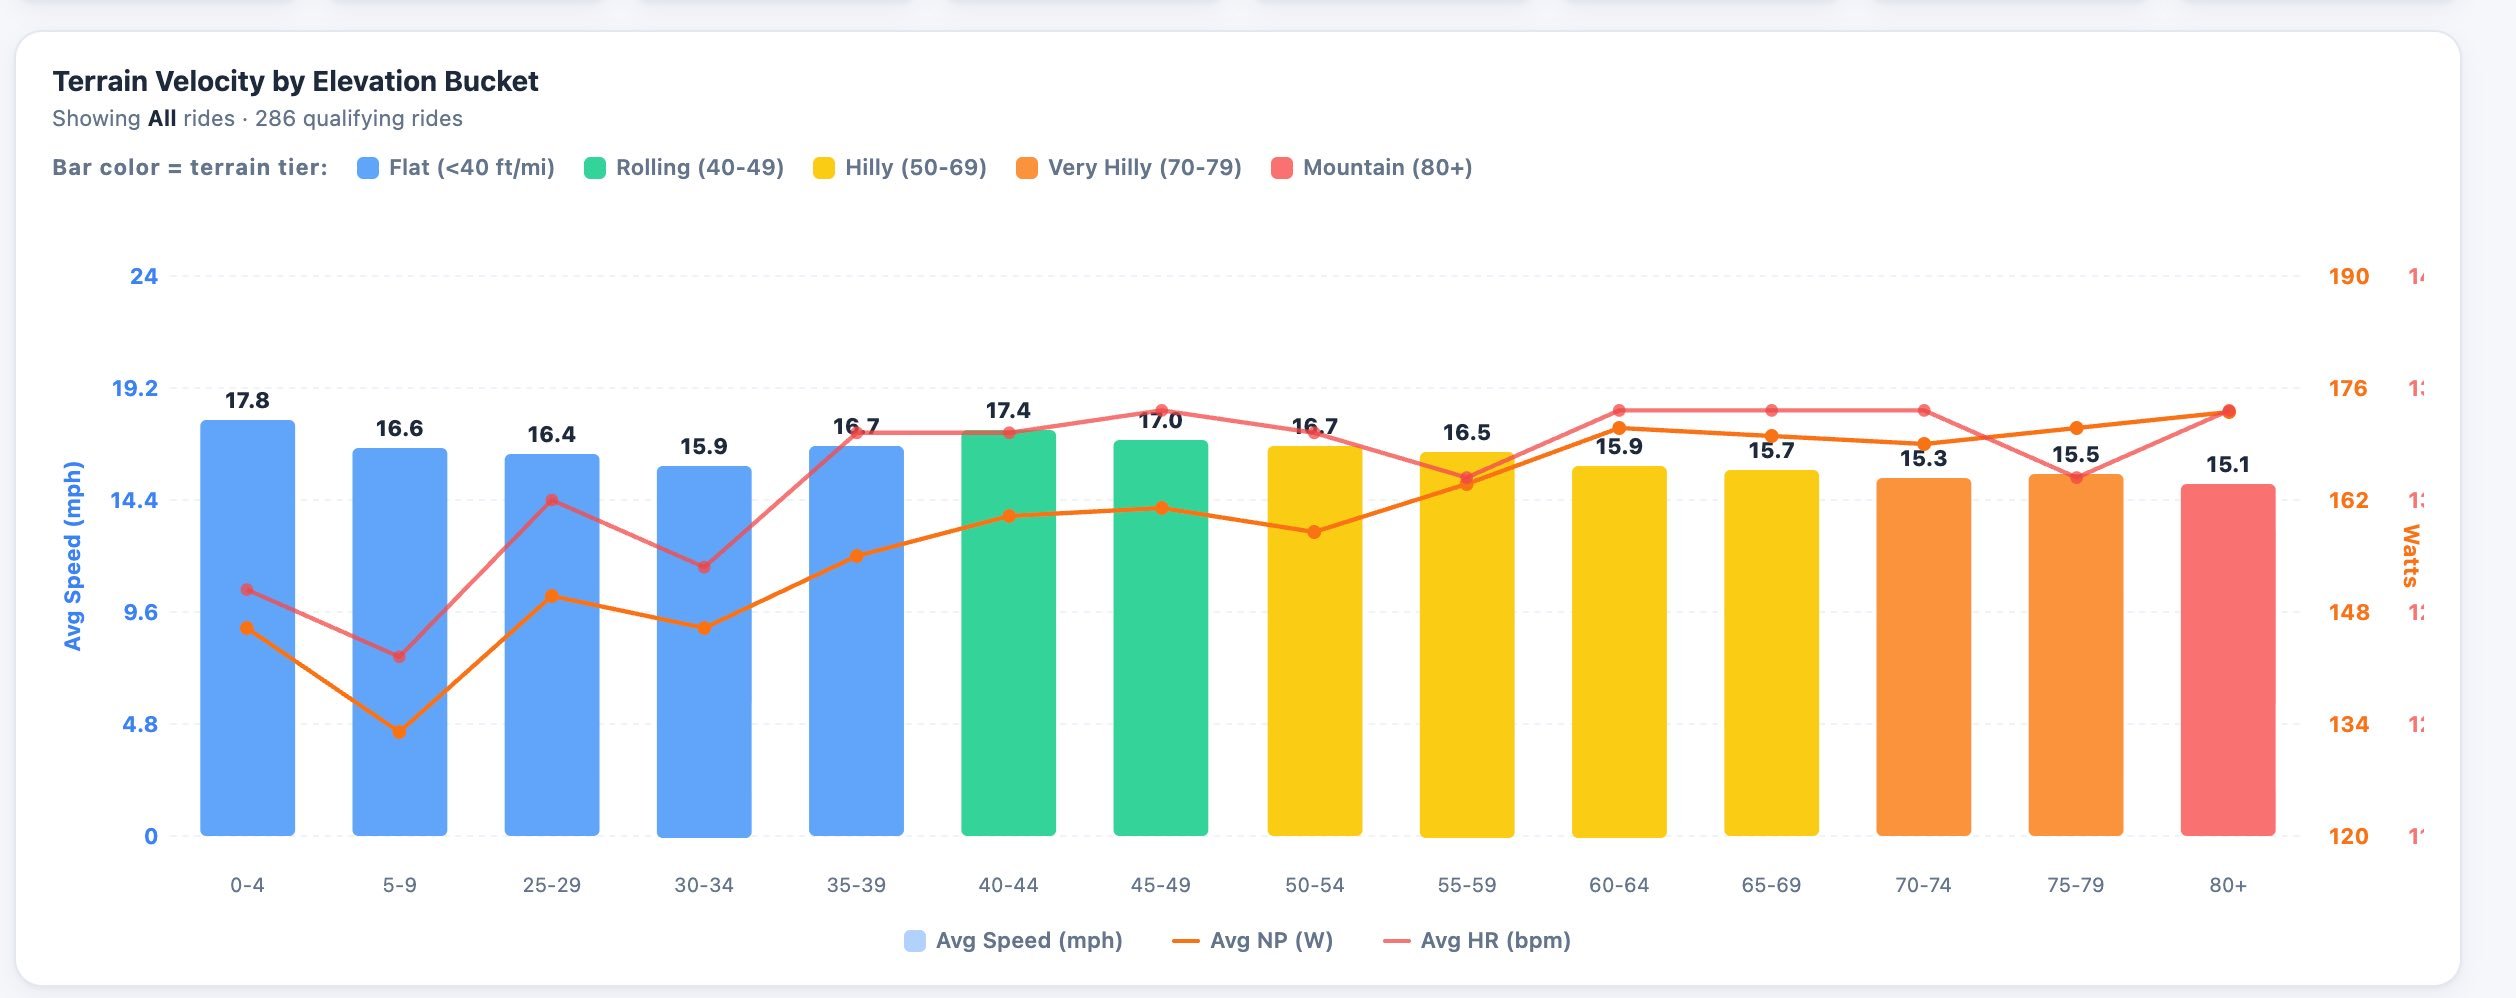
It buckets each ride by climbing rate: flat, rolling, hilly, mountain (feet per mile, or metres per km). It then reports your speed, power, and heart rate for each terrain type. Instead of a single blended average, you can see how you’re doing on the specific road you’re actually asking about. Connect once, and your rides start flowing in; there’s nothing to log by hand.
A worked example: two rides, same 17.0 mph, opposite stories
Numbers make it concrete. Take two riders who each logged a 30-mile ride at exactly 17.0 mph average this month. On paper, a tie. Here is what terrain bucketing shows when each ride is compared to that rider’s own 8-week baseline.
Rider A: the flatlander (629 ft of climbing)
| Terrain (climb rate) | Miles | This ride | 8-wk baseline | Change |
|---|---|---|---|---|
| Flat (<25 ft/mi) | 25 | 17.6 mph | 18.3 mph | −0.7 |
| Rolling (25–50) | 3 | 15.8 mph | 16.3 mph | −0.5 |
| Hilly (50–100) | 2 | 13.0 mph | 13.5 mph | −0.5 |
| Whole ride | 30 | 17.0 mph | n/a | no change |
Rider A is slower on every kind of road. The 17.0 average only held up because they rode an even flatter route than usual: easy terrain propping up a number that’s actually slipping.
Rider B: the climber (1,927 ft of climbing)
| Terrain (climb rate) | Miles | This ride | 8-wk baseline | Change |
|---|---|---|---|---|
| Flat (<25 ft/mi) | 3 | 21.5 mph | 21.0 mph | +0.5 |
| Rolling (25–50) | 4 | 19.0 mph | 18.3 mph | +0.7 |
| Hilly (50–100) | 21 | 16.5 mph | 15.6 mph | +0.9 |
| Mountain (100+) | 2 | 14.0 mph | 13.1 mph | +0.9 |
| Whole ride | 30 | 17.0 mph | n/a | no change |
Rider B is faster on every kind of road, over three times the climbing (1,927 ft vs 629 ft), same headline number. The average that flattered Rider A undersells Rider B.
Same 17.0 mph. The whole-ride average called it a tie, but it was wrong in opposite directions. Only the terrain view gets it right, and answering that question, honestly, is the entire reason CycleLytic exists.
What else does it show
The same idea drives a few more views:
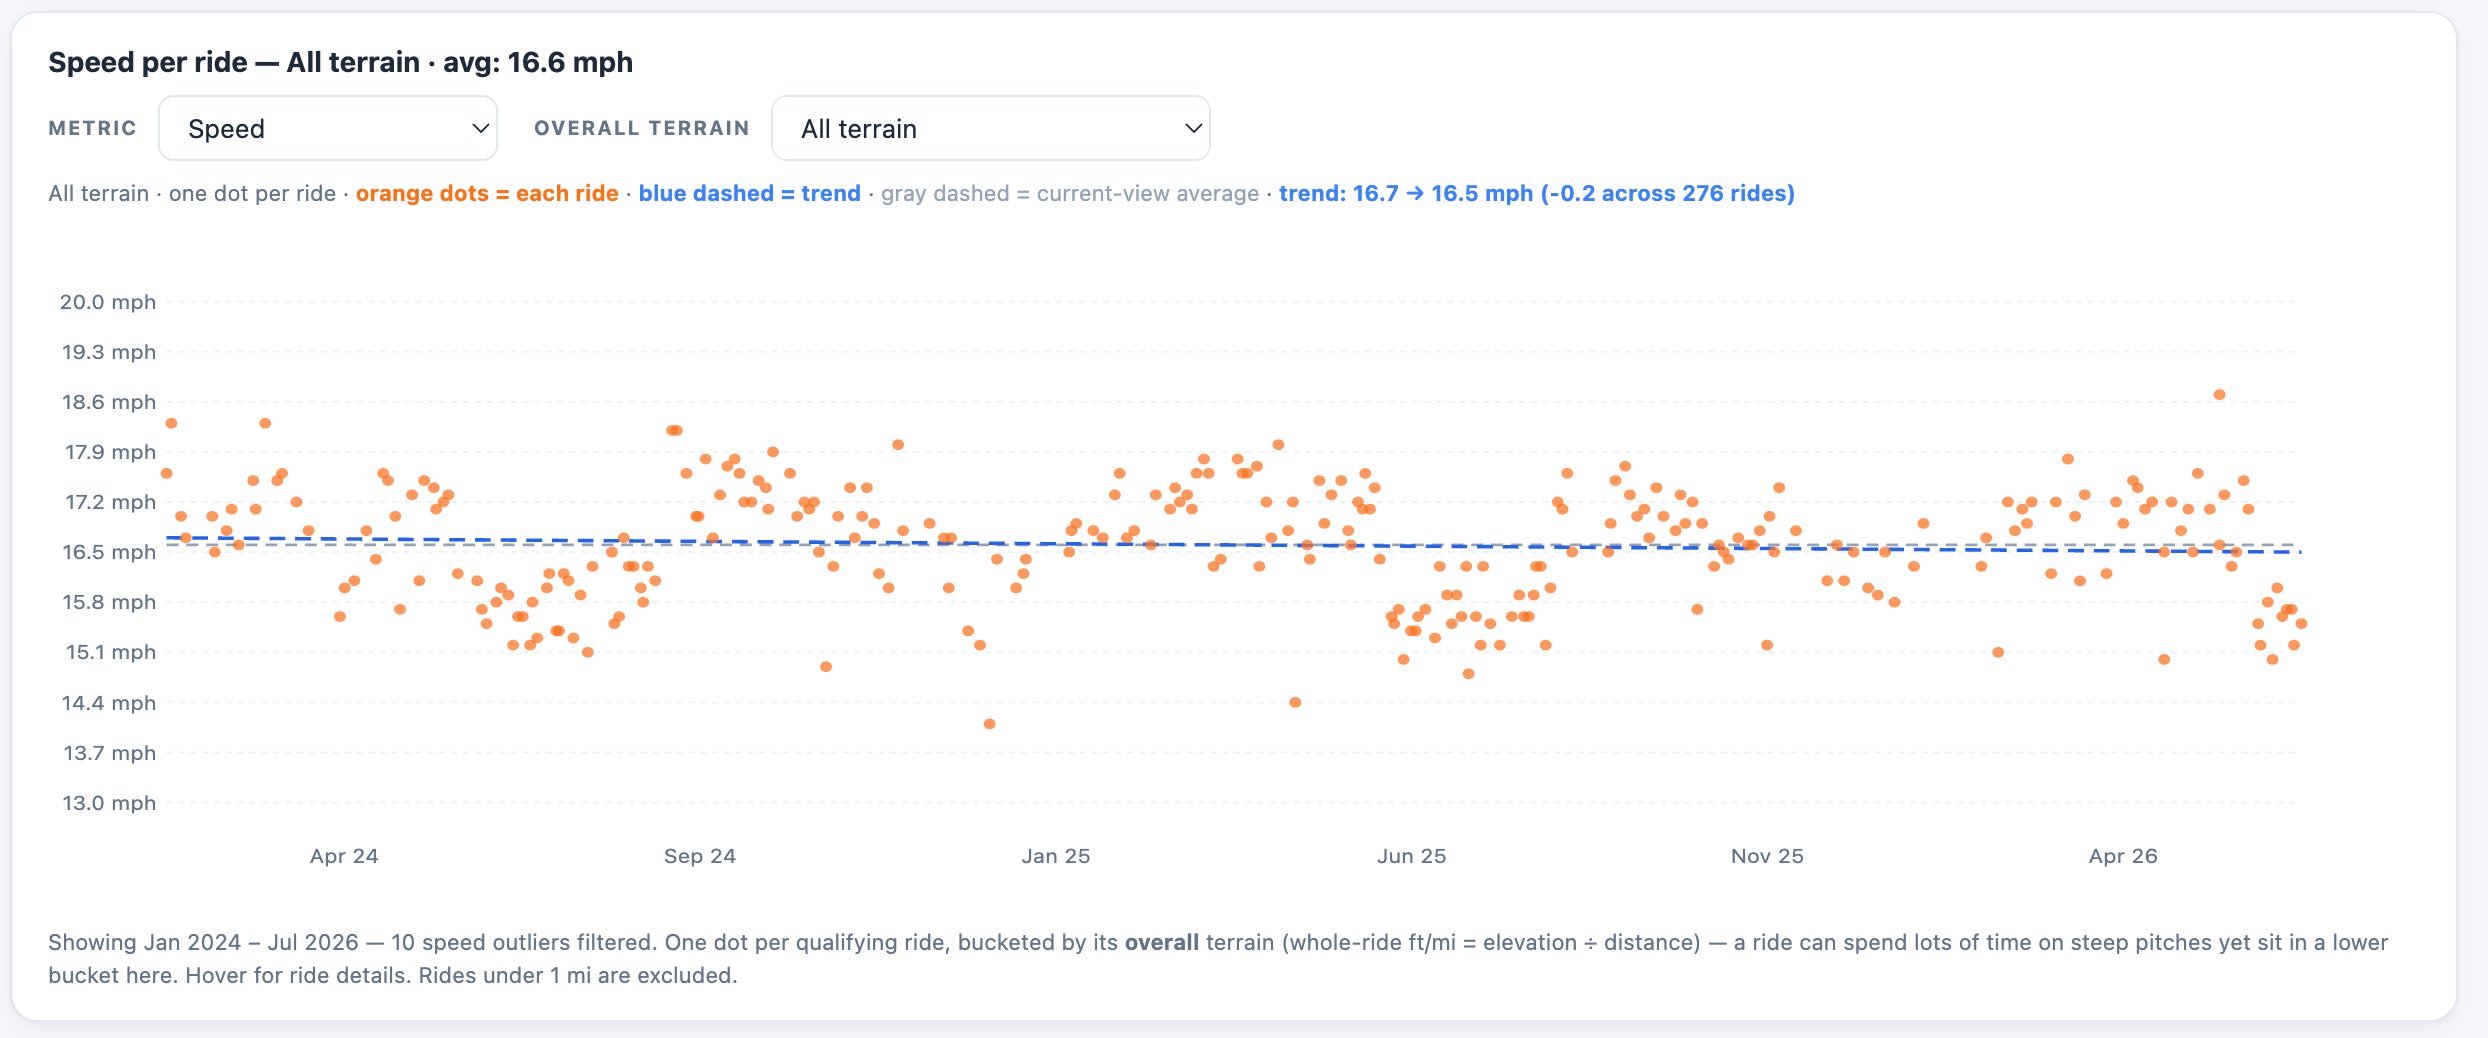
- Honest speed trends: a monthly median-speed chart you can filter by gradient bucket, e.g. “on 40–50 ft/mile terrain, my median speed went from 16.2 to 17.1 mph this year.” Progress you can trust, because the terrain is held constant.
- Aerobic efficiency: your power tracked against your heart rate, so you can tell whether your engine is getting more economical, not just more powerful.
- Free route exports: turn-by-turn TCX/GPX you can send straight to a Garmin or Wahoo, included in the base product, where Strava reserves route building and on-device navigation for paying subscribers.
How it sits alongside Strava
CycleLytic is the analysis layer on top of Strava. Strava handles social networking, activity logging, and some insights; CycleLytic adds terrain-categorised knowledge that Strava doesn’t offer. One-click connect, and it never posts, modifies or deletes anything on the provider’s side.
What it connects to, and what it costs
Connect your rides from Strava, ROUVY, Suunto or Hammerhead, or upload .FIT /.GPX files directly. Route exports go out as TCX/GPX for Garmin and Wahoo head units. There’s a free tier that covers the activity feed, full ride details and community features. Pro is $36/year (about half of Strava’s $80) and adds deeper analytics. The core terrain analysis of your own rides isn’t locked behind the paywall. Built independently in North Carolina by a road cyclist who wanted the terrain-honest view for himself, then opened it up to other riders.
In short
Average speed answers “am I getting faster?” with a number that’s as much about the route as it is about the rider. CycleLytic sorts every ride by terrain and compares like with like, so the answer finally means something. It connects to Strava and the major platforms in one click, is free to start, and you can click around a fully loaded demo (no signup) at cyclelytic.com/demo.
Quick answers
Do I have to leave Strava to use this?
No. CycleLytic sits on top of Strava (or ROUVY, Suunto, Hammerhead). You connect once and keep using Strava exactly as before; CycleLytic just adds the terrain-adjusted analysis.
How does it decide what counts as hilly?
By climbing rate: vertical gain per distance (feet per mile, or metres per km). Every ride is bucketed into flat, rolling, hilly or mountain, and your speed, power and heart rate are reported per bucket so you always compare like with like.
What's free, and what's behind Pro?
The free tier covers the activity feed, full ride details and community features. Pro ($36/year) unlocks the full analytics suite: terrain stats, trends, route analysis and training zones. Your own rides’ core terrain analysis isn’t paywalled.
Related reading on the5krunner
- LeCoach: AI Cycling and Running Coach for Intervals.icu: another indie cycling analytics layer, built on Intervals.icu.
- IntervalCoach: AI Training That Adapts to Your Recovery Each Day: multi-sport adaptive training on Intervals.icu, covering cycling, running and triathlon.
- Runalyze MCP server gives AI the richest sports dataset yet: on the wider trend of sports analytics platforms opening their data layer.
Author: Michael Falkson, founder of CycleLytic, edited by the5krunner.
Last Updated on 2 July 2026 by the5krunner
My favourite kit and nutrition
- Injinji – Runners protect your toes. Avoid discomfort and minor injury. Run more. Run faster. I use them.
- Garmin 90-degree charging adapter — The small adapter that keeps your charging cables tidy. Essential for race day. I use one.
- Garmin charging puck — the fastest and most reliable way to top up your Garmin before a session. I use one.
- Ravemen FR300 — Front light that mounts directly under your Garmin or Wahoo head unit. Keeps your bars clean and your beam pointed where it matters. I use one.
- Body Glide – The blue anti-chafe stick that all swimmers and many runners use. I use it.
- Maurten — The race nutrition trusted by elite athletes. Gels and drink mixes engineered to be easy on the stomach. I use them.
- Garmin Varia RTL515 — A radar rear light that alerts you to vehicles approaching from behind. Pairs with your Edge or Garmin watch. I use this model.
- Favero Assioma Pro RS2 — The power-meter pedals most serious cyclists choose. Accurate, easy to move between bikes. I use this model.
- Garmin Forerunner 970 — A serious choice for a pro-grade triathlon watch. I use this.
- Polar H10 — My daily driver for accurate, waking HRV readings.
- Wahoo ELEMNT Roam 3 — The bike computer that has the feature Garmin lacks: usability. I use mine on most rides.
Reader-Powered Content

This content is not sponsored. It’s mostly me behind the labour of love, which is this site, and I appreciate everyone who supports it.
Support the site: Follow (free, fewer ads) · Subscribe (paid, ad-free) · Buy Me A Coffee ❤️
All articles are written by real people, fact-checked, and verified for originality. See the Editorial Policy. FTC: Affiliate Disclosure — some links pay commission. As an Amazon Associate, I earn from qualifying purchases.

tfk is the founder and author of the5krunner, an independent endurance sports technology publication. With 20 years of hands-on testing of GPS watches and wearables, and competing in triathlons at an international age-group level, tfk provides in-depth expert analysis of fitness technology for serious athletes and endurance sport competitors. ID
