hDrop Review: useful sweat sensor with major usability issues
This is one of the oddest reviews I have written. There is a lot wrong with hDrop’s form factor, its app, and the data’s initial apparent inaccuracy (which ultimately proved to be a calibration workflow issue). However, once it is calibrated correctly, the sweat rate data it provides is accurate enough to have a materially positive effect on race day, especially for ultra- and long-course athletes.
For all its problems, I can see myself using one regularly, especially in summer but also on long winter rides.
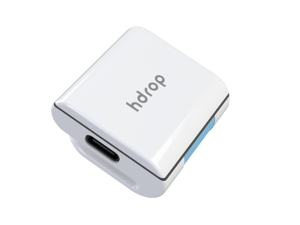
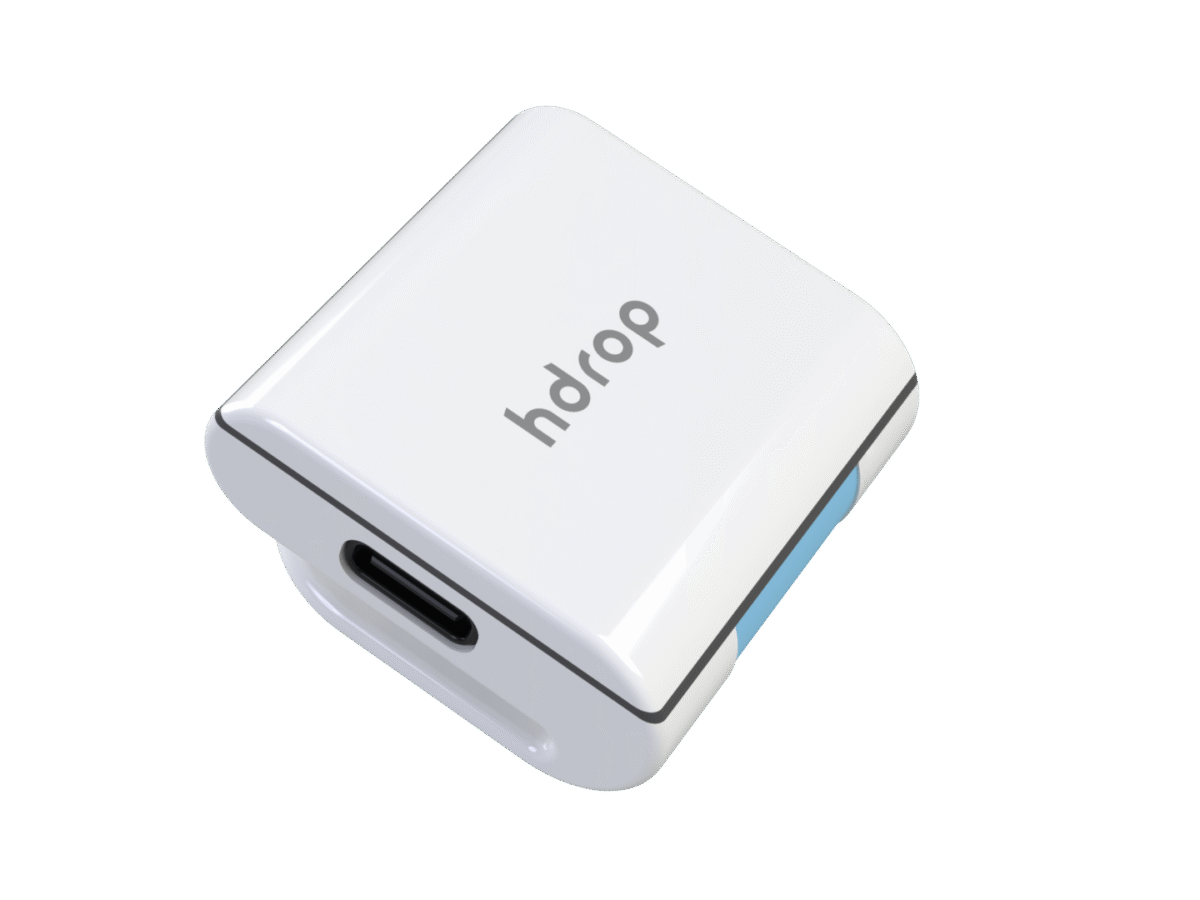
hDrop Gen 2 Wearable Sweat Sensor
hDrop Gen 2 wearable sweat sensor
Measures fluid loss and sodium concentration in real time from a single upper-arm electrode array. Works with Garmin Connect IQ and Wahoo ELEMNT. No patches, no subscription. Calibration required for accurate fluid loss figures; sodium data is more stable across sessions.
Pros
- No patches or required subscription cost
- Accurate fluid and sodium data once correctly calibrated
- Works with Garmin and Wahoo
- Smaller form factor than FlowBio
Cons
- The calibration workflow is not clearly explained in the app
- A single Bluetooth connection requires the phone to be present at the session start and end
- Manual handoff from app to Garmin/Wahoo is required for every use.
- Live hDrop Score not credible during sessions
- Pod retention needs an improved clip mechanism
User Review
( votes)Buy it if you train or race in heat, or regularly go long. Skip it if you want a fit-and-forget sensor.
hDrop: What is wrong with the design
The physical form factor is an angular pod that clips onto a strap, ideally worn on the biceps. It is not the sleekest sports sensor available, but you will almost always have it under a sleeved top, so the appearance is not a practical issue.
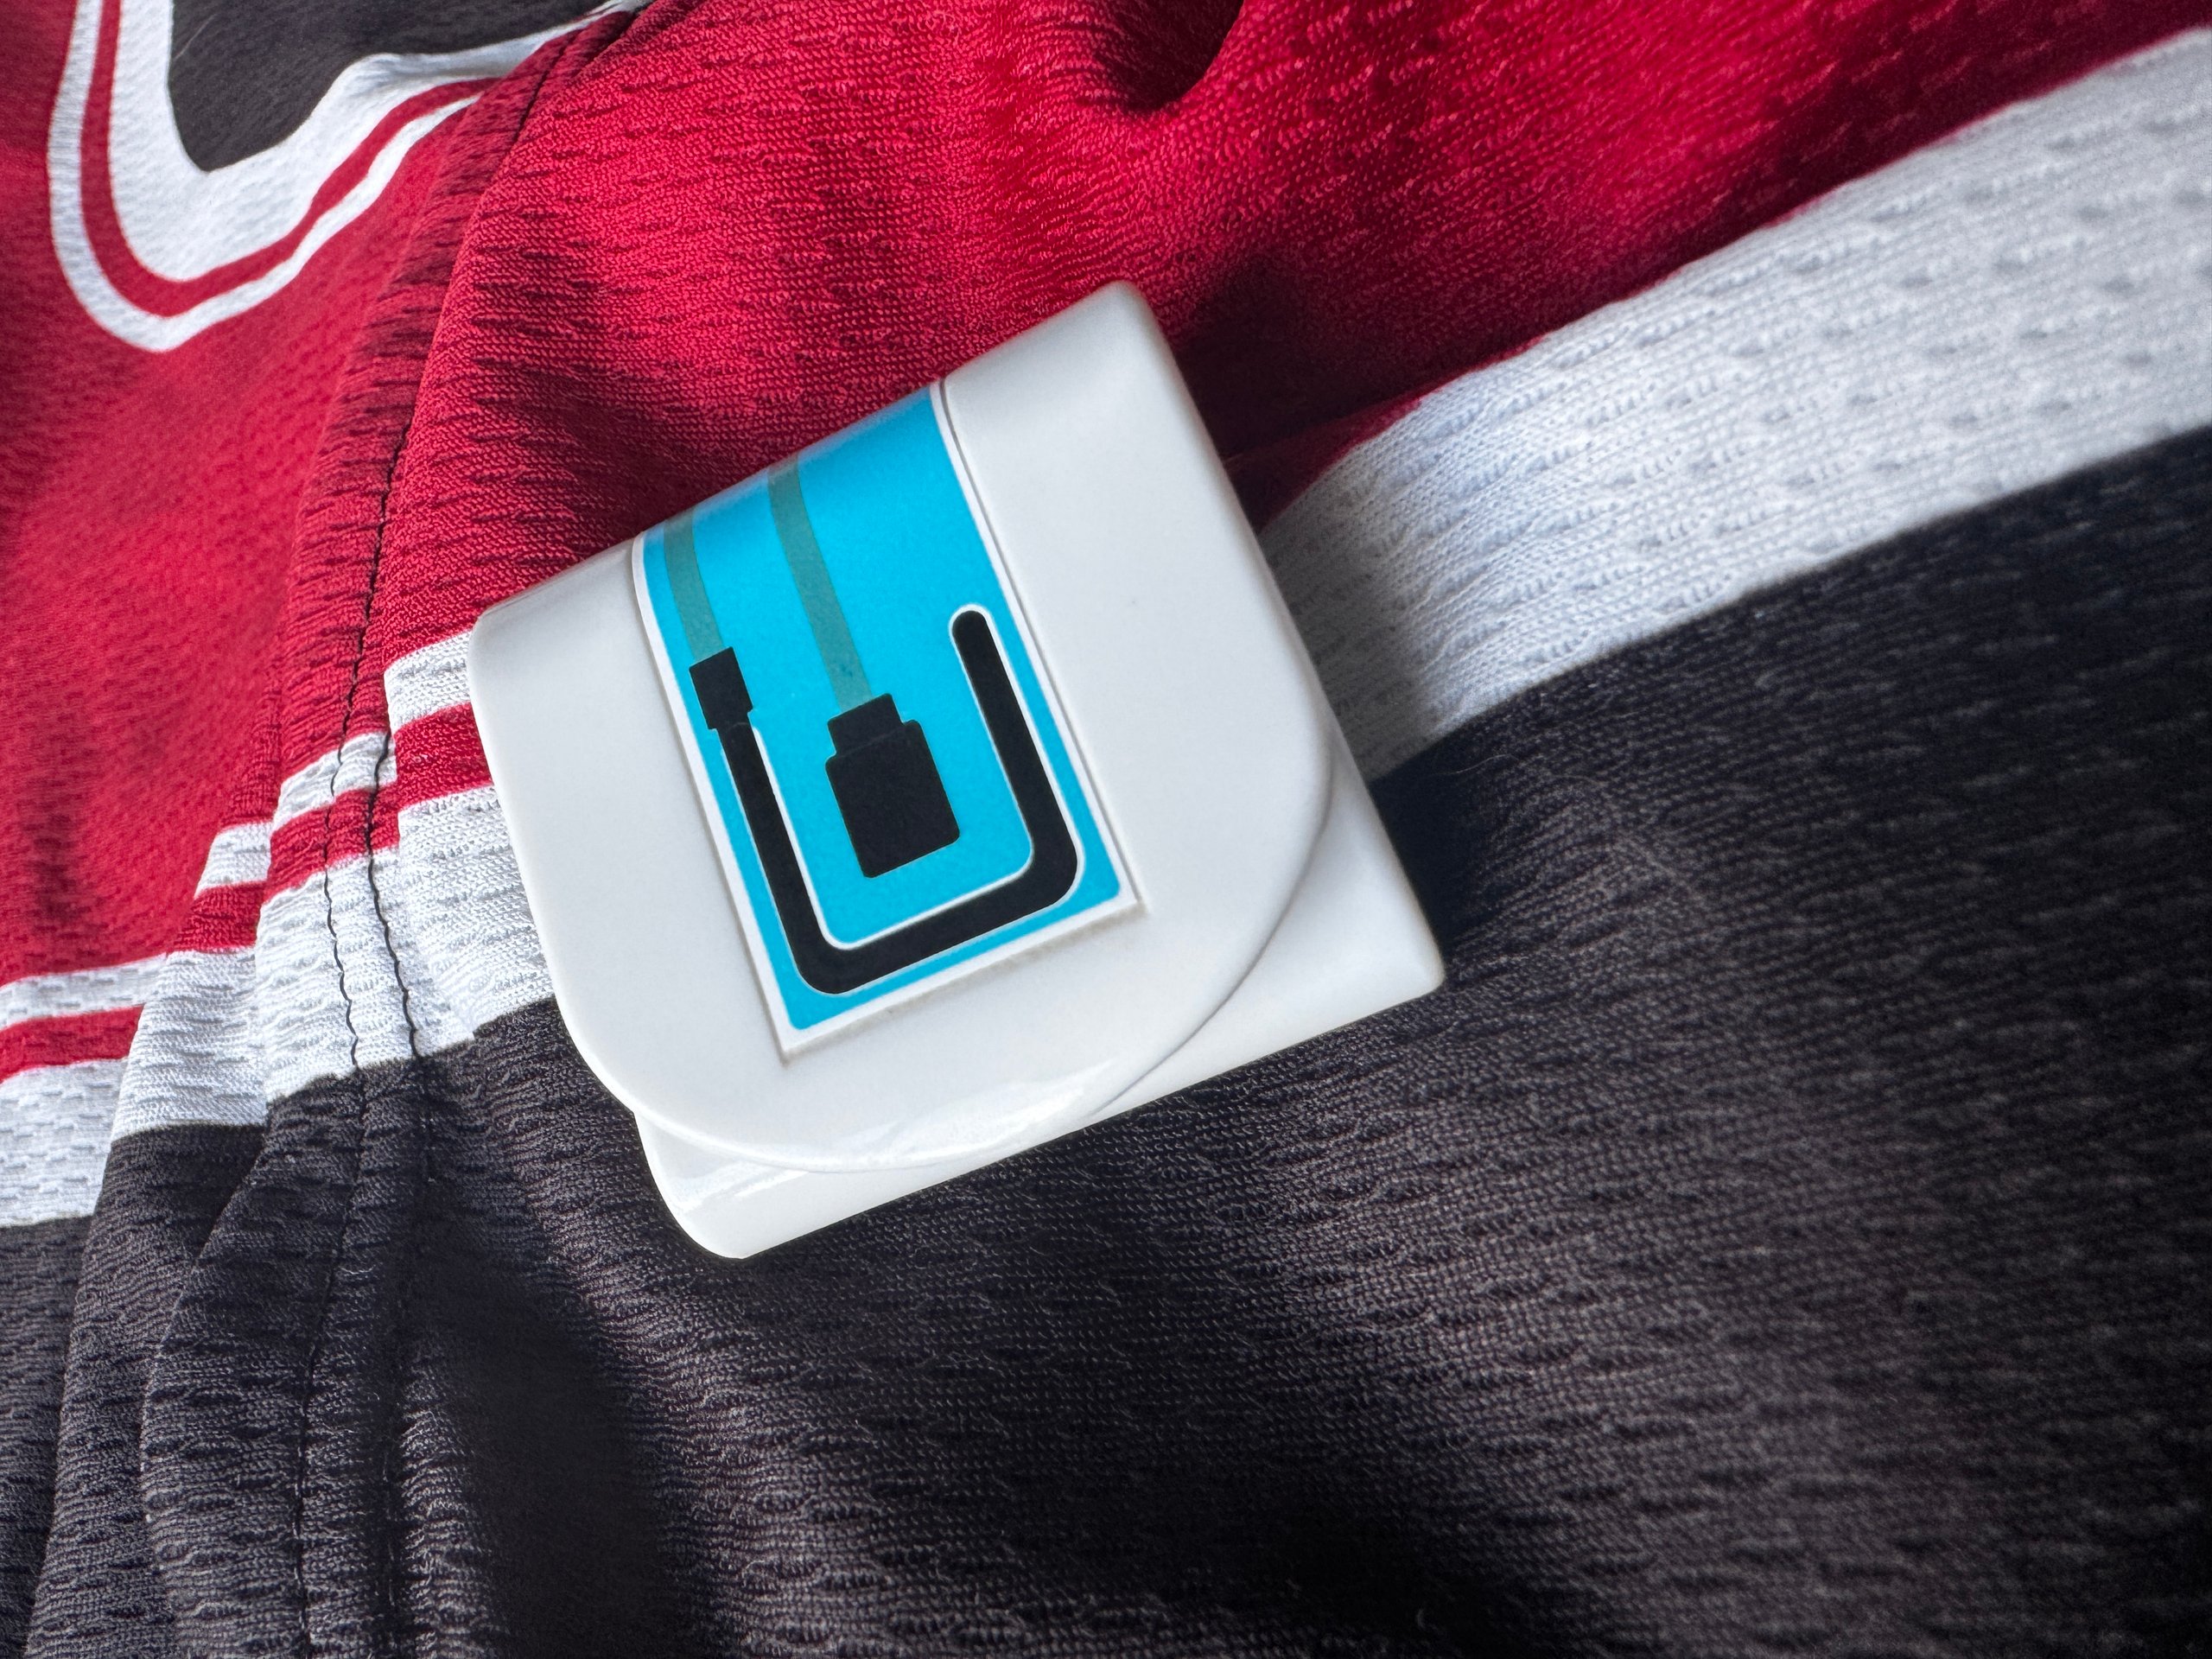
The attachment mechanism is a problem. The pod slides onto the strap, and friction holds it in place. A downward force, such as removing a top, can slide the pod off, and in some circumstances, you would lose it. I used a non-standard strap, the one on my Polar SENSE, and two pods on one strap worked well. The company would note that they cannot guarantee retention on a non-standard strap, which is fair, but the pod did come off several times in safe settings.
The second issue is sweat pooling under the sensing area in low-airflow indoor conditions. This produces readings that diverge from actual fluid loss. It is a generic problem for this category of sensor rather than specific to hDrop, and the calibration process addresses some of it for athletes who train primarily indoors.
hDrop: What is right with the design
The Nix Biosensor requires patches and an ongoing financial commitment. hDrop does not.
FlowBio is notably larger. hDrop is smaller and, at $249.99 USD direct from the manufacturer, considerably cheaper than its closest reusable competitor.
hDrop: how it works
Sodium: The electrode array measures the electrical conductivity of sweat, which maps directly to sodium concentration in mmol/L.
Sweat rate: The sensor tracks how quickly sweat accumulates across the electrode surface, then scales that local rate to a whole-body estimate using a fixed ratio calibrated to the upper-arm site.
hDrop: structural measurement problems
The measurement approach has two structural limitations worth understanding.
A single skin site cannot represent whole-body sweat distribution, even after personal calibration. The readings are estimated and extrapolated from one location, and conductivity at the electrode varies with whatever fluid is present: pooled sweat dilution, evaporation residue, and skin contamination from sunscreen or salt from prior sessions all independently shift the reading.
Sweat rate is derived from the local accumulation rate, but microclimate under the sensor, arm movement, and sensor pressure introduce noise the algorithm cannot distinguish from real sweat rate changes.
hDrop: connectivity and app workflow
Live data is available in the smartphone app or via a Connect IQ data field on Garmin devices. hDrop also works with the Wahoo ELEMNT. Data is cached on the pod and synced after the session.
The connectivity model has one significant constraint: there is a single Bluetooth connection, and every session must be started in the smartphone app. Once started, you can offload the data stream to a Garmin/Wahoo, but the menu option to do this is several taps from the session-start screen. The phone must be present at the start of every session.
At the end of a session, the Garmin/Wahoo activity must be stopped before the smartphone app can reconnect and retrieve the cached data. This always works but sometimes requires two or three attempts before the Bluetooth handover completes.
The app is generally legible and functional. The calibration workflow and the offloading process are the two areas where the organisation is poor. The July 2026 update (v0.50.1) fixed several reliability issues and added optional AI analysis and export features via hDrop Lab, but it does not address the awkward calibration and Bluetooth workflow.
hDrop: the data it produces
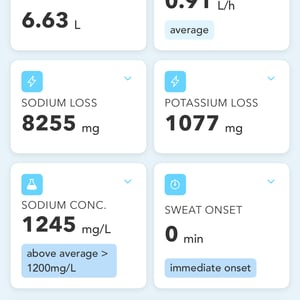
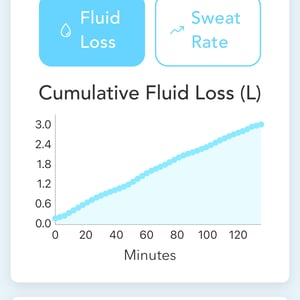
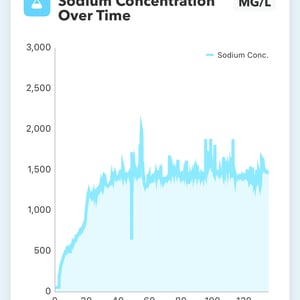
The core outputs are fluid loss, sodium loss, and near-body temperature, with instant and trend views of each, plus the hDrop Score and sweat zones.
Post-workout analysis in the app adds weather data, including temperature, air pressure, and wind, used to refine the calibration model over time rather than in real time during the session.
Wahoo data
Wahoo ELEMNT computers display cumulative sodium loss and fluid loss. Post-workout data in the Wahoo app is not available at the time of writing.
Garmin Connect IQ data
Garmin Edge computers, Forerunner watches, and other compatible devices display total fluid and sodium losses alongside the hDrop on a 0 to 100 hydration scale where 100 represents optimal hydration.
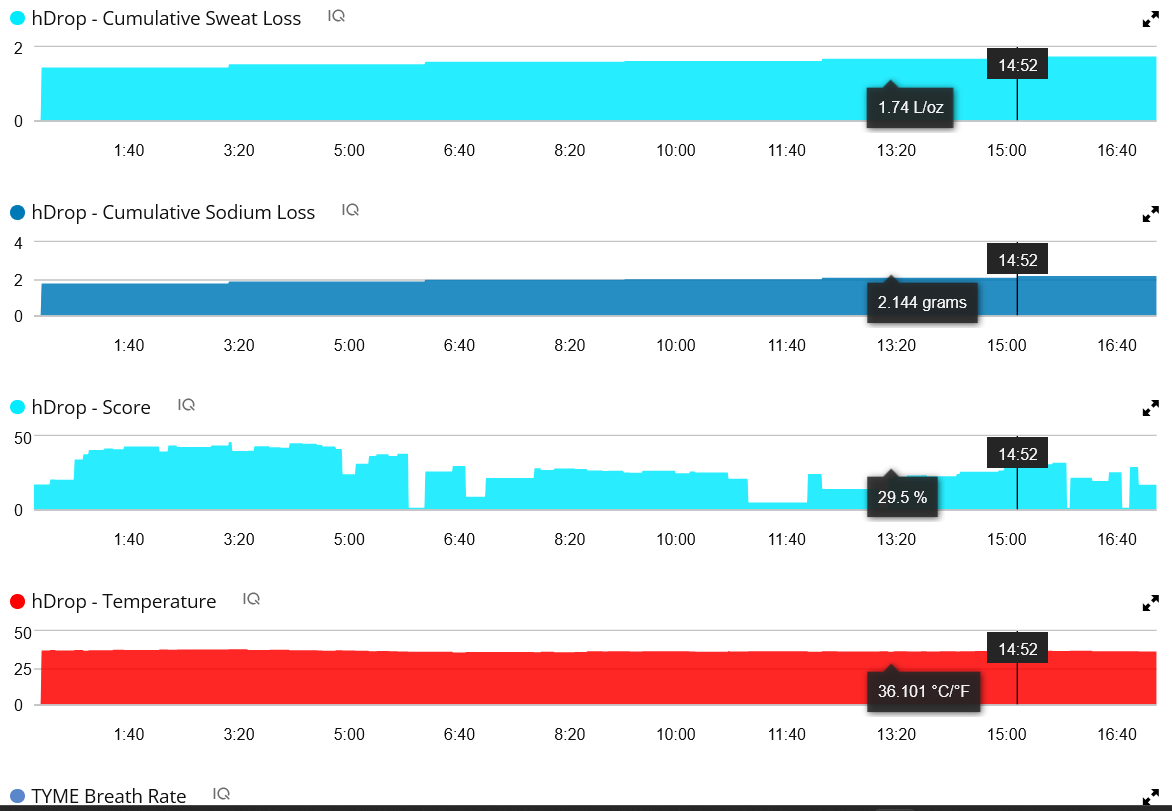
hDrop smartphone app
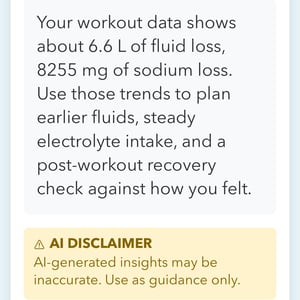
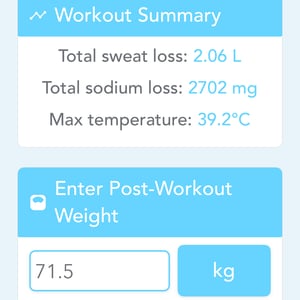
The screens below give an indication of the post-workout dashboard metrics, charts, and calibration interface.
Accuracy: sweat loss
Across eleven sessions, the accuracy picture falls into two distinct phases, separated by a workflow correction from hDrop on 29 June.
The first five sessions were recorded repeatedly using the app’s Calibration activity type. Running multiple Calibration activities without completing ‘normal’ activities compounds the internal correction factor, producing inflated estimates. This is not documented clearly in the app: there is no warning against repeated calibration, no prompt to switch to Active after the first Calibration is saved, and nothing in the session-start flow to indicate which activity type is appropriate. The co-founder confirmed the workflow error in writing after reviewing the published data. The overestimates from those sessions, ranging from 37 to 151 per cent, reflect that compounding. They are documented in hDrop calibration: why the fluid loss numbers run high and cycling 2×20: did the hDrop calibration work outside and with Garmin CIQ, and should be read in that context.
After the intervention on 29 June, hDrop applied the correct calibration factor remotely and advised switching to Active Mode for all future sessions.
The two sessions immediately following 29 June were recorded as Active with no manual intervention, allowing the device to settle before drawing conclusions.
The three sessions used for post-intervention accuracy assessment produced the following results:
- 2 July, outdoor bike, zone 3 to 4, approximately 70 minutes, hot conditions: actual loss 1.3 kg, hDrop measured 1.38 L. Overestimate: 6%.
- 4 July, indoor HYROX-related training, approximately 100 minutes, strenuous: actual loss 2.1 kg, hDrop measured 2.10 L. Overestimate: 0%.
- 5 July, outdoor threshold bike, 2×20 minutes: actual loss 1.1 kg, hDrop measured 1.12 L. Overestimate: 2%.
All three sit inside hDrop’s independently tested error claim of below 10 per cent. The 4 July and 5 July sessions are effectively exact, and the results are consistent across indoor and outdoor environments and different activity types.
The sodium concentration data were more stable throughout both phases. The Dartmoor Classic session showed a plateau between 57 and 65 mmol/L across the final two hours of a 108 km ride, consistent with prior electrolyte testing.
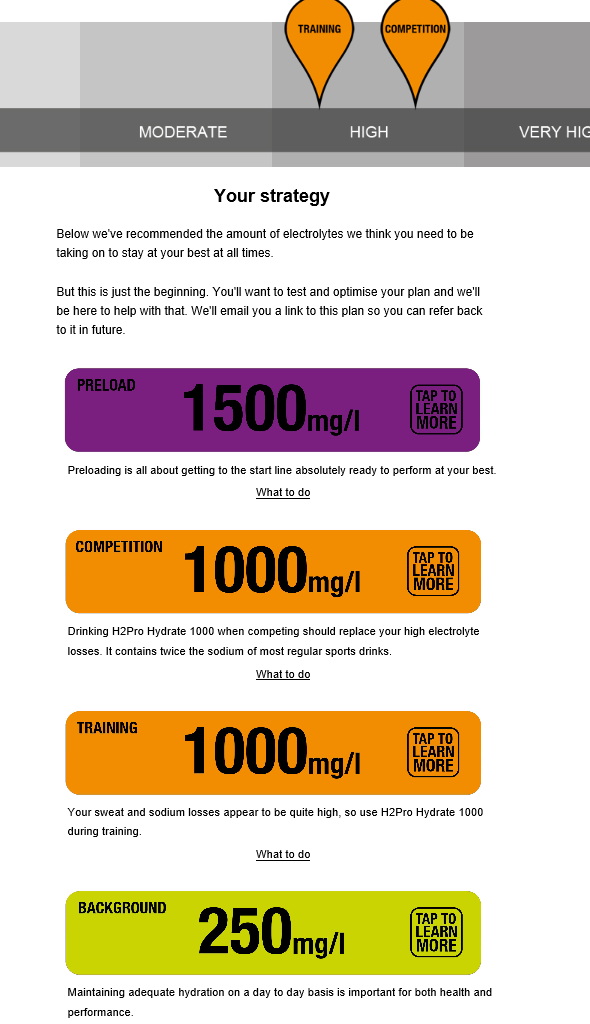
My Precision Hydration online sweat test placed me in the high sweat rate, high sodium loss bracket, with a recommended competition strategy of 1000 mg/L and a pre-load of 1500 mg/L.
The Dartmoor Classic sodium plateau of 57 to 65 mmol/L from hDrop is consistent with that profile. The same logic applies to long winter rides: sweat rate is lower in cold conditions but still meaningful across three to four hours, and the tendency to under-drink in cold weather compounds across a training block.
hDrop Score
The hDrop Score runs from 0 to 100, with 100 representing optimal hydration. During sessions in which no fluid was consumed, the score fluctuated rather than declining steadily. Whether this reflects an algorithmic issue, a sensor stabilisation artefact, or a display interpretation problem is unclear from the app.
Post-session fluid and sodium totals, once calibration is correct, were accurate and actionable. The live hDrop score during sessions is not a metric I would rely on.
Who is it for?
hDrop suits three types of athletes.
- Anyone needing quantified, real-time hydration guidance during exercise rather than relying on thirst or a fixed time interval as the trigger to drink.
- Anyone establishing a personal sweat rate baseline, whether new to structured training or moving into an unfamiliar environment, sport, or race format.
- Anyone who sweats heavily or loses significant sodium and needs to quantify that profile to manage cramp risk or dehydration in races.
It is less relevant to athletes whose sessions consistently last under an hour in temperate conditions, and it produces no useful data for swimmers.
Why understanding dehydration data matters
A 2% loss of body mass due to dehydration reduces blood volume, increases blood viscosity, and limits oxygen delivery to working muscles. On long summer rides or runs, gradual dehydration is easy to ignore until it begins to affect performance.
Sodium and potassium depletion are the primary electrolyte drivers of exercise-induced cramp, a neuromuscular event that can end a race in seconds rather than merely slowing an athlete down.
Competitors
FlowBio is larger than hDrop and more than half as expensive at £295 GBP (approximately $395 USD). It has a published peer-reviewed validation study in Frontiers in Physiology (2025), with reported field accuracy of 83% for sodium and 73% for fluid loss. It has Wahoo connectivity now and Garmin integration in beta. Early customer feedback suggests hDrop has shown more consistent real-world reliability, though both are early-market products with limited independent comparison data.
Nix requires disposable patches at $5 to $12 each, making it the only sensor in this group with an ongoing consumable cost. It suits athletes who want occasional testing rather than regular session-by-session data.
The science
Sawka et al. (2007), in the American College of Sports Medicine’s position stand on exercise and fluid replacement, established that dehydration equivalent to 2% of body mass produces measurable reductions in aerobic capacity. Shirreffs and Sawka (2011) confirmed that sweat sodium concentration varies between 20 and 80 mmol/L across individuals, with genetic, dietary, and acclimatisation factors contributing.
hDrop’s published validation reported approximately 92% accuracy for sweat loss and 87% for sodium under controlled conditions. The methodology is summarised on hDrop’s science page. FlowBio’s peer-reviewed validation in Frontiers in Physiology reported 90% lab accuracy and 73% field accuracy for fluid loss.
The Precision Fuel and Hydration independent test found hDrop underestimated sweat rate on a moderate cycling protocol. The eleven-session dataset from this review, including three post-correction sessions returning errors of 0%, 2%, and 6%, sits alongside those published figures as real-world consumer evidence.
hDrop Gen 2 price: where to buy
hDrop Gen 2 is $249.99 USD direct from the manufacturer, with free shipping available in many cases and taxes calculated at checkout. Regional retail pricing: £286.40 GBP and €329.95 EUR on UK and European retailers including TriathlonWorld. hDrop and FlowBio are both one-time purchases with no subscription or patch cost.
Buy via the the5krunner hDrop affiliate link to support the site at no additional cost.
hDrop Sweat and Sodium Sensor
Garmin and Wahoo compatible
 +other retailers
Take Out
The measured sweat rate exceeded my intuition of how much I sweat. A correctly calibrated hDrop will flag when I am off by a whole bottle or more, and that, to me, is an actionable threshold. Half a bottle out makes little practical difference.
The app workflow before each session is fiddly but livable for long hot rides where hydration matters.
If you wear a biceps strap such as the Polar Verity Sense, hDrop clips on for dual use.
In summary: flawed but handy, calibration required.
Quick answers
Does hDrop require a subscription?
No. One purchase, no patches, no ongoing cost.
Who should use hDrop?
Athletes who want to understand their personal sweat rate, particularly in new environments or race formats, those training regularly in the heat, and anyone who needs to manage cramps or the risk of dehydration in longer events.
How does hDrop compare to FlowBio?
FlowBio is larger and approximately 60% more expensive. Both are one-time purchases with no subscription. FlowBio has a published peer-reviewed validation study. General user feedback suggests hDrop has shown more consistent real-world results, though neither has a large independent comparison dataset.
Is the hDrop Score reliable?
Based on this testing, the live score during sessions was not credible: it rose even when no fluid was consumed. Post-session fluid and sodium totals, after correct calibration, were accurate.
What is the correct hDrop calibration workflow?
Complete one Calibration activity, then record all future sessions as Active. Repeated use of the Calibration activity type compounds the correction factor, inflating fluid loss estimates. The app does not make this sequence clear.
Last Updated on 3 October 2026 by tfk the5krunner
Small things I always use
- Garmin 90-degree charging adapter: Charges your Garmin from any USB-C cable. Essential when travelling. I use one.
- Body Glide: The blue anti-chafe stick swimmers and runners carry. I use it.
- Speedo earplugs: Fewer ear infections and no cold-water dizziness. I use them.
- Dryrobe Advance: My winter changing robe for open-water swims. I use one. A cheaper option is the AONYIYI changing robe.
- Maurten: Race fuel that stays easy on the stomach. I use them.
- Garmin charging puck: The quickest way to top up before a session. I use one.
- Injinji: Toe socks that stop rubbing, so you run more. I use them.
- Ultimate toe protectors: Stop black toenails on long runs. They work. I use them.
- Compressport R2 v2 calf sleeves: My calf sleeves of choice. I use them.
- Cellucor C4: My pre-workout before hard sessions.
- TPU tubes: Schwalbe Aerothan, Tubolito and Pirelli SmarTube. Light, tiny spares. I use all three.
- G8 insoles: Adjustable insoles that are good. I use them.
- Cycplus Cube: A 97g electric pump that gets a road tyre rideable in two minutes. I carry one. 5% off with code THE5KRUNNER.
Watches and sensors
- Polar H10: My daily driver for waking HRV.
- Polar Verity Sense: My backup arm-worn HR sensor.
- Nomad bedside charger: Charges my iPhone and Apple Watch overnight. I use it, and many of their bands.
- Train.Red: The best muscle oxygen sensor I’ve used.
- Tymewear: Accurate heart rate and reliable ventilatory zones. I use it to pace endurance rides over an hour.
- Garmin Forerunner 970: A pro-grade triathlon watch. I use this.
- Apple Watch Ultra 4: My daily smartwatch. No phone needed on rides.
- Garmin Fenix 9 Pro: I’ve just bought one.
On the bike
- Continental GP5000 for everyday riding, and Aero 111 on the front for special occasions.
- Helmets: Specialized S-Works Evade 3 for road riding, and Rudy Project Wing for TT-style races. I use both.
- Ravemen FR300: A front light that mounts under your Garmin or Wahoo. I use one.
- Wahoo TRACKR Radar: I use it on one bike and Varia on the other. They perform the same.
- Garmin Varia RTL515: Radar that warns you of cars from behind. I use this model.
- Wahoo ELEMNT Roam 3: The bike computer that’s easy to use. I use mine on most rides.
- Favero Assioma Pro RS2: Accurate power pedals that swap easily between bikes. I use this model.
Home and indoor training
- NPE Runn: Makes my basic treadmill smart, sending more accurate speed and distance to my watch and Zwift. I use it.
- Google Wifi: Keeps Zwift connected in my pain cave. I use it.
- Apple TV 4K: Zwift on the big screen. I use two.
- Google Nest Doorbell (wired, 2nd gen): My video doorbell, running in both Google Home and Apple Home. I use it.
Health, recovery and sleep
- FreeStyle Libre 3 Plus: Shows how my blood sugar responds to diet.
- hDrop: Measures my sweat loss in summer and indoors.
- Fourth Frontier Zone: Checks my heart under load in hard sessions.
- Oura Ring 5: My partner’s recovery tracker of choice.
- Kineon MOVE+: Red light therapy for niggles. It works.
- Eight Sleep: A cooling mattress cover my partner and I use nightly.
Reader-Powered Content

This content is not sponsored. It’s mostly me behind the labour of love, which is this site, and I appreciate everyone who supports it.
Support the site: Follow (free, fewer ads) · Subscribe (paid, ad-free) · Buy Me A Coffee ❤️
Written by real people, with AI assistance. Fact-checked and verified for originality. See the Editorial Policy. FTC: Affiliate Disclosure — some links pay commission. As an Amazon Associate, I earn from qualifying purchases.
tfk is the founder and author of the5krunner, an independent endurance sports technology publication. With 20 years of hands-on testing of GPS watches and wearables, and competing in triathlons at an international age-group level, tfk provides in-depth expert analysis of fitness technology for serious athletes and endurance sport competitors. ID
