Cycling 2×20: did the hDrop calibration work outside and with Garmin Connect IQ?
I needed to do a threshold session as I’ve been slacking a bit this week. A 2×20′ outdoors workout at below LTHR is a standard optimal workout for me, and today was the day to do it. The temperature was around 27 degrees Celsius, with only a bit of wind and very humid. This is going to be a sweaty but enjoyable session.
A few days ago, I calibrated the hDrop sweat sensor with the app’s tool, but I did that after an hour-plus indoor workout that was very sweaty. One problem here is that sweat can linger (pool), so the sensor reads water that’s been there longer than it should. Long story short, after indoor calibration, it could overestimate outdoors.
I’ll tell you the test results and how the sensor worked when linked to a Connect IQ field on a Garmin Forerunner.
hDrop calibration check and outdoor re-calibration test result
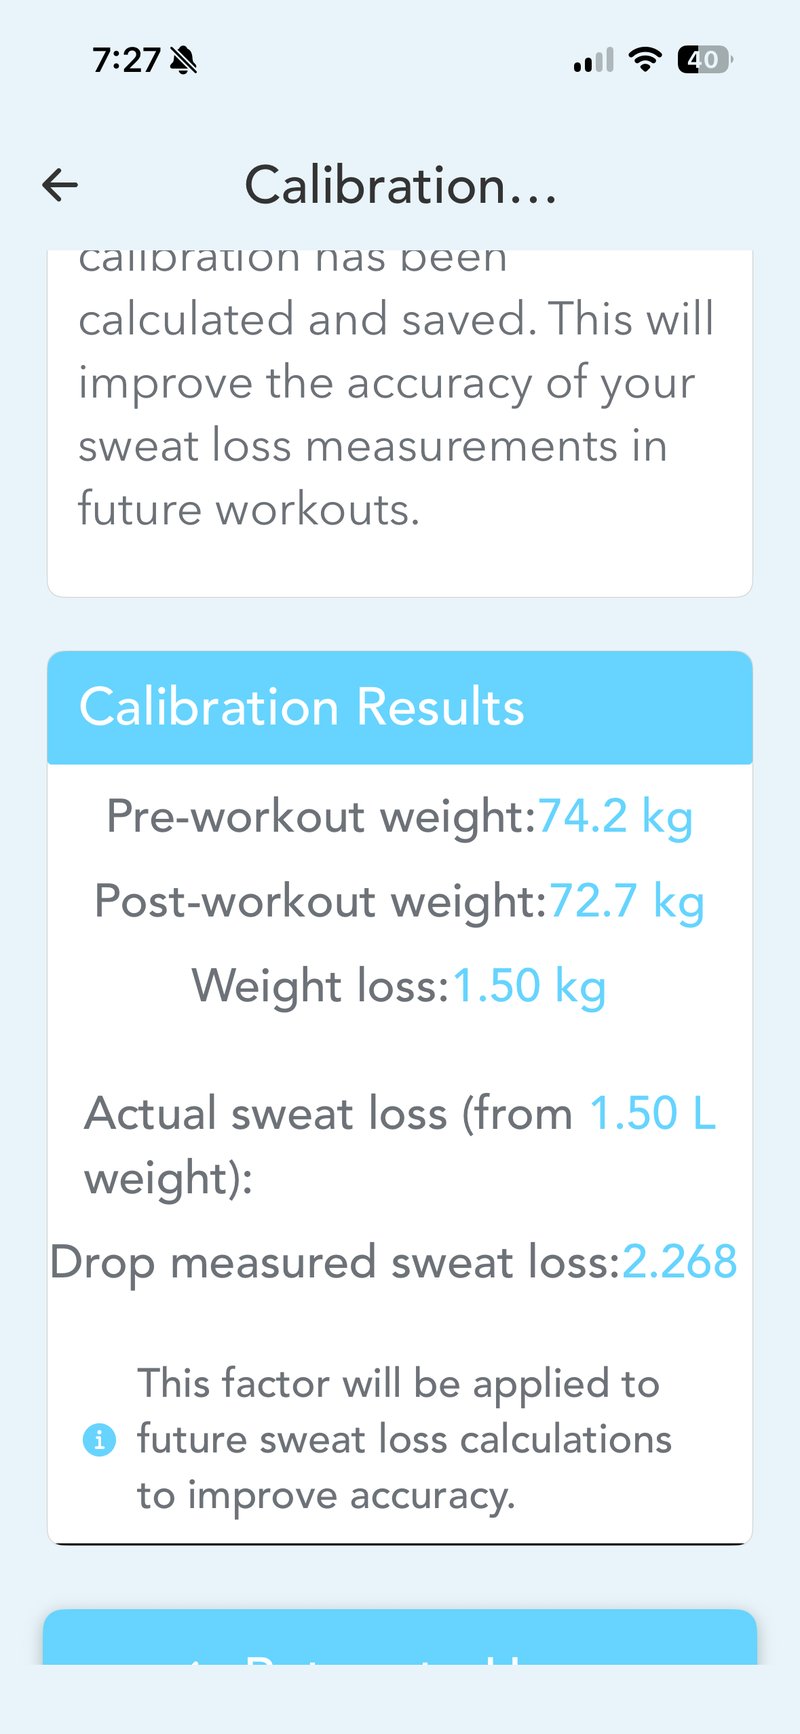
The current calibration yielded a sweat loss of 151% of the actual weighed loss: the hDrop measured 2.268 L (2.268 kg), and the actual weight loss was exactly 1.5 kg (1.5 L). The previous calibration overestimated by 37%, so the error has grown rather than reduced. You need three qualifying workouts, and I have more than that.
The Garmin Connect IQ data field
Only one BLE data stream is sent from the hDrop sensor.
With the sensor connected, you initiate the workout in the app, and the app then connects to your sports device of choice, either a Garmin watch or a Garmin/Wahoo head unit. Transferring the connection is technically and practically super easy; the faff is in needing to do it in the first place, and I can’t think of any other modern sensor that works this way.
I’ve tested the hDrop’s link to a Wahoo bike computer (it worked), so today was a test to link the Connect IQ field on the Forerunner 970 (hint: it worked).
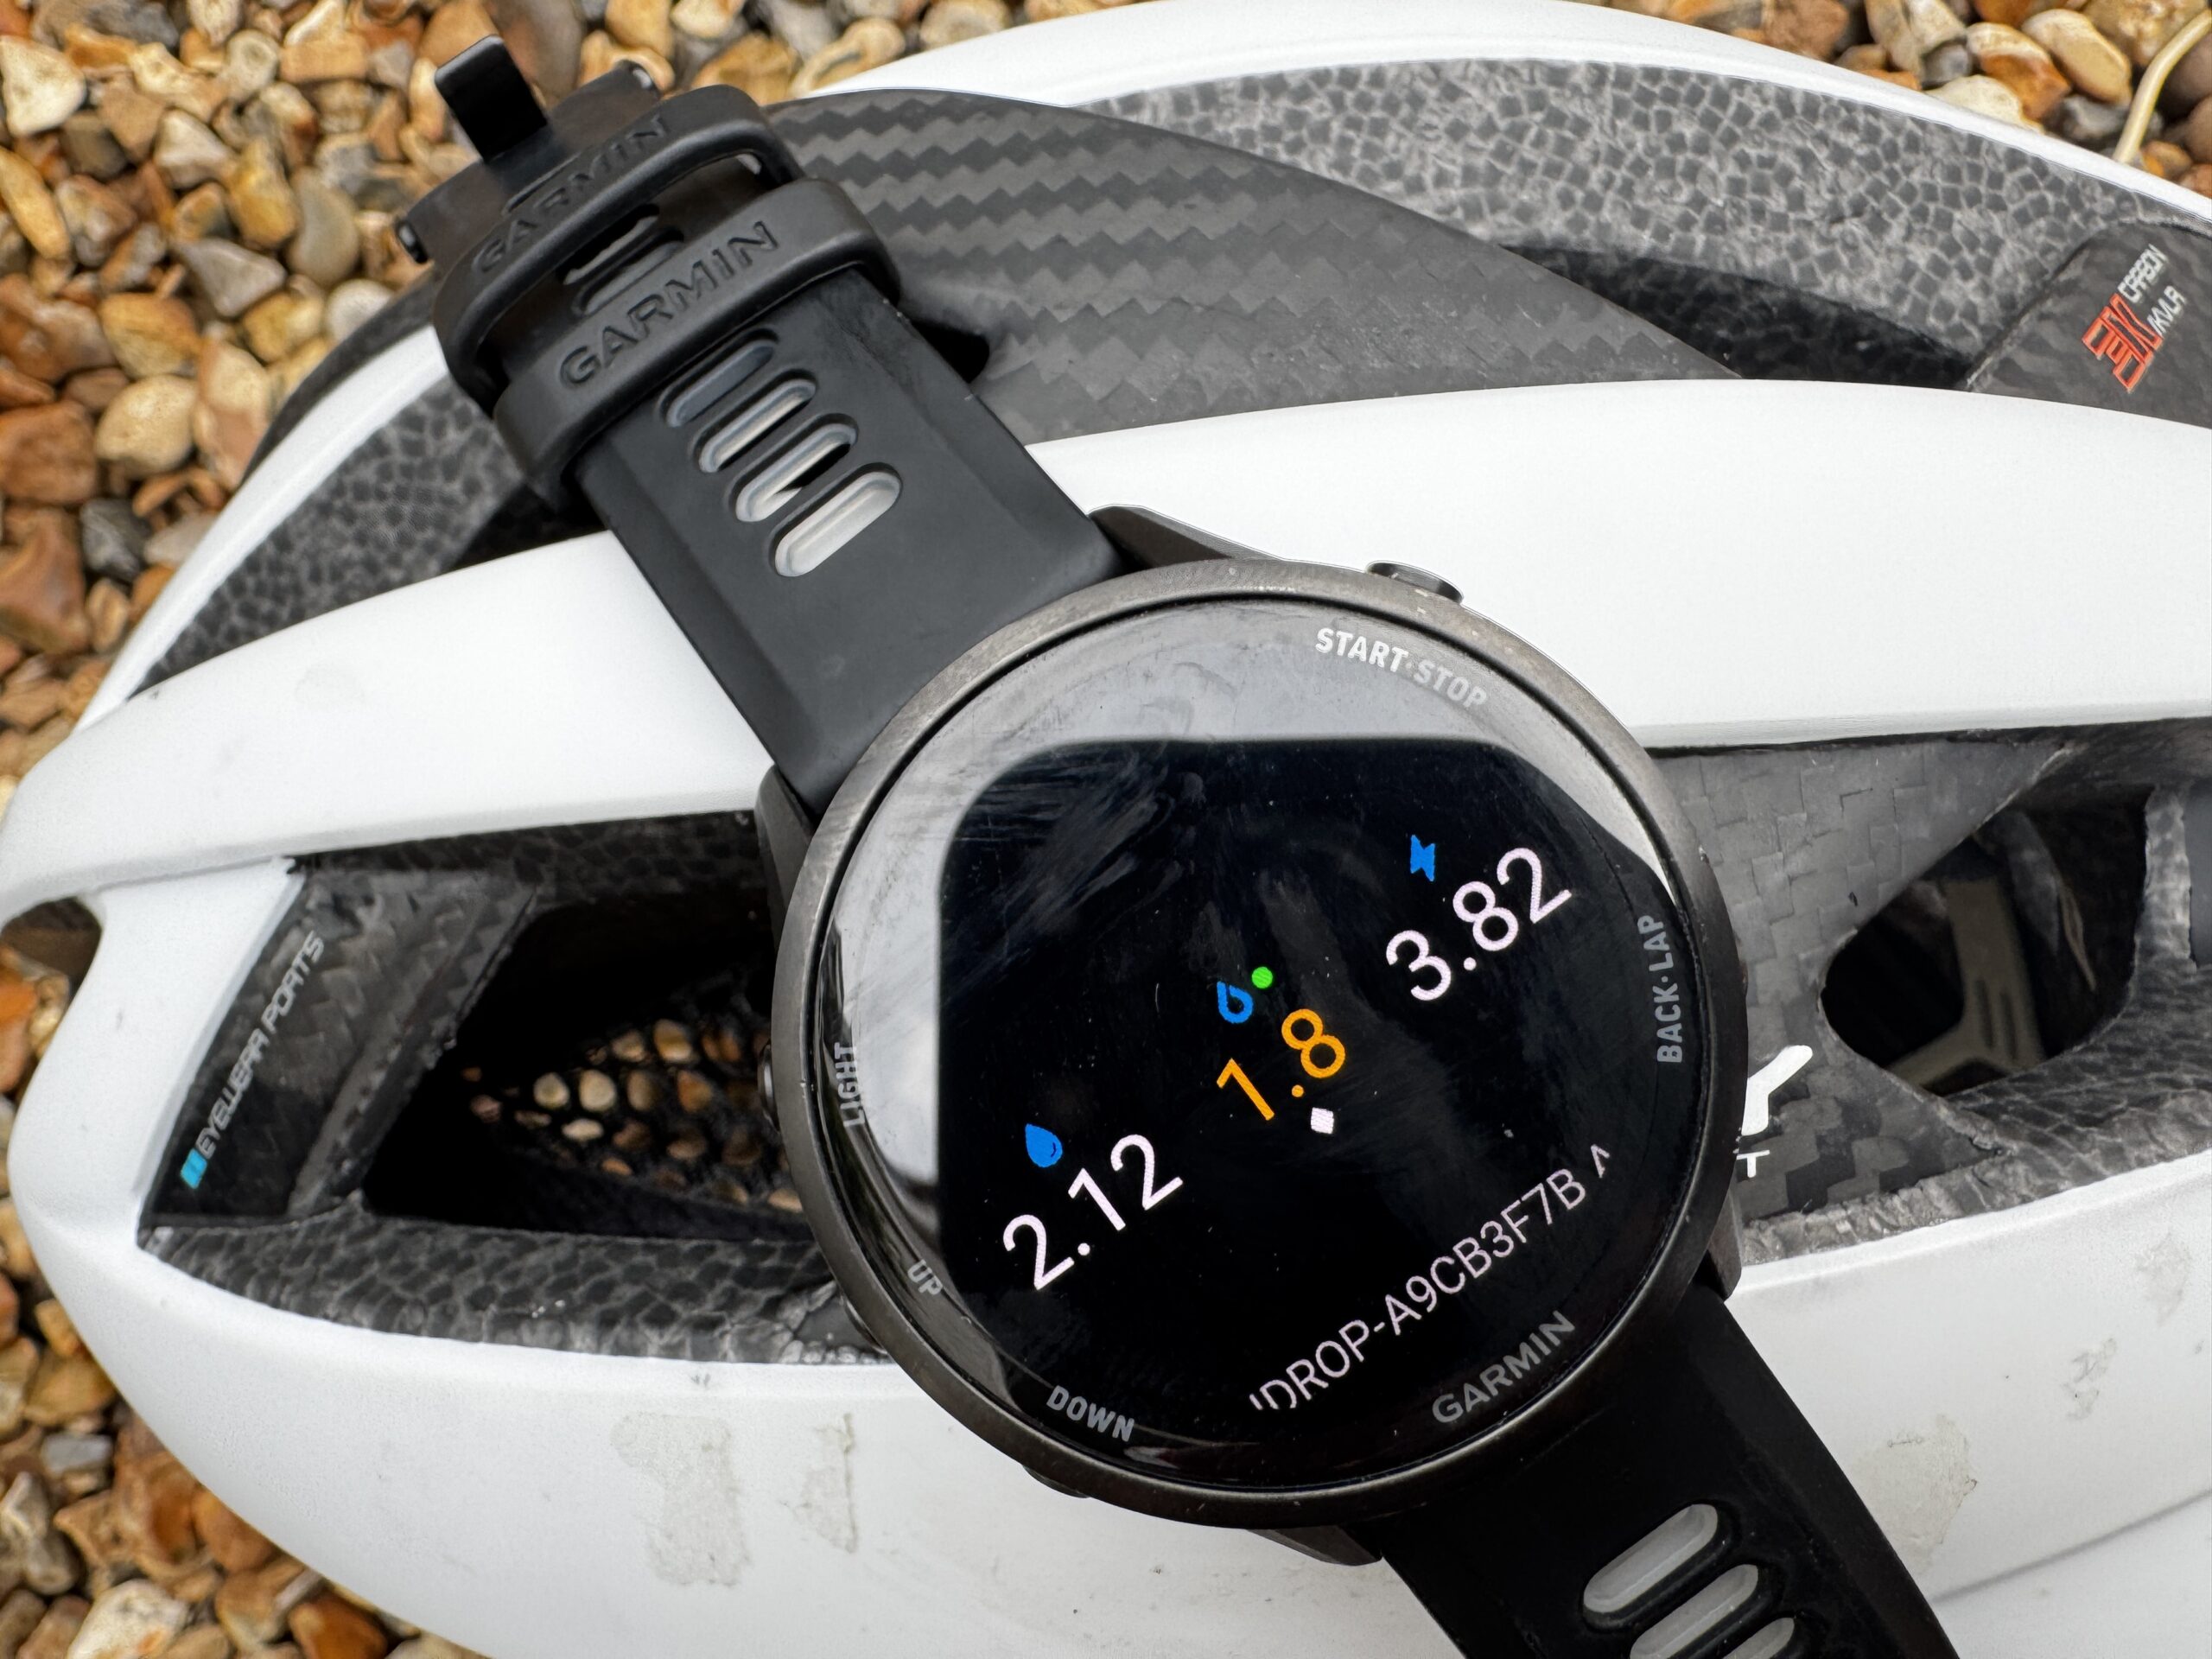
Whilst the app is not very well designed, the watch’s data field is easy to read and looks good. It clearly shows the following:
- Sweat Loss: the amount of fluid your body has lost.
- Sodium Loss: the estimated amount of electrolytes and sodium you are losing.
- hDrop Score: a proprietary real-time hydration score.
Putting that into context:
Typical ranges across metrics
| Metric | Typical range | What it means |
|---|---|---|
| Sweat Loss | 0.5 to 2.0+ L/h | Driven mostly by temperature, humidity, and exercise intensity. Anything over 2.0 L/h is considered very high. |
| Sodium Loss | 300 to 1,500+ mg/L | Primarily determined by genetics. Salty sweaters can easily lose upwards of 1,500 mg per litre of sweat. |
| hDrop Score | 1 to 100 | A proprietary real-time score. Higher numbers indicate normal hydration; lower scores show accumulating dehydration. |
The image from the end of my workout confirms I sweated 2.68 litres. The sodium loss is very high, confirming what I already knew; I’m a salty sweater, and perhaps that could be linked to the occasional cramps I get. Monitoring dehydration and sodium loss is worth thinking about if you get cramps.
I’m not entirely sure how to interpret the hDrop’s dehydration status indicated by the third metric. It’s extremely low, and I wasn’t extremely dehydrated.
Takeout
In terms of the practicalities of using the hardware, I learnt nothing new today. I did confirm the results of a few trivial indoor setup tests with the Garmin data field, proving that hDrop’s Connect IQ data field works in real use.
However, regarding hDrop’s data and metrics, I’ve raised more unanswered questions. Is the hDrop score of any use? Does the calibration value actually save?
Quick answers
Does hDrop work with Garmin Connect IQ?
Yes. The sensor transmits a single BLE data stream, which the Garmin Connect IQ data field picks up and displays as sweat loss, sodium loss, and the hDrop Score in real time.
How accurate is the hDrop sweat loss estimate?
In this outdoor cycling test, hDrop overestimated fluid loss by 51% against actual body weight change. A previous indoor calibration showed a 37% overestimate, so accuracy varies by conditions.
What does the hDrop Score mean?
The hDrop Score runs from 1 to 100. Higher numbers indicate normal hydration; lower scores indicate accumulating dehydration. Its real-world reliability is still being assessed.
Last Updated on 28 June 2026 by the5krunner
My favourite kit and nutrition
- Injinji – Runners protect your toes. Avoid discomfort and minor injury. Run more. run faster. I use them.
- Garmin 90-degree charging adapter — the small adapter that keeps your charging cables tidy. Essential for race day. I use one.
- Garmin charging puck — the fastest and most reliable way to top up your Garmin before a session. I use one.
- Ravemen FR300 — front light that mounts directly under your Garmin or Wahoo head unit. Keeps your bars clean and your beam pointed where it matters. I use one.
- Body Glide – The Blue anti-chafe stick that all swimmers and many runners use. I use it.
- Maurten — the race nutrition trusted by elite athletes. Gels and drink mix engineered to be easy on the stomach. I use them.
- Garmin Varia RTL515 — radar rear light that alerts you to vehicles approaching from behind. Pairs with your Edge or Garmin watch. I use this model.
- Favero Assioma Pro RS2 — the power meter pedals most serious cyclists end up choosing. Accurate, easy to move between bikes. I use this model.
Reader-Powered Content

This content is not sponsored. It’s mostly me behind the labour of love, which is this site, and I appreciate everyone who supports it.
Support the site: Follow (free, fewer ads) · Subscribe (paid, ad-free) · Buy Me A Coffee ❤️
All articles are written by real people, fact-checked, and verified for originality. See the Editorial Policy. FTC: Affiliate Disclosure — some links pay commission. As an Amazon Associate, I earn from qualifying purchases.

tfk is the founder and author of the5krunner, an independent endurance sports technology publication. With 20 years of hands-on testing of GPS watches and wearables, and competing in triathlons at an international age-group level, tfk provides in-depth expert analysis of fitness technology for serious athletes and endurance sport competitors. ID
