I went for a 150-minute ride with Fitbit Air, Whoop and an ECG Strap. Here’s what I found
Today, I looked at three things. Firstly, I delved deeper than usual into an under-discussed stats issue in wearable reviews; then I looked at what the ECG data from Frontier ZONE actually showed during a long ride; and finally, I looked in the mirror at my haggard self after a gruelling week of training. Let’s go.
Are the Devices Accurate?
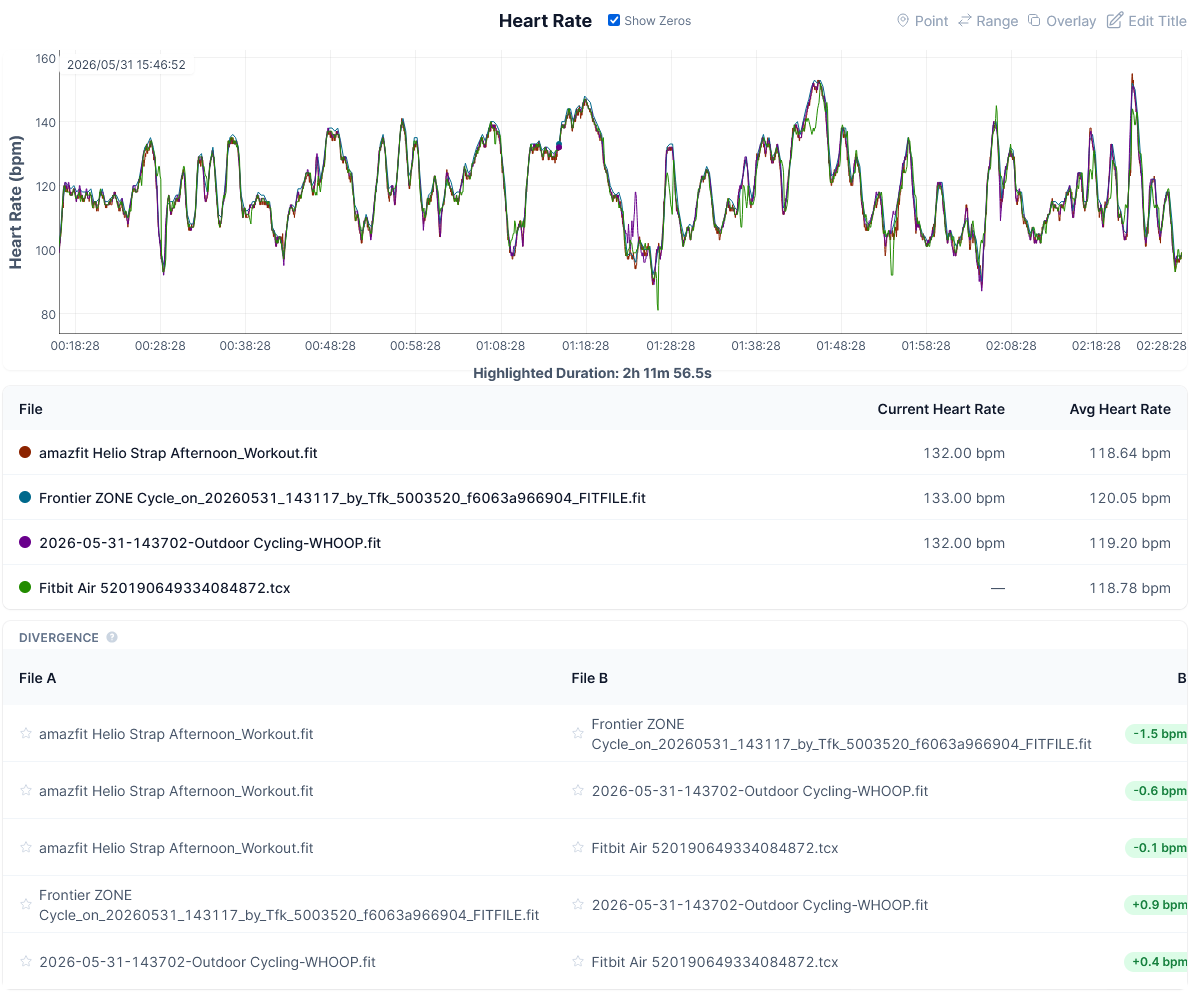
Yes. I’ve reached the point of consistency for ‘accuracy issues’ with Fitbit Air, which is generally OK but sometimes not. Today, Frontier ZONE, Whoop MG, Fitbit Air and Amazfit Helio Strap appear equally accurate for sports tracking outside of laboratory requirements, at least for steady endurance efforts of this kind. As a chest strap, Frontier ZONE benefits from direct electrical measurement rather than optical sensing, which gives it an edge during intensity changes and in general use.
For visual comparison, you can see that the Whoop MG (biceps) on this chart has one blip in the middle section, while the Fitbit Air (wrist) shows numerous minor deviations from what appears to be the consensus.
There’s a but coming.
Lies, Damned Lies and Statistics
So, the chart you’ve just seen above is a slight misrepresentation on my part. Sorry! Let me explain.
What I did was shift the Frontier ZONE’s data by +15 seconds. This makes the chart look prettier, with the curves near perfectly aligned, but it also affects more detailed analysis in dcrainmaker’s analyser (beta) tool, because the stats look at data pairs. If you move one of the time series, the paired data will differ.
In my opinion, I did the right thing, as I am trying to find what four devices thought at a given instant in time. However, by doing so, I could be masking a flaw or lag in the data, or a simple misstatement of the time (in other circumstances, perhaps the GPS time on a watch isn’t updated). What I can say is that this strongly suggests a timestamp alignment issue between datasets rather than a physiological measurement error. It is unlikely that the other three devices would all share a 15-second offset in the opposite direction, which points to the Frontier ZONE as the source of the mismatch, but I cannot be certain.
In other cases, not here, a reading might reflect a physiological delay at the points of sensing, such as the pulse transit time (typically sub-second), or there could be delays caused by processing in the sensor’s algorithms.
I know that, obviously, dcrainmaker is fully on top of the data pair issues here with his tool, and probably so is Rob (@thequantifiedscientist), but how much of the other data out there is correct? Time-series alignment is a known but rarely-discussed source of error in wearable comparisons.
That all sounds very technical. But so what?
Well, the “so what” is that the answers are different. Firstly, check out the x-axis I used. I often record data before and after an exercise and then crop down to the exercise itself, giving devices time to warm up—or, more accurately, making sure I remember to turn them all on, which can sometimes be more convoluted than you’d imagine. So the cropped data series gives different answers from the full one. Again, I’ve shown what I believe is correct.
Coming back to quantifying the timestamp adjustment. Here is an interpretation of the data before the 15-second timestamp adjustment:
- Average heart rate was virtually identical across all four devices: Frontier ZONE (120.2 bpm), Whoop MG (119.4 bpm), Fitbit Air (118.9 bpm), and Amazfit Helio Strap (118.8 bpm).
- The closest agreement was between the Amazfit Helio Strap and Fitbit Air, with a bias of just -0.1 bpm.
- Whoop MG also tracked extremely closely to the Helio Strap, with a bias of -0.6 bpm and the tightest limits of agreement (−4.1 to +2.9 bpm).
- The Frontier ZONE device recorded slightly higher values overall, averaging 1.4 bpm above the Helio Strap.
- All pairwise comparisons showed excellent agreement, with biases below 1.5 bpm.
- Overall, all four devices produced highly comparable heart-rate data during the ride, with no practically significant differences in average heart rate.
And here is the comparison after the adjustment:
- The Amazfit Helio Strap vs Frontier ZONE comparison improved from limits of agreement of −10.1 to +7.3 bpm to −4.5 to +1.6 bpm, while bias changed only slightly (−1.4 to −1.5 bpm).
- The Frontier ZONE vs Whoop MG comparison also tightened markedly, from −7.4 to +9.2 bpm to −3.0 to +4.8 bpm, with bias unchanged at +0.9 bpm.
- These much narrower limits of agreement suggest that the original differences were largely due to a timing offset rather than heart-rate measurement error. The bias barely changed; the limits of agreement narrowed dramatically — a pattern characteristic of phase misalignment rather than systematic sensor bias.
- The results for the Helio Strap, Whoop MG, and Fitbit Air are essentially unchanged, with biases of −0.6 bpm, −0.1 bpm, and +0.4 bpm, respectively.
- Following the timestamp correction, the Frontier ZONE now shows agreement much closer to that of the other devices, with all pairwise comparisons remaining in the excellent category.
Assuming the timestamp shift is the correct action, this raises the question: “How on Earth do you know what the time shift is?” There will obviously be algorithmic ways to determine the required shift, but… Jeez, good luck, Ray! I do it by visually aligning peaks and troughs, but what if those visual cues are wrong in one of the sensor’s data points?
@Ray, @Rob. What do you think?
I still think visual comparisons are often the best to make. Showing correlations can mask when the disagreements occurred, and those points (or ranges of points) can represent a specific use case the athlete was doing, e.g., running on gravel. So the real interpretation would then be “it’s running on gravel that causes XXX a problem”, not that XXX only had 95% agreement.
the ECG
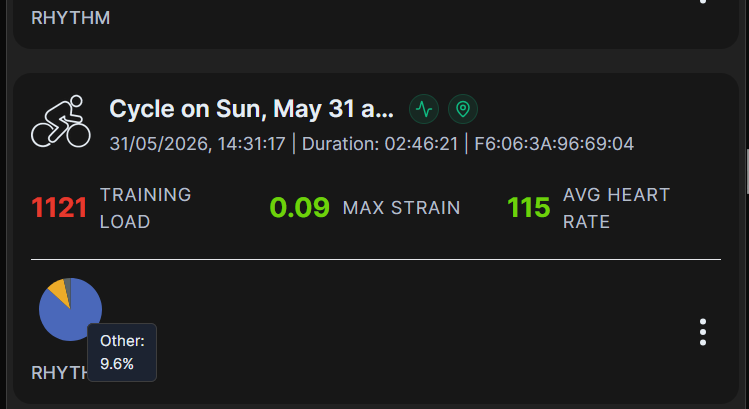
The Frontier X web app gives a worrying overview. 9.5% of my heart rhythm was ‘Other’. Shocking the first time you see it on your own heart data — but ‘Other’ covers beats the algorithm cannot confidently assign to normal sinus rhythm: ectopic beats, minor arrhythmias, movement artefacts, that sort of thing. A few per cent is common and usually benign. Specific clusters at a particular point in a workout are worth discussing with a doctor, as are alerts that Fourth Frontier automatically detects. In my case, the distribution looks OK, and the events (shown below) occurred before the ride started.
new ECG metrics
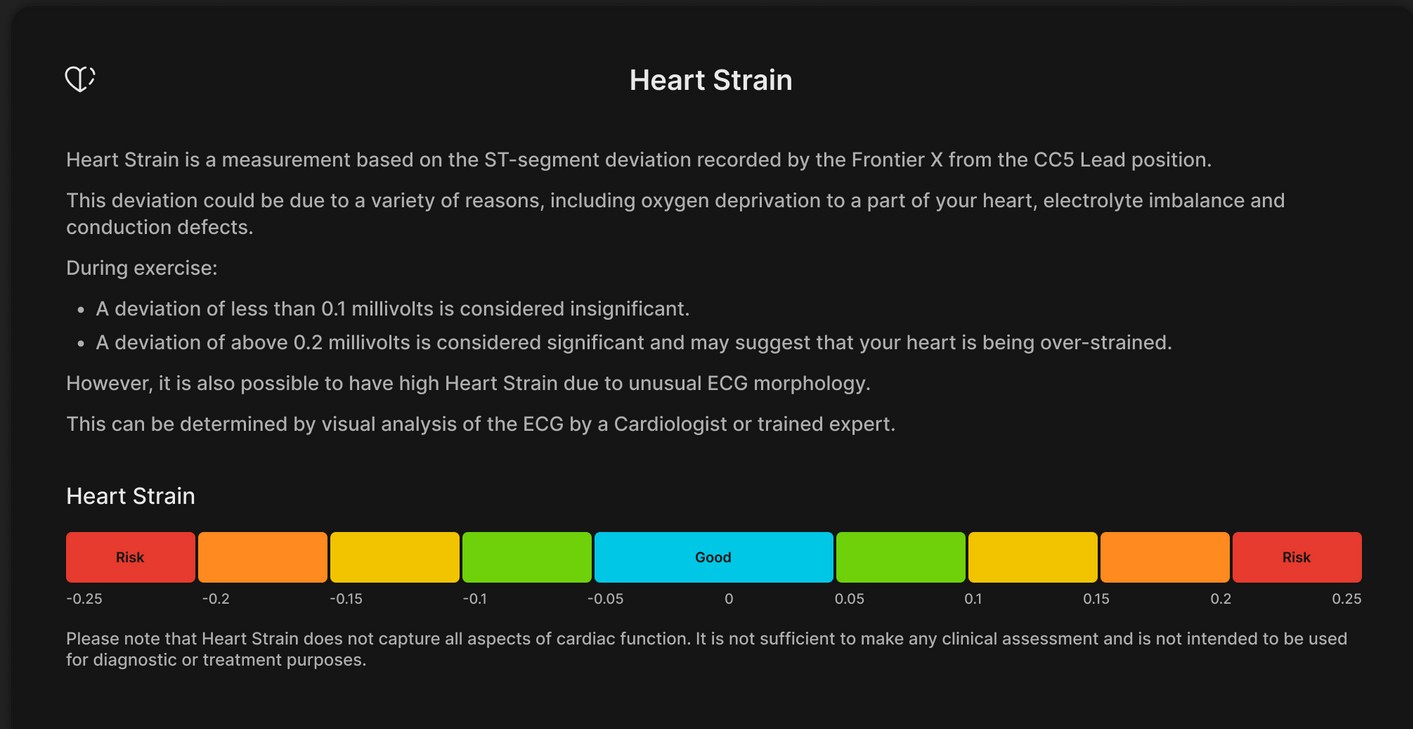
A novel metric on show here is ‘strain’, which differs from how ‘strain’ is defined on other platforms. Here, it refers to heart strain when analysing the ST segment of an ECG trace.
I’ve covered ST segments here before. The ST segment is the brief pause on the ECG trace between the heart contracting and beginning to recover. During exercise, an ST-segment deviation means your heart muscle isn’t getting enough blood, which, if ignored, can be fatal. Handy to know! And that’s precisely what Fourth Frontier’s ECG straps do — more info: Fourth Frontier Zone Review (or the older X2 Review).
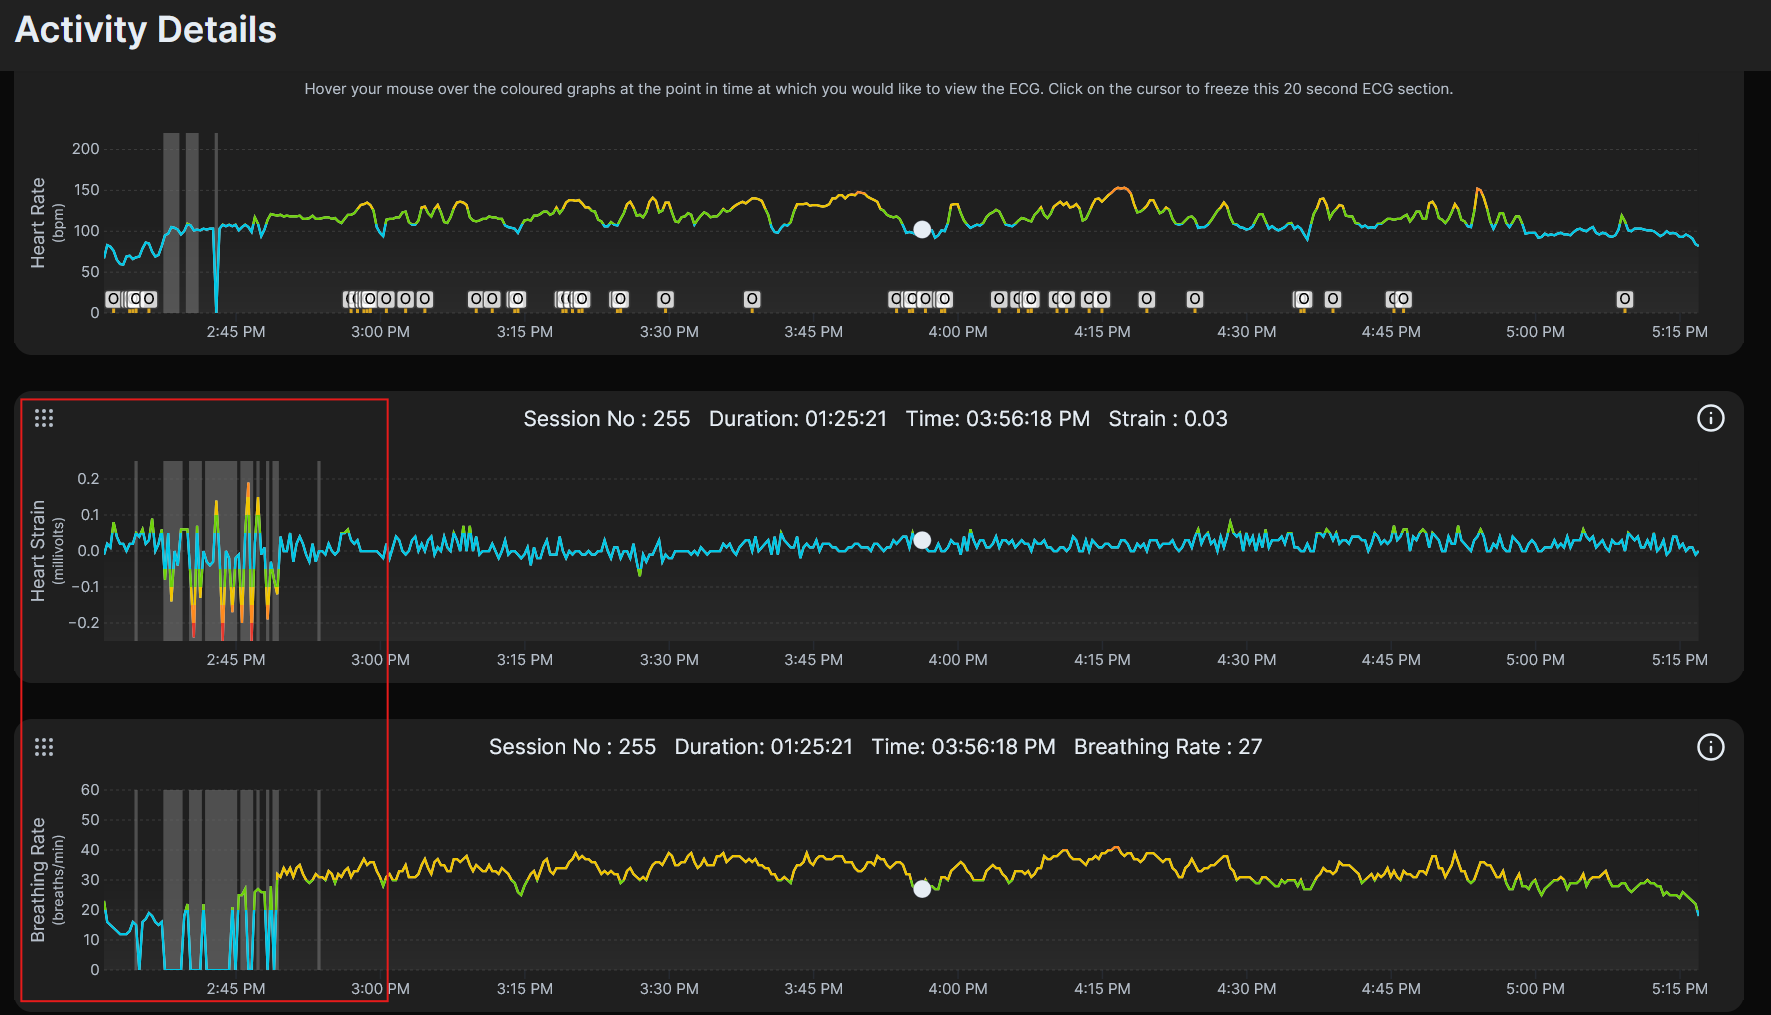
As you can see, my heart strain is probably OK, and the higher values are an anomaly from before the workout started. Probably.
Breathing Rate and Ventilatory Zones
Another interesting metric that pops out is the breathing rate. The ECG detects breathing by reading two related signals: as the lungs fill and empty, the chest wall moves and the ECG electrode position shifts slightly, changing the electrical signal; separately, the heart rate itself speeds up and slows down subtly in sync with each breath, a well-established phenomenon called respiratory sinus arrhythmia (now you know…I’ll test you later).
Garmin derives breathing rate using a similar method, based on HRV from a chest strap.
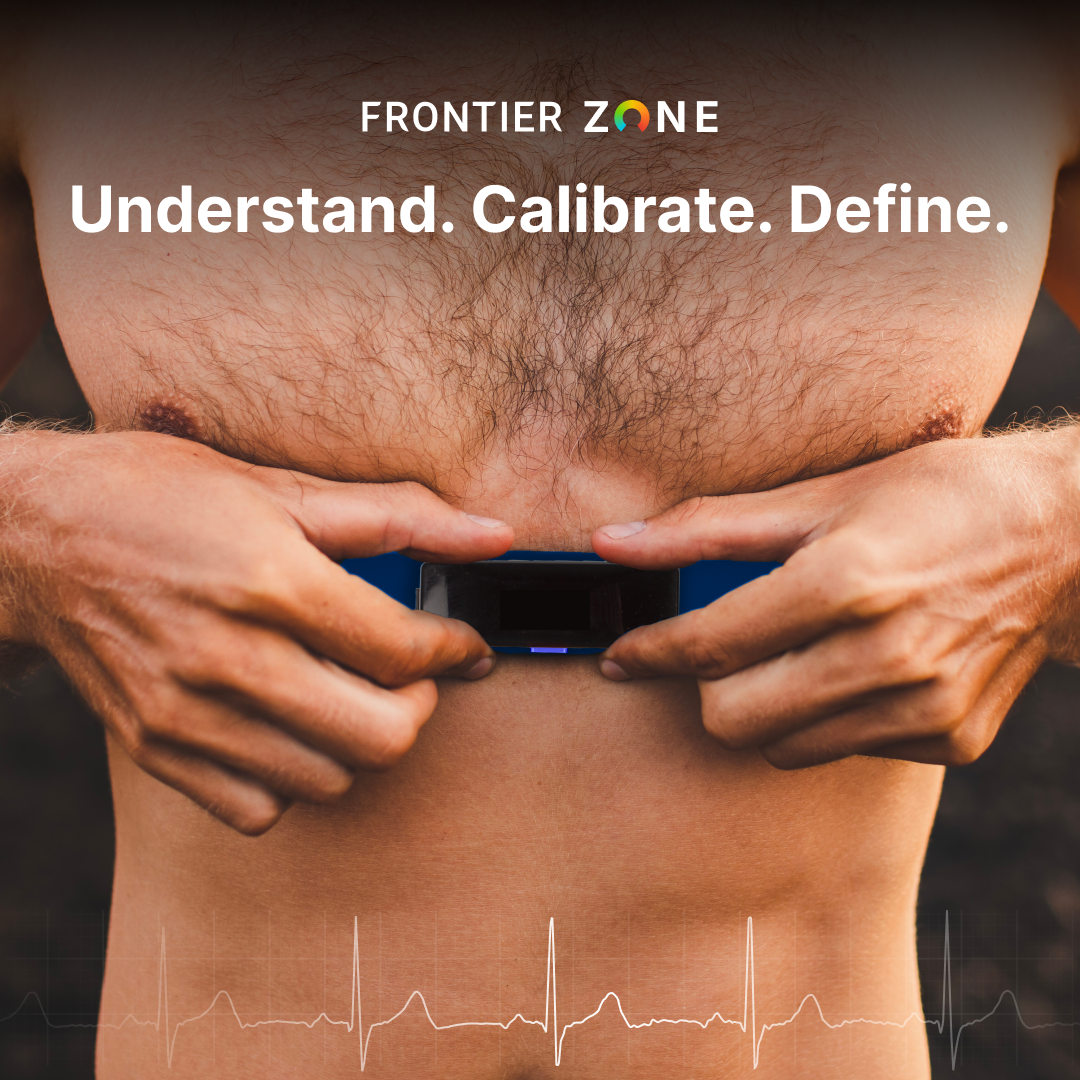
Fourth Frontier claims to have correlated its determination of breathing rate with an ability to define VT1 and VT2 — essentially leading to ventilatory training zones which are an excellent complement to HR and power zones over long duration, where, for example, cardiac drift impacts the usefulness of HR zones. I need to look into this some more before writing a review, as I know there is a competing and seemingly unique method put forward by Tymewear VitalPro, which combines an ECG/HRV with a strain gauge on the rear of the chest strap — the strain gauge is used to determine lung expansion, and hence an estimate of volume and breath rate can be inferred. That company also claims correlations with VT1 and VT2 (they supply Jumbo-Visma and TymeWear might also be in the news some more in the coming weeks — just saying).
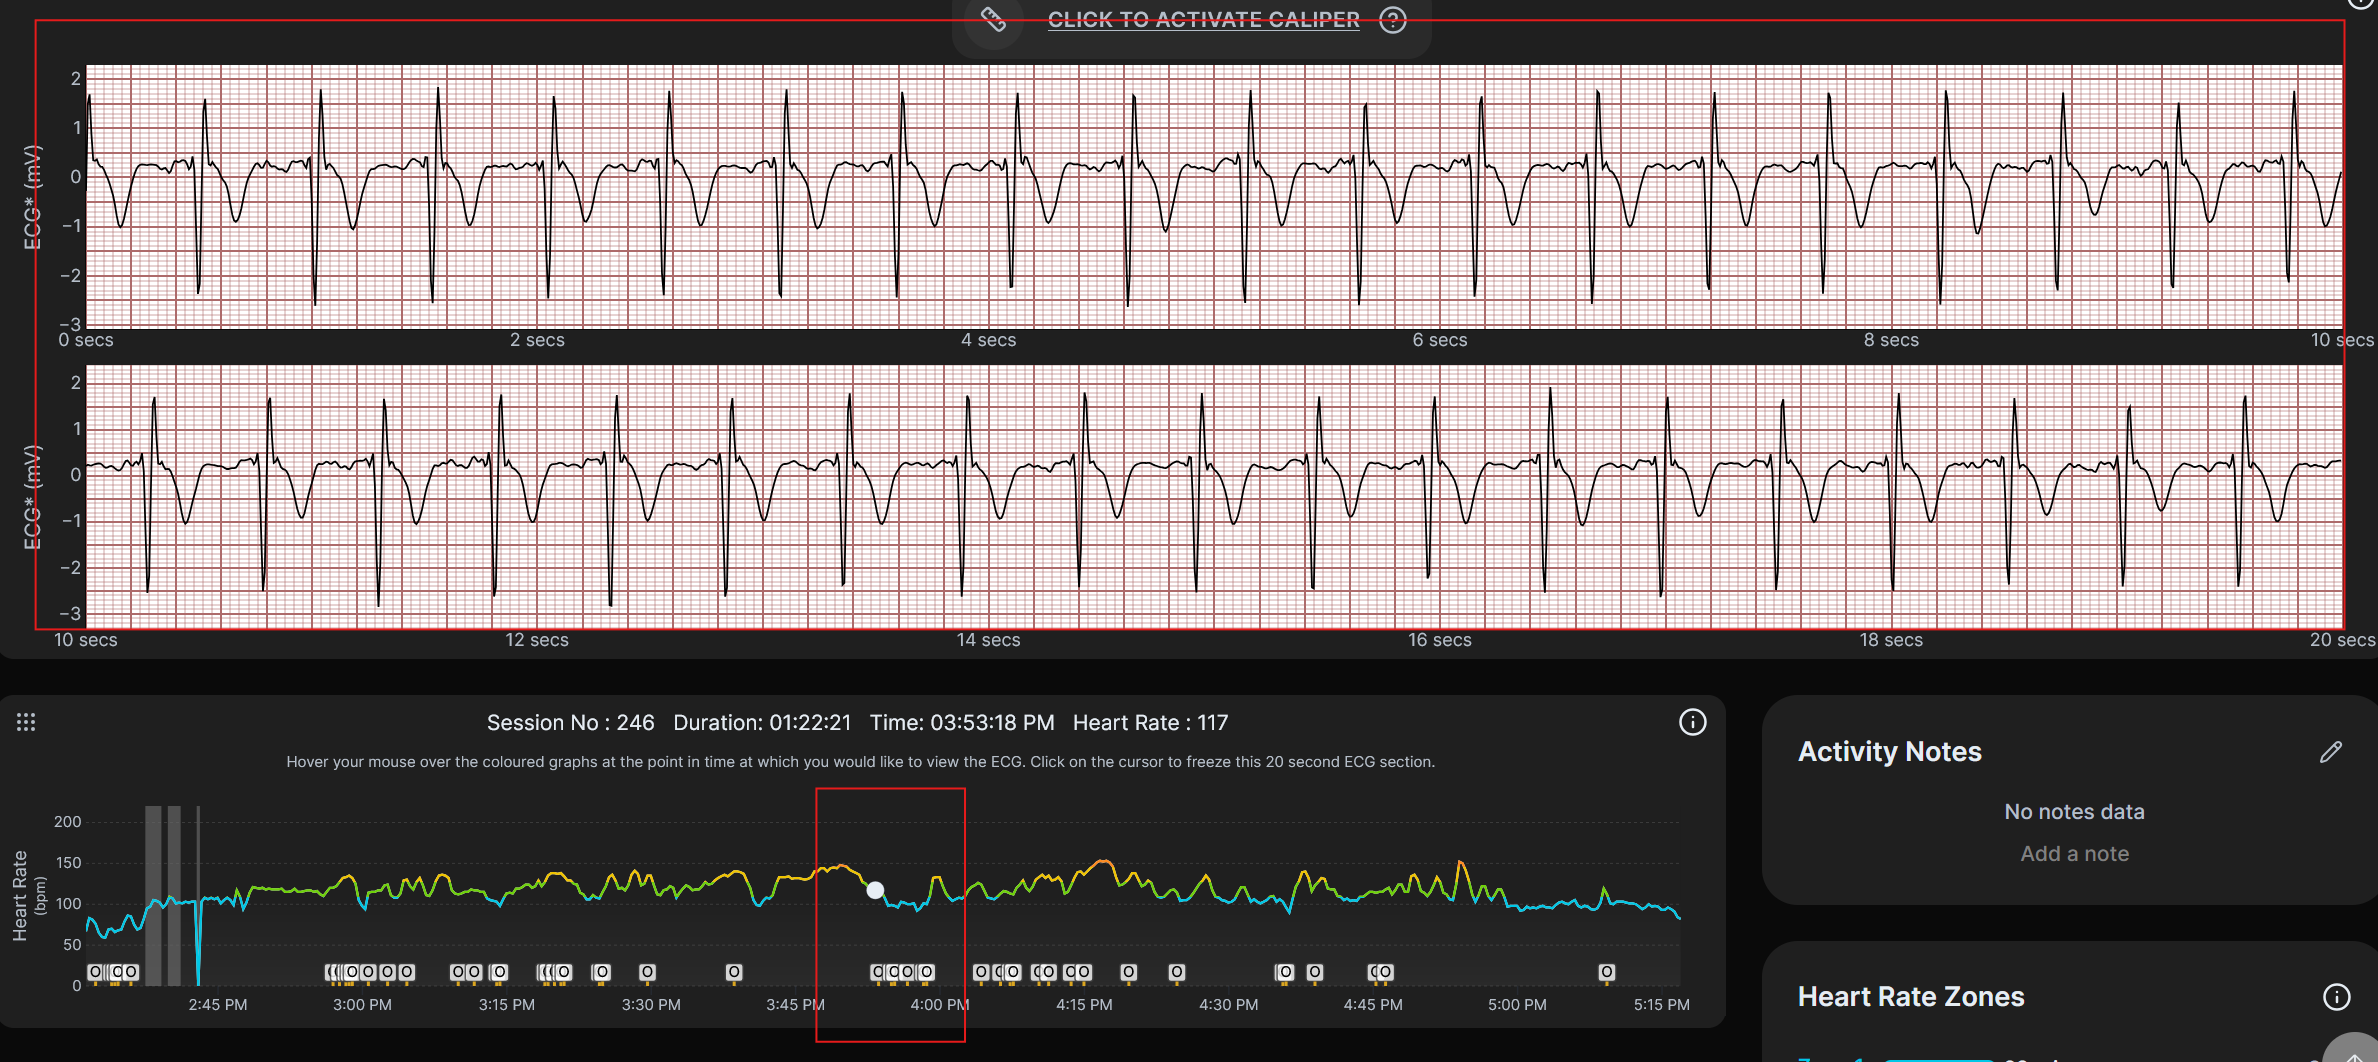
At the top of the same workout page is the ECG trace as shown below. You can see where the white circular cursor is on the heart trace. I manually located it above one of the little white camera icons — these indicate whether events are automated or manual and are triggered by pressing a button on the strap. The 20-second ECG trace from that period is then zoomed in and split over two 10-second periods as shown at the top of the image. Thus, if an event occurred, you could show it to a cardiologist, who would determine whether further investigation is required. In my case, the events are unknown or noise.
Note: a reader has identified that the ECG trace in this post is inverted, i.e., I wore the strap the wrong way around. The ST strain values shown may therefore be unreliable. I am retesting and will update this section.
Other Research
Aside from what you’ve read in this article, I made a somewhat startling discovery: when compared with up to 4 devices used simultaneously, Fitbit Air nearly always records only 20% of the data points.
So it claims to record once every two seconds, but that is a maximum, and in pretty much all my tests, it’s one data point per 5 seconds. Is recording 20% of your data accurate? Opinion: That’s OK at rest, but not during sport.
Further, the 20% it records is pretty accurate, and when moved to the biceps, its accuracy was very close to that of a chest strap in one test.
In some situations, it is undeniably susceptible to different types of motion artefacts. The only bad scenario for me was on the treadmill with what appeared to be cadence-lock.
See this for more details: Fitbit Air Isn’t Truly Accurate
Take Out
Three take-outs today.
- Firstly, regular readers will be pleased to know that the ECG says I will be here to test more devices in the future. My detractors — less so.
- Secondly, statistical presentation matters more than most reviewers acknowledge. We saw that (correctly) moving a single time series by 15 seconds changed the limits of agreement from ±10 bpm to ±4.5 bpm on the same data. That is not a rounding issue — it is the difference between a device looking OK and one that looks excellent. How much published reviewer-grade accuracy data out there silently carries a similar flaw? I don’t know. Neither does anyone else.
- Thirdly, Fourth Frontier has been around for several years, and mainstream sports-tech brands have yet to produce anything comparable to its ECG metrics. A consumer-grade chest strap that monitors ST-segment shifts in real time during exercise, exports clinician-ready ECG traces, and correlates breathing mechanics with ventilatory training zones is a capability gap that Garmin, Wahoo, and Polar have not closed. I think they are working on it, but that is an educated guess. When they do, they will be following Fourth Frontier’s template.
More: TymeWear VitalPro


Scientific References
These are references cited by the brands mentioned here.
Fourth Frontier — cited in product and clinical documentation
- Stöggl, T. and Sperlich, B. (2014). Polarised training has a greater impact on key endurance variables than threshold, high-intensity, or high-volume training. Frontiers in Physiology, 5, 33. PMID 24550842
- Fourth Frontier Technologies / University of Rochester Medical Center (2026). ECG validation against Holter monitoring for atrial fibrillation (URMC-AF-VALIDATION-2026). Presented at ISCE 2026. Sensitivity 94.4%, Specificity 97.9%.
- Liquidia Technologies / Fourth Frontier (active). Cardiac effort and biomarker evaluation in PAH therapy. ClinicalTrials.gov NCT07285655.
- University of Strathclyde / Fourth Frontier (active). Real-world physiological monitoring in COPD. ClinicalTrials.gov NCT06419062.
- Fourth Frontier / Jessa Hospital, KU Leuven (ongoing, FX2-EXERCISE-VALIDATION). Comparative performance of wearable ECG devices during exercise in endurance athletes. Prospective observational cohort study with crossover device comparison.
- AHA abstract (2023). Real-world physiological response analysis. Circulation, 148 (Suppl. 1), 16707. DOI 10.1161/circ.148.suppl_1.16707.
- JMIR Research Protocols (2025). Cardiac effort and functional capacity in pulmonary hypertension (ERJ-00608-2023). doi:10.2196/79503.
Tymewear — cited in product and validation documentation
- Stöggl, T. and Sperlich, B. (2014). Polarized training has greater impact on key endurance variables than threshold, high intensity, or high volume training. Frontiers in Physiology, 5, 33. PMID 24550842 — cited by Tymewear in support of the 2.4x training effectiveness claim.
- Tymewear (2024). Internal validation study: Tymewear VitalPro vs Cosmed K5 metabolic cart for breathing rate and minute ventilation during incremental cycling. 26 participants. Breathing rate MAE 1.2 breaths/min; minute ventilation correlation r = 0.973. tymewear.com/pages/validation-study.
- Hicks, D. et al. (2022). Is the Tyme Wear Smart Shirt Reliable and Valid at Detecting Personalized Ventilatory Thresholds in Recreationally Active Individuals? Sensors, 22(3), 1097. PMC8835019 — independent peer-reviewed validation of an earlier Tyme Wear product for VT1/VT2 detection.
Quick answers
What is the ST segment on an ECG?
The ST segment is the brief pause on the ECG trace between the heart contracting and beginning to recover — the flat line that follows the main spike of each heartbeat. During exercise, a deviation of that flat line above or below its baseline can indicate that the heart muscle is not receiving enough blood for the workload being demanded.
Is an ST-segment deviation during exercise dangerous?
It can be. An ST deviation during exercise is the electrical signal associated with myocardial ischaemia — a shortage of blood to the heart muscle. If the cause is not addressed, a heart attack and, in some cases, cardiac arrest can follow. Most people who experience this have no prior diagnosis and no warning. That is the clinical value of real-time monitoring. If you observe persistent or symptomatic ST deviation, seek medical input — these devices are monitoring tools, not diagnostic instruments.
What does the 'Other' rhythm classification in the Fourth Frontier app mean?
The app classifies each beat of your ECG as a normal sinus rhythm or one of several other categories. “Other” covers beats that the algorithm cannot confidently assign to a normal pattern. A small proportion — typically a few per cent — is common and usually benign, often caused by ectopic beats, minor arrhythmias, or movement artefact during exercise. A persistently elevated proportion, or one that clusters at a specific point during a workout, is worth discussing with a doctor.
What is heart strain as measured by the Frontier ZONE and Frontier X2?
“Strain” on the Fourth Frontier platform refers specifically to ST-segment deviation, not to the training-load definition used by platforms such as TrainingPeaks or Whoop. The device measures how far the ST segment shifts from its baseline during exercise. A shift of 0.2 millivolts or above is the threshold associated with potential oxygen deprivation to the heart muscle in exercise stress test interpretation. The device can be configured to alert at 0.3 millivolts, providing a margin above background noise.
How does the Frontier ZONE derive breathing rate from an ECG?
Two mechanisms are at work. First, as the lungs fill and empty with each breath, the chest wall moves and the electrode position shifts slightly, producing a subtle change in the ECG signal that can be extracted algorithmically. Second, the heart rate itself speeds up and slows down slightly in sync with each breath — a well-established phenomenon called respiratory sinus arrhythmia. Both signals encode breathing frequency, and the device uses them to estimate breath rate without a separate respiratory sensor.
What is the difference between breathing-rate zones and heart rate zones for training?
Heart rate zones are influenced by hydration, heat, fatigue, and caffeine, and drift upward over long sessions even at a stable workload — a phenomenon known as cardiac drift. Ventilatory thresholds (VT1 and VT2), derived from breathing mechanics, reflect the body’s actual metabolic crossover points more directly and are more stable across varying conditions. For long-duration training in particular, breathing-rate zones can provide a more reliable intensity signal than heart rate.
How does the Tymewear VitalPro measure breathing differently from the Frontier ZONE?
The VitalPro uses a strain gauge on the rear of the chest strap to detect the physical expansion of the rib cage with each breath, allowing it to estimate not just breathing rate but also tidal volume and minute ventilation — the total volume of air moved per minute. The Frontier ZONE derives breathing rate from the ECG signal alone. Both approaches claim correlations with VT1 and VT2, but the underlying sensor technology and the richness of the respiratory data they produce are different.
Why does a 15-second timestamp offset matter for heart rate comparison accuracy?
Accuracy tools such as the DCRainmaker Analyzer calculate statistics by pairing data points at matching timestamps from two devices. If one device’s timestamps are offset by 15 seconds, the paired points no longer represent the same instant in time. During sections of a ride where heart rate is changing rapidly, this produces large apparent disagreements that disappear entirely once the offset is corrected. The bias barely changes; the limits of agreement narrow dramatically. It is a statistical artefact caused by phase misalignment, not a measurement error.
Can I share Fourth Frontier ECG data with my cardiologist?
Yes. The Frontier X2 and Frontier ZONE allow export of up to three hours of continuous ECG trace as a PDF from the online dashboard. A cardiologist can review this in the same way they would any single-lead ECG recording. The devices are not replacements for clinical investigation, but the exported trace — particularly if recorded during a hard effort when symptoms were present — is a meaningful supplement to a clinical conversation.
Is the Frontier X2 or Frontier ZONE an FDA-approved medical device?
No. The Frontier X2 and Frontier ZONE are classified as wellness and fitness devices, not medical-grade diagnostic tools. The separate Frontier X Plus product from Fourth Frontier holds FDA 510(k) clearance as a prescription-based medical ECG monitor for arrhythmia detection. The X2 and ZONE are not intended or certified for clinical diagnosis.
This article is part of the site’s sports science reference for endurance athletes.
For the full Amazfit range, accuracy data and Zepp Health analysis: Amazfit sports watch guide. For full context on the Fitbit Air within the Google ecosystem: Google Fitbit and Wear OS hub.
Last Updated on 11 October 2026 by tfk the5krunner
Small things I always use
- Garmin 90-degree charging adapter: Charges your Garmin from any USB-C cable. Essential when travelling. I use one.
- Body Glide: The blue anti-chafe stick swimmers and runners carry. I use it.
- Speedo earplugs: Fewer ear infections and no cold-water dizziness. I use them.
- Dryrobe Advance: My winter changing robe for open-water swims. I use one. A cheaper option is the AONYIYI changing robe.
- Maurten: Race fuel that stays easy on the stomach. I use them.
- Garmin charging puck: The quickest way to top up before a session. I use one.
- Injinji: Toe socks that stop rubbing, so you run more. I use them.
- Ultimate toe protectors: Stop black toenails on long runs. They work. I use them.
- Compressport R2 v2 calf sleeves: My calf sleeves of choice. I use them.
- Cellucor C4: My pre-workout before hard sessions.
- TPU tubes: Schwalbe Aerothan, Tubolito and Pirelli SmarTube. Light, tiny spares. I use all three.
- G8 insoles: Adjustable insoles that are good. I use them.
- Cycplus Cube: A 97g electric pump that gets a road tyre rideable in two minutes. I carry one. 5% off with code THE5KRUNNER.
Watches and sensors
- Polar H10: My daily driver for waking HRV.
- Polar Verity Sense: My backup arm-worn HR sensor.
- Nomad bedside charger: Charges my iPhone and Apple Watch overnight. I use it, and many of their bands.
- Train.Red: The best muscle oxygen sensor I’ve used.
- Tymewear: Accurate heart rate and reliable ventilatory zones. I use it to pace endurance rides over an hour.
- Garmin Forerunner 970: A pro-grade triathlon watch. I use this.
- Apple Watch Ultra 4: My daily smartwatch. No phone needed on rides.
- Garmin Fenix 9 Pro: I’ve just bought one.
On the bike
- Continental GP5000 for everyday riding, and Aero 111 on the front for special occasions.
- Helmets: Specialized S-Works Evade 3 for road riding, and Rudy Project Wing for TT-style races. I use both.
- Ravemen FR300: A front light that mounts under your Garmin or Wahoo. I use one.
- Wahoo TRACKR Radar: I use it on one bike and Varia on the other. They perform the same.
- Garmin Varia RTL515: Radar that warns you of cars from behind. I use this model.
- Wahoo ELEMNT Roam 3: The bike computer that’s easy to use. I use mine on most rides.
- Favero Assioma Pro RS2: Accurate power pedals that swap easily between bikes. I use this model.
Home and indoor training
- NPE Runn: Makes my basic treadmill smart, sending more accurate speed and distance to my watch and Zwift. I use it.
- Google Wifi: Keeps Zwift connected in my pain cave. I use it.
- Apple TV 4K: Zwift on the big screen. I use two.
- Google Nest Doorbell (wired, 2nd gen): My video doorbell, running in both Google Home and Apple Home. I use it.
Health, recovery and sleep
- FreeStyle Libre 3 Plus: Shows how my blood sugar responds to diet.
- hDrop: Measures my sweat loss in summer and indoors.
- Fourth Frontier Zone: Checks my heart under load in hard sessions.
- Oura Ring 5: My partner’s recovery tracker of choice.
- Kineon MOVE+: Red light therapy for niggles. It works.
- Eight Sleep: A cooling mattress cover my partner and I use nightly.
Reader-Powered Content

This content is not sponsored. It’s mostly me behind the labour of love, which is this site, and I appreciate everyone who supports it.
Support the site: Follow (free, fewer ads) · Subscribe (paid, ad-free) · Buy Me A Coffee ❤️
Written by real people, with AI assistance. Fact-checked and verified for originality. See the Editorial Policy. FTC: Affiliate Disclosure — some links pay commission. As an Amazon Associate, I earn from qualifying purchases.
tfk is the founder and author of the5krunner, an independent endurance sports technology publication. With 20 years of hands-on testing of GPS watches and wearables, and competing in triathlons at an international age-group level, tfk provides in-depth expert analysis of fitness technology for serious athletes and endurance sport competitors. ID

““How on Earth do you know what the time shift is?” There will obviously be algorithmic ways to correct, but… Jeez, good luck, Ray! ”
By default, we align to the timestamps in the file. This typically does work 99.9% of the time, because the device itself is near-constantly timesynced. GPS devices do so the moment they power on and sync to GPS, and virtually all other wearables do this constantly with your phone.
That said, where things can get a bit skewed is devices that either don’t sync frequently, or, aren’t setup to sync. For example, sometimes some bike computers will drift a few seconds if I go a week or so without a GPS-ride (so, for indoor training). That means I now need to have another source of aligning data.
Typically, unless I’m specifically testing power meters or trainers, for indoor rides I’ll often try to ensure the ‘new device’ (e.g. watch/etc), is paired to the same power meter as another device. That way I can use that as a reference.
Finally, when it comes to alignment overall (methodology-wise), it’s tough. From a purely “scientific” standpoint, if a HR sensor has lag (e.g. 4-6s of lag as might be the case for some optical HR sensors), then technically speaking, it’s simply incorrect. It’s not as accurate as a device that doesn’t have lag (especially since lag tends to occur in fast drops/rises, rather than slow ones). That said, practically for the vast majority of scenarios, the lag often seen in HR intervals tends to even itself out (meaning slow to rise, but also slow to fall). Thus from a zone/etc standpoint, for most people…shrug.
In my experience timestamps do work in by far the majority of cases. I’d say it was more like 90-95% tho (not 99.9%), mainly if there is an inclusion of non-GPS enabled device in the sample. (GPS setting the timestamps normally in workouts for watches, as you say also applies to devices that haven’t synced for a while as well).
Using the power curve as a proxy for time probably also is a good method. I’m pretty certain that different bike computer brands have different lags when DISPLAYING power data (presumably due to processing on the head unit). However saving data (as you are referencing) is different and must have a better chance of being close to the real timestamp – so that probably is a very good method if there is power data.
Fourth Frontier may know the change in voltage from the HR sensor, but garmin doesn’t. It only knows the r-r time between beats, and even then only when wearing a chest strap with accurate r-r data. If you’re using optical HR data it won’t know r-r data, at least not with any accuracy so no idea how Garmin’s breathing rate metric works.
Also while breathing rate can be calculated from r-r data its accuracy can depend greatly on if your breathing rate is your unconscious rate or if you’re trying to control your breathing. If you try to control your breathing its not a very useful metric. I think from how the algorithm that is used works as it makes assumptions on how the data should look (They don’t have much computing power to do lots of calculations) Going By Stephen Seiler’s (The guy associated with polarized training) work with Tymewear and what he’s said comparing HRV based breathing rate to actual measuring of breathing they don’t always align
Breath rate works from a Garmin chest strap’s HRV. I probably wasn’t clear on that and will add a note, ty.
I’ve not completed my research (I know some of what Seiler has done), but my understanding is that the breath rate (volume) analyses are most useful way beyond the hour mark. I would assume that conscious breathing is less of an issue by then (I could be wrong). I appreciate FF are using VT in the same way as TymeWear (https://the5krunner.com/tymewear )
You do realize that the ECG is not a “normal” QRS (or T wave). Either the module contacts were reversed (like an upside down Polar H10), or the software is inverting the signal. In either case, the ST will also be biased in the wrong direction. Oh, and the best breathing rate methodology is not RR timing, it’s R peak voltage.
I defer to your greater knowledge as always! ty, I did know it had to be worn the right way around. edits made
Can’t seem to find the Frontier Zone HR strap, can you confirm the url?
hi rui. This link is definitely correct: https://the5krunner.com/FourthFrontierZone. however it’s not available i nall geo’s. So if might not resolve at all in certian countries outside europe
I’m in Portugal, not using VPN, the url is resolving to
“https://5krunnerhttps//uk.fourthfrontier.com/products/frontier-zone”
(params removed for clarity)
ok ty
it doesn’t do that when i test it. there might be a redirect on the brand’s site as i have my own landing page there, i assume they must redirect to it by geo themselves. ill check
Anyway probably user error because I couldn’t find it directly on the website, but it’s obvious what is the correct url 😅
Medical equipment should display what its sensors are reading so the doctor can read the raw data knowing that edge cases could be real issues. But shouldn’t a device like this be able to guess the electrical signal being read is inverted? i.e. the device would assume you have a “normal” rhythm and would give a notification to check if you’re wearing it right and in the notification tell them to seek medical help?
Breath rate works from a Garmin chest strap’s HRV is right, but also shows issues. If you’re using a HR monitor that doesn’t give good r-r timing info? If the chest strap is paired over ant currently garmin units don’t take advantage of the extra data in the ant packets to make up for dropped packets leading to poor r-r data quality.
I wish there was an agreed way to check HRV data from HR sources to make comparisons easier and hold products to account for the quality of the data they produce. Like DC Rainmaker does a great job of checking HR accuracy in his exhaustive reviews, but that is just the bpm rate. Seems like HRV is behind many of the advanced metrics but there is very little checking of HR straps if they produce good r-r data for devices to process
Thanks Eli.
On the off chance that another ECG chest strap is coming out soon, I’ll be thinking how I can do just that. I think I mentioned to you before I’d done something in the HRM600 review taking 1-minute HRV readings in pairs. Not definitive science by a long chalk but it showed that there was something wrong with HRM600’s HRV.
As you can see above dcr developed his Analyzer tool to cover more types of data points so i assume he intends to use it to do more kinds of testing that he was before. It’s certainly helped me do that.