Amazfit’s Answer to Garmin’s ClimbPro – Is Amazfit’s Elevation Overview any good in trail mode?
Amazfit’s ‘Elevation Overview’ is close to a minimum viable product that just does the job of breaking a pre-planned route’s ascents and descents into individual climbs, presented on a dedicated watch screen with a few additional metrics. It may be all you need, but it is behind the features offered by the more mature Garmin ClimbPro. In balance, ClimbPro was an unusable, bug-ridden mess when it was first launched.
I spent this morning testing it after an IoW bike test yesterday.
It’s Day 2 of the British summer, and it was a hot one – 31 Celcius. Time for some early morning trail runs at Wimbledon, following a planned route with the Amazfit Cheetah 2 Ultra. It’s a little bit hilly, and even though I used to live close to here, I wasn’t familiar with several of the smaller tracks today, so it was an interesting run if nothing else.
Devices and Configurations
For GPS, I had the Garmin Forerunner 970 (FR970), Suunto Race 2, Huawei Watch GT Runner 2 and, of course, the Amazfit Cheetah 2 Ultra. I used the TymeWear VitalPro ventilatory measuring chest strap. Also measuring heart rate were Whoop MG and Polar Verity SENSE. Plenty of reference devices on show here today.
I changed the AOD to a 30-second timeout during the workout, with maximum brightness and maximum wrist-turn sensitivity.
Amazfit “Elevation Overview” – Tested
The upgraded Trail Running Mode includes a new Elevation Overview (feature) that colour-codes slope difficulty across the entire route, giving runners a clear, at-a-glance view of what’s ahead and how to manage it. [Amazfit]
I downloaded the maps to my watch and planned a 10k trail route on the Zepp app, going from Richmond Park to Wimbledon Common. The run covered 2 hills of note, only one of which was on the planned route, because I started 2km from where I parked the car.
Here is how to create a simple route with elevation information. The process is easy, though the route creation step isn’t in an obvious place.
- Zepp App > Workout Tab > Create Route
- Create a route and send it to the device
- Amazfit Watch > Choose A Sports Profile, e.g. Trail Run > Settings > Navigation > My Route > Choose Route
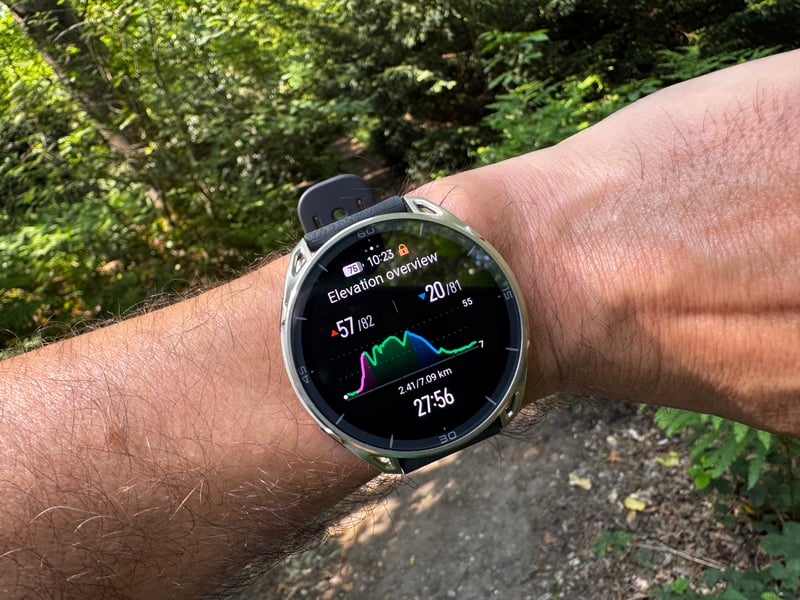
The elevation screen falls into two sections: the elevation overview and individual climbs and descents. The elevation profile is part of the new Elevation Overview, which now colour-codes the severity of ascents. Several competitors already offer alternate versions of this with colour coding, and the feature is also available on the Cheetah 2 Pro.
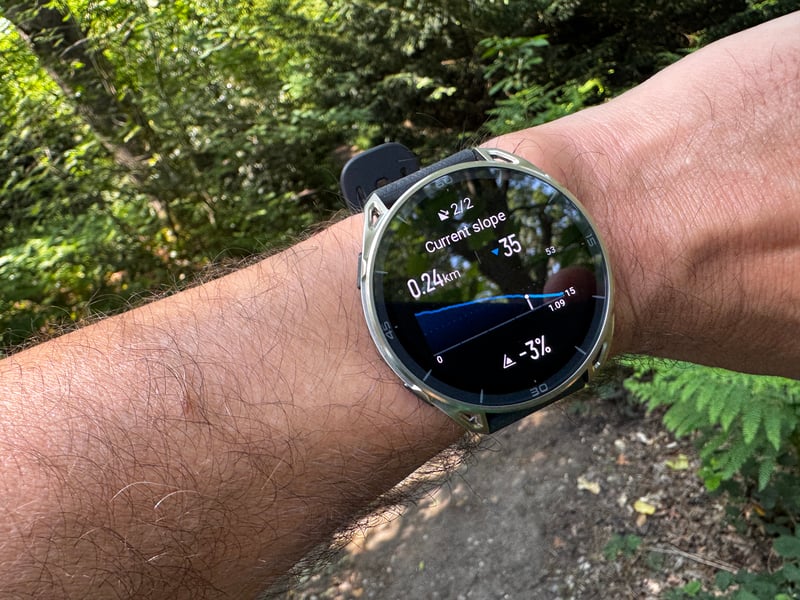
You get a dedicated Elevation Overview screen showing the current or next slope — either an ascent or a descent. I couldn’t find how to configure the metrics on this screen, so the defaults appear to be fixed. Based on testing, the displayed fields for Amazfit’s Elevation Overview appear to be:
- slope type (ascent or descent)
- slope number in the current route
- slope length (km)
- slope progress (km)
- slope elevation progress (m)
- starting elevation (m)
- ending elevation (m)
- total slope elevation gain/loss (m)
- average grade (%)
Once you have loaded the route, you can see an overview of the entire route plus every climb and descent. After the activity has started, the elevation profile only appears if you have configured it as a metric for display — I did — and the current or next slope screen is then added automatically to the ones you already have.
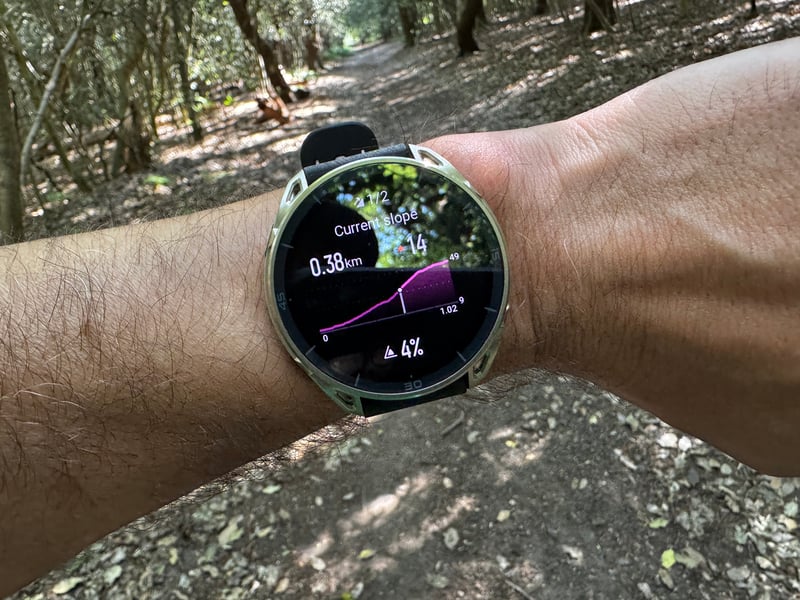
My view is that this is a useful feature with clear practical uses for trail runners. In the watch format, it is indeed most useful for that sport, where hills of note are more likely and pacing efforts over very long distances are the key to both finishing and winning. It could also be useful if extended for cycling hill climbs, but the watch format is not ideal for monitoring progress on climbs from the wrist. If Amazfit introduced a phone map mirroring feature for navigation, I would revise that opinion — currently, you can only start a bike workout directly in the Zepp app.
The meaning of the metrics is not entirely clear at a glance. In the final image, for example, it is not obvious whether 4% represents the current gradient or the average gradient to go. Both are useful figures. The current gradient is inevitably prone to error: if it comes from the course file, the file could be wrong, or a slight GPS position error could produce an incorrect reading. If it comes from barometric/GNSS sensor fusion, the reading will be more stable but slower to respond to changes and potentially wrong when not moving at all (thinking of you here, Garmin).
Visually, the screens are clean, but other vendors use vertical shading bars to indicate grade changes, which are generally easier to scan at a glance.
Recovery Trail Run Heart Rate Test
The Amazfit Cheetah 2 Ultra tracked closely with the reference chest strap and all other sensors throughout this test. The chart makes that clear, and the DCRainmaker Analyzer (beta) provides the numbers if you need the quantitative proof (the chart’s easier, right?)
Key Metrics
- Average Heart Rate: 128.88 bpm, compared to 128.95 bpm on the TymeWear VitalPro chest strap.
- Vs TymeWear VitalPro (FR970): -0.1 bpm bias. Limits of Agreement: -5.4 to 5.1 bpm.
- Vs Polar Verity SENSE: -0.3 bpm bias. Limits of Agreement: -5.2 to 4.6 bpm.
- Vs Whoop MG: -0.3 bpm bias. Limits of Agreement: -5.0 to 4.4 bpm.
Performance Summary
Bias under 0.3 bpm across all three comparisons, with tight limits of agreement throughout. The Cheetah 2 Ultra rates Excellent against all three reference devices in this test.
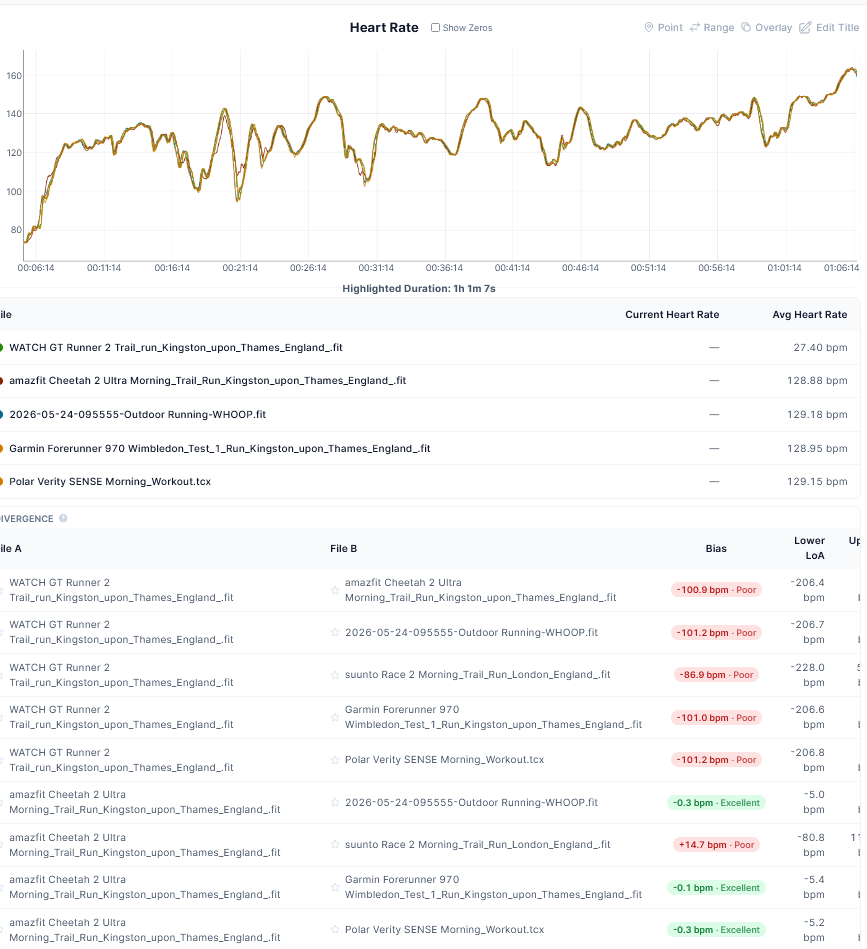
Suunto was excluded as it was handheld, and thus the optical HR could not be used.
Recovery Trail Run GPS Accuracy Test
Having waxed lyrical about the Huawei Watch GT Runner 2’s GPS performance on roads, the picture changes in trail run mode today: it was not great. This aligns with findings from Rainmaker’s pre-launch testing and my own earlier results on the same watch, where the sports profile was cited as a partial explanation for conflicting test results. That lesson applies more broadly and is perhaps relevant here: GPS performance may vary with the selected profile if the algorithm handles slopes and tree canopy signal loss differently. I used trail run mode for all devices here (because it was a trail run!).
Another factor was that both the Huawei Watch GT Runner 2 and the Suunto Race 2 were held in my hand rather than worn on the wrist, which may affect the accelerometer readings, which in turn may be fused with GPS in trail mode to give a position (plausible speculation).
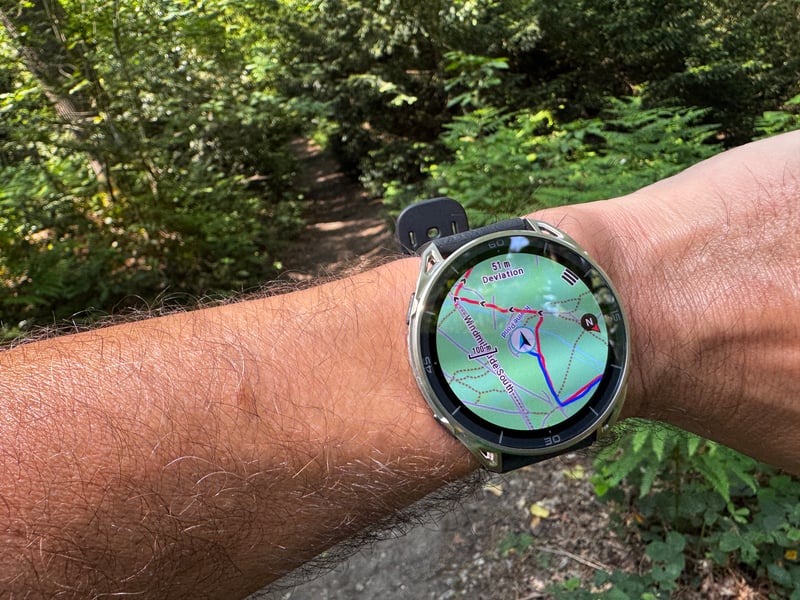
As is often the case, the FR970 performed decently today, though its GPS accuracy record has been inconsistent in other sessions. The Cheetah 2 Ultra appeared good at the zoomed-out level.
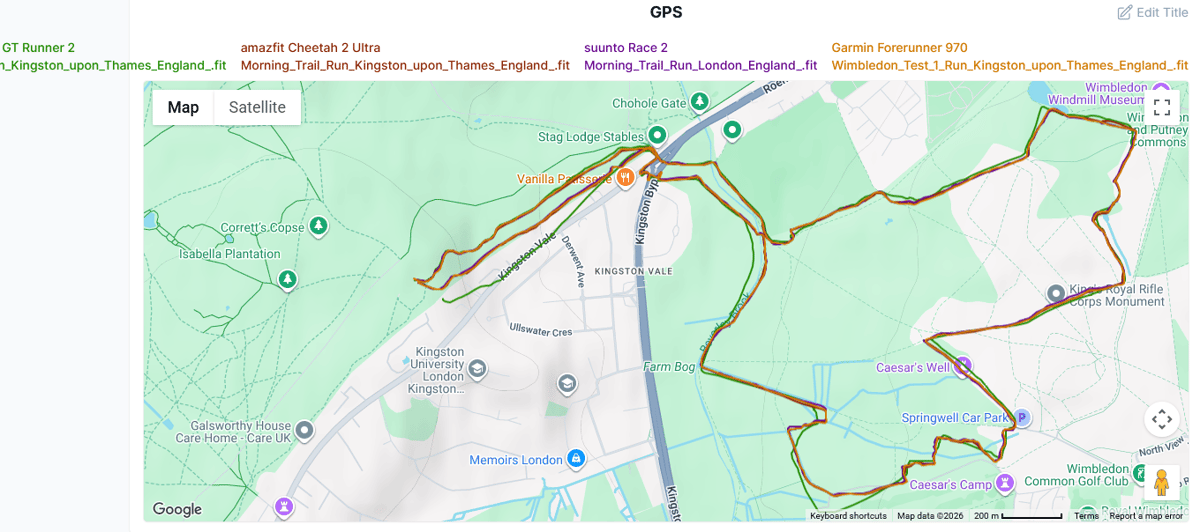
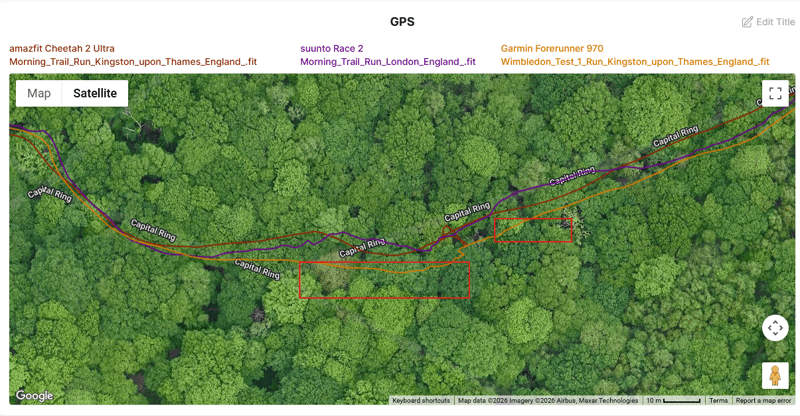
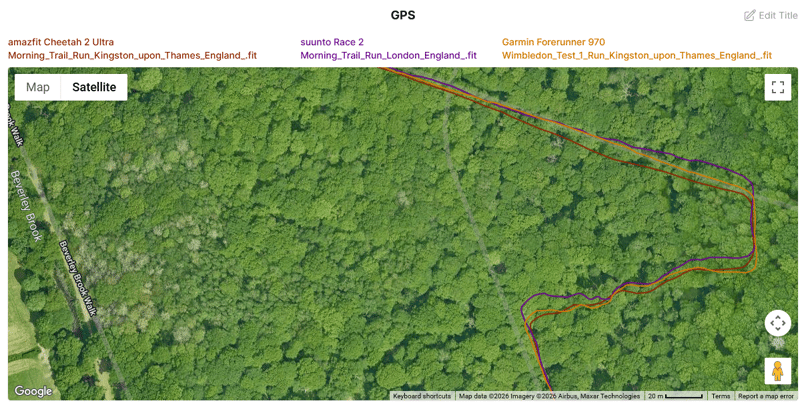
In detail, none of the devices was perfect. The FR970 produced the best overall track — one of the images below shows a corner deviation from it, but it remained the benchmark on the day. The Suunto Race 2 had issues again. I rated the Cheetah 2 Ultra as better than average overall, though it needs a few refinements to reach the level of accuracy I get from competitors running dual-frequency GNSS chipsets.
Wrist Sensitivity
At maximum sensitivity, there was a noticeable delay from turning my wrist to the screen coming on, worse than in normal mode, at around a second. Very odd.
I did NOT note the exact starting battery level, but I think it was 80%. Thus, finishing at 74% as recorded in a photo equates to about 20 hours of battery life in full accuracy GPS mode with quite aggressive display settings. Not bad (up to 33 hours claimed for Trail Mode)
Re-Routing
I am still at something of a loss as to whether and how the Cheetah 2 Ultra reroutes on a wrong turn – it claims to have on-device rerouting. Testing on the Cheetah 2 Pro again showed no rerouting on the display.
Today I made several wrong turns, and the voice prompts — which I had forgotten to disable — did give correct left/right instructions. Whether that constitutes active rerouting or simply continued prompting along the original route was unclear to me at the time. What I can say is that verbal rerouting appears to function differently in some way; visual rerouting on the map did not.
Takeaway
Elevation Overview is useful but not class-leading. The metrics are fixed, and the colour-coded line is a genuine addition. Garmin ClimbPro has more depth, but it has had far longer to mature.
Trail heart rate is the strongest result yet from the Cheetah 2 Ultra — sub-0.3 bpm bias across three references is hard to fault. This is pretty good for me, as I am generally a poor subject for OHR accuracy.
Trail’s dual-frequency GNSS accuracy is better than the average but not up to peers using similar tech. Navigation and rerouting need more sessions before a verdict is possible.
FAQ
Does the Amazfit “Elevation Overview” work for cycling?
The feature is available in compatible profiles, but the watch format is not well-suited to monitoring climbing progress on the wrist. Amazfit currently does not offer phone map mirroring for cycling navigation, which limits its practical use compared to a dedicated head unit.
How does the Amazfit Elevation Overview differ from the Garmin ClimbPro?
Both break a route into individual climbs and descents with dedicated screens. ClimbPro offers configurable metrics, a longer track record, and more refined display options, including vertical grade shading. Amazfit’s implementation colour-codes slope severity, which ClimbPro does not do natively, but the metrics on the Elevation Overview screen are fixed and cannot be customised.
For the full Amazfit range, accuracy data and Zepp Health analysis: Amazfit sports watch guide.
Last Updated on 11 June 2026 by the5krunner
My favourite kit and nutrition
- Injinji – Runners protect your toes. Avoid discomfort and minor injury. Run more. run faster. I use them.
- Garmin 90-degree charging adapter — the small adapter that keeps your charging cables tidy. Essential for race day. I use one.
- Garmin charging puck — the fastest and most reliable way to top up your Garmin before a session. I use one.
- Ravemen FR300 — front light that mounts directly under your Garmin or Wahoo head unit. Keeps your bars clean and your beam pointed where it matters. I use one.
- Body Glide – The Blue anti-chafe stick that all swimmers and many runners use. I use it.
- Maurten — the race nutrition trusted by elite athletes. Gels and drink mix engineered to be easy on the stomach. I use them.
- Garmin Varia RTL515 — radar rear light that alerts you to vehicles approaching from behind. Pairs with your Edge or Garmin watch. I use this model.
- Favero Assioma Pro RS2 — the power meter pedals most serious cyclists end up choosing. Accurate, easy to move between bikes. I use this model.
Reader-Powered Content

This content is not sponsored. It’s mostly me behind the labour of love, which is this site, and I appreciate everyone who supports it.
Support the site: Follow (free, fewer ads) · Subscribe (paid, ad-free) · Buy Me A Coffee ❤️
All articles are written by real people, fact-checked, and verified for originality. See the Editorial Policy. FTC: Affiliate Disclosure — some links pay commission. As an Amazon Associate, I earn from qualifying purchases.

tfk is the founder and author of the5krunner, an independent endurance sports technology publication. With 20 years of hands-on testing of GPS watches and wearables, and competing in triathlons at an international age-group level, tfk provides in-depth expert analysis of fitness technology for serious athletes and endurance sport competitors. ID

Because Garmin has introduced climb pro already some years ago and Amazfit has started that recently, I think they are on a good move. We will see…